
Pepe Price Forecast: PEPE holds gains as on-chain, derivatives data support recovery
作者 Manish Chhetri
发布日期: 16 Feb 2026 | 修改日期: 16 Feb 2026


热门文章

Pepe (PEPE) is stabilizing at $0.0000048 at the time of writing on Monday, after recovering over 16% in the previous week. Supporting on-chain and derivatives data hint at further upside, with whale accumulation rising alongside long bets.
- Pepe price steadies at $0.0000048 on Monday after recovering over 16% in the previous week.
- On-chain and derivatives data indicate further recovery, as whale accumulation rises alongside long bets among traders.
- The technical outlook highlights potential upside to the immediate resistance at $0.0000052.
Pepe (PEPE) is stabilizing at $0.0000048 at the time of writing on Monday, after recovering over 16% in the previous week. Supporting on-chain and derivatives data hint at further upside, with whale accumulation rising alongside long bets. The technical outlook suggests that PEPE could test its immediate resistance at $0.0000052 if bullish momentum persists.
On-chain and derivatives data show a bullish bias
Santiment’s Supply Distribution data supports a bullish outlook for PEPE, as whales are buying the frog-theme based memecoin at recent price dips.
The metric indicates that whales holding between 100,000 and 1 million (red line), 1 million and 10 million (yellow line), and 10 million and 100 million tokens (blue line) have accumulated a total of 11.82 billion PEPE tokens since February 11.
 [10-1771227236707-1771227236708.49.59, 16 Feb, 2026].png)
Santiment data indicate that the Pepe ecosystem’s trading volume (the aggregate trading volume generated by all exchange applications on the chain) reached 905.99 million on Sunday, the highest level since mid-January, and steadied at 744.80 million on Monday. This volume rise indicates a surge in traders’ interest and liquidity in Pepe, boosting its bullish outlook.
 [10-1771227275417-1771227275418.51.30, 16 Feb, 2026].png)
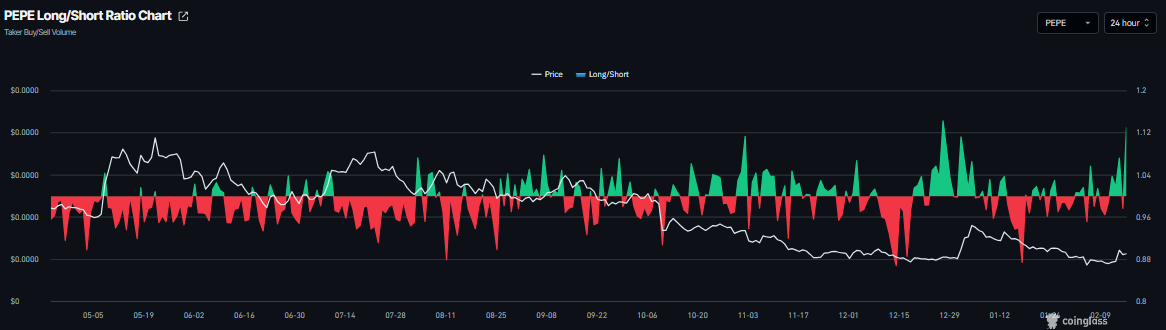
On the derivatives side, Coinglass’s long-to-short ratio for PEPE stands at $1.13 on Monday, nearing the highest level over a month. This ratio, being above one, indicates that traders are betting on the PEPE price to rally.
Pepe Price Forecast: PEPE momentum indicators show early signs of recovery
Pepe price rose more than 16% in the previous week, closed above the 50-day Exponential Moving Average (EMA) at $0.0000046 on Saturday and declined the next day. At the time of writing on Monday, PEPE is trading at around the 50-day EMA at $0.0000046.
If PEPE continues its recovery, it could extend the advance toward the immediate resistance at $0.0000052, its 100-day EMA. A close above this could extend the rally toward the 200-day EMA at $0.0000065.
The Relative Strength Index (RSI) on the daily chart reads 52, above the neutral level of 50, indicating early signs of bullish momentum gaining traction. The Moving Average Convergence Divergence (MACD) showed a bullish crossover on Saturday, further supporting the recovery thesis.
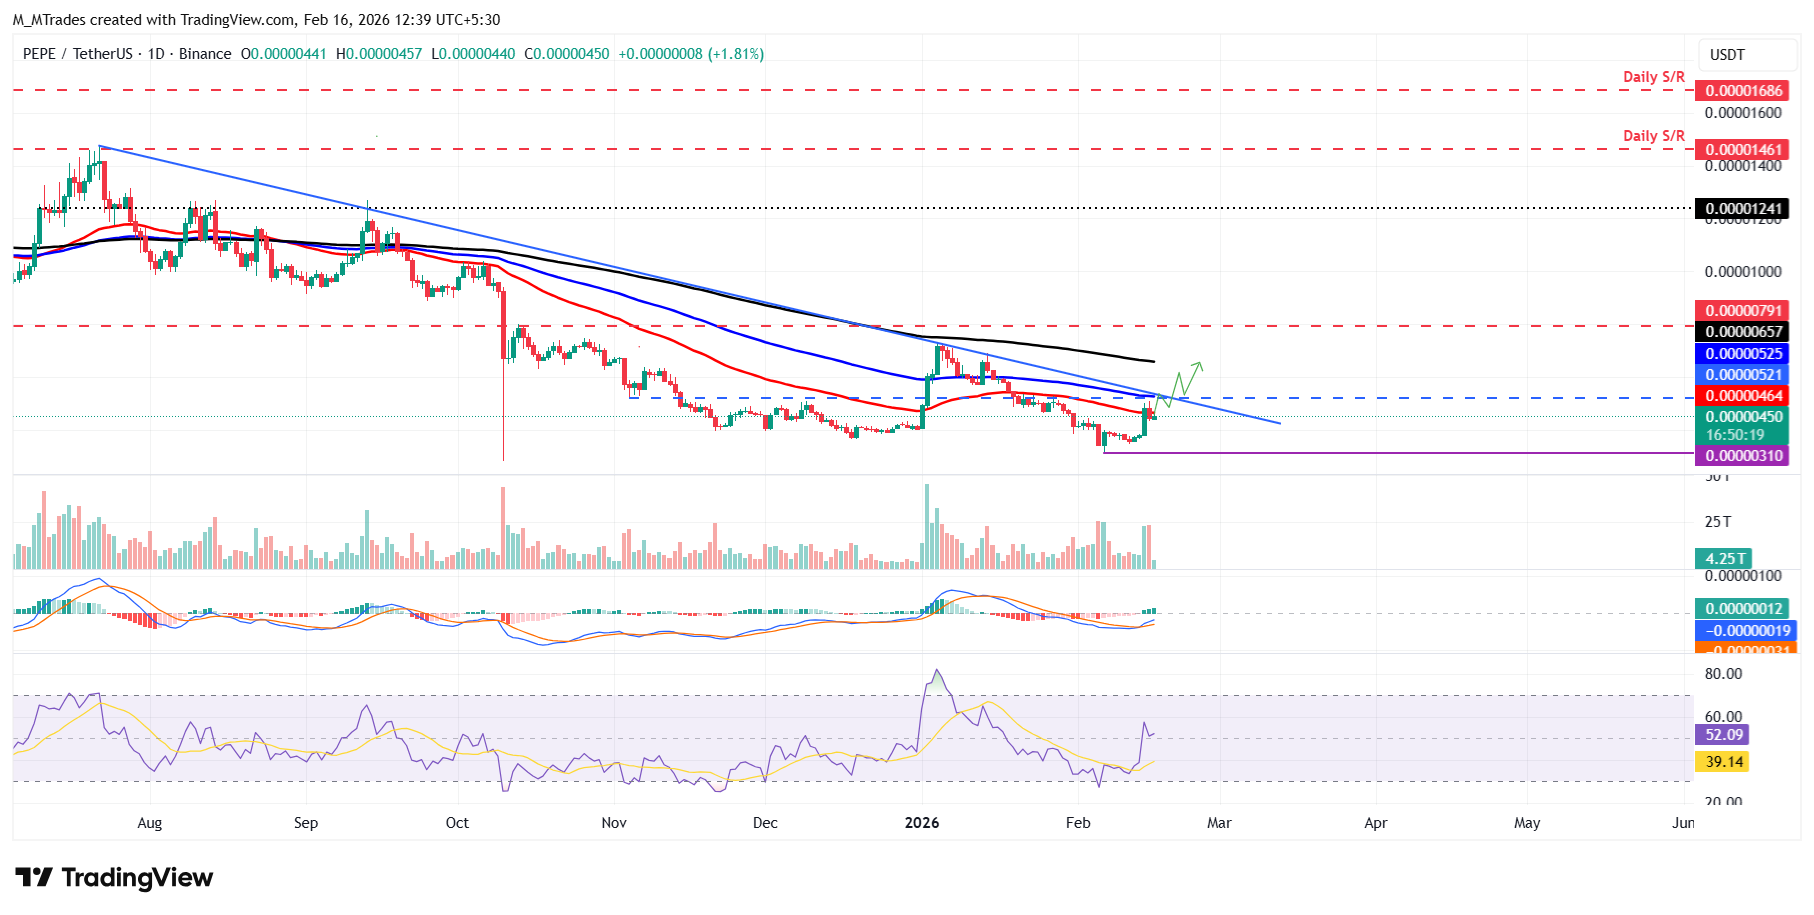
However, if PEPE faces a correction, it could extend the decline toward the February 6 low at $0.0000031.

超过一百万用户依赖 FXStreet 获取实时市场数据、图表工具、专家洞见和外汇新闻。其全面的经济日历和教育网络研讨会帮助交易者保持信息领先、做出审慎决策。FXStreet 拥有约 60 人的团队,分布在巴塞罗那总部及全球各地区。
阅读更多


