
Pi Network Price Forecast: PI extends decline after failed recovery attempt
作者 Vishal Dixit
更新: 2 Jun 2026


热门文章

Pi Network (PI) price is trading in the red on Tuesday, extending the 2% decline from Monday. The monthly unlock of roughly 170 million PI tokens in May raises concerns about additional supply, as mounting bearish momentum after a failed recovery on Sunday risks a lower leg.
- Pi Network extends losses on Tuesday after a bearish start to the week, failing to sustain Sunday’s rebound.
- PiScan data shows roughly 170 million PI tokens scheduled for unlock in June, raising concerns about additional supply.
- The technical outlook for PI is bearish, with selling pressure mounting.
Pi Network (PI) price is trading in the red on Tuesday, extending the 2% decline from Monday. The monthly unlock of roughly 170 million PI tokens in May raises concerns about additional supply, as mounting bearish momentum after a failed recovery on Sunday risks a lower leg.
Monthly PI token unlock could boost bearish pressure
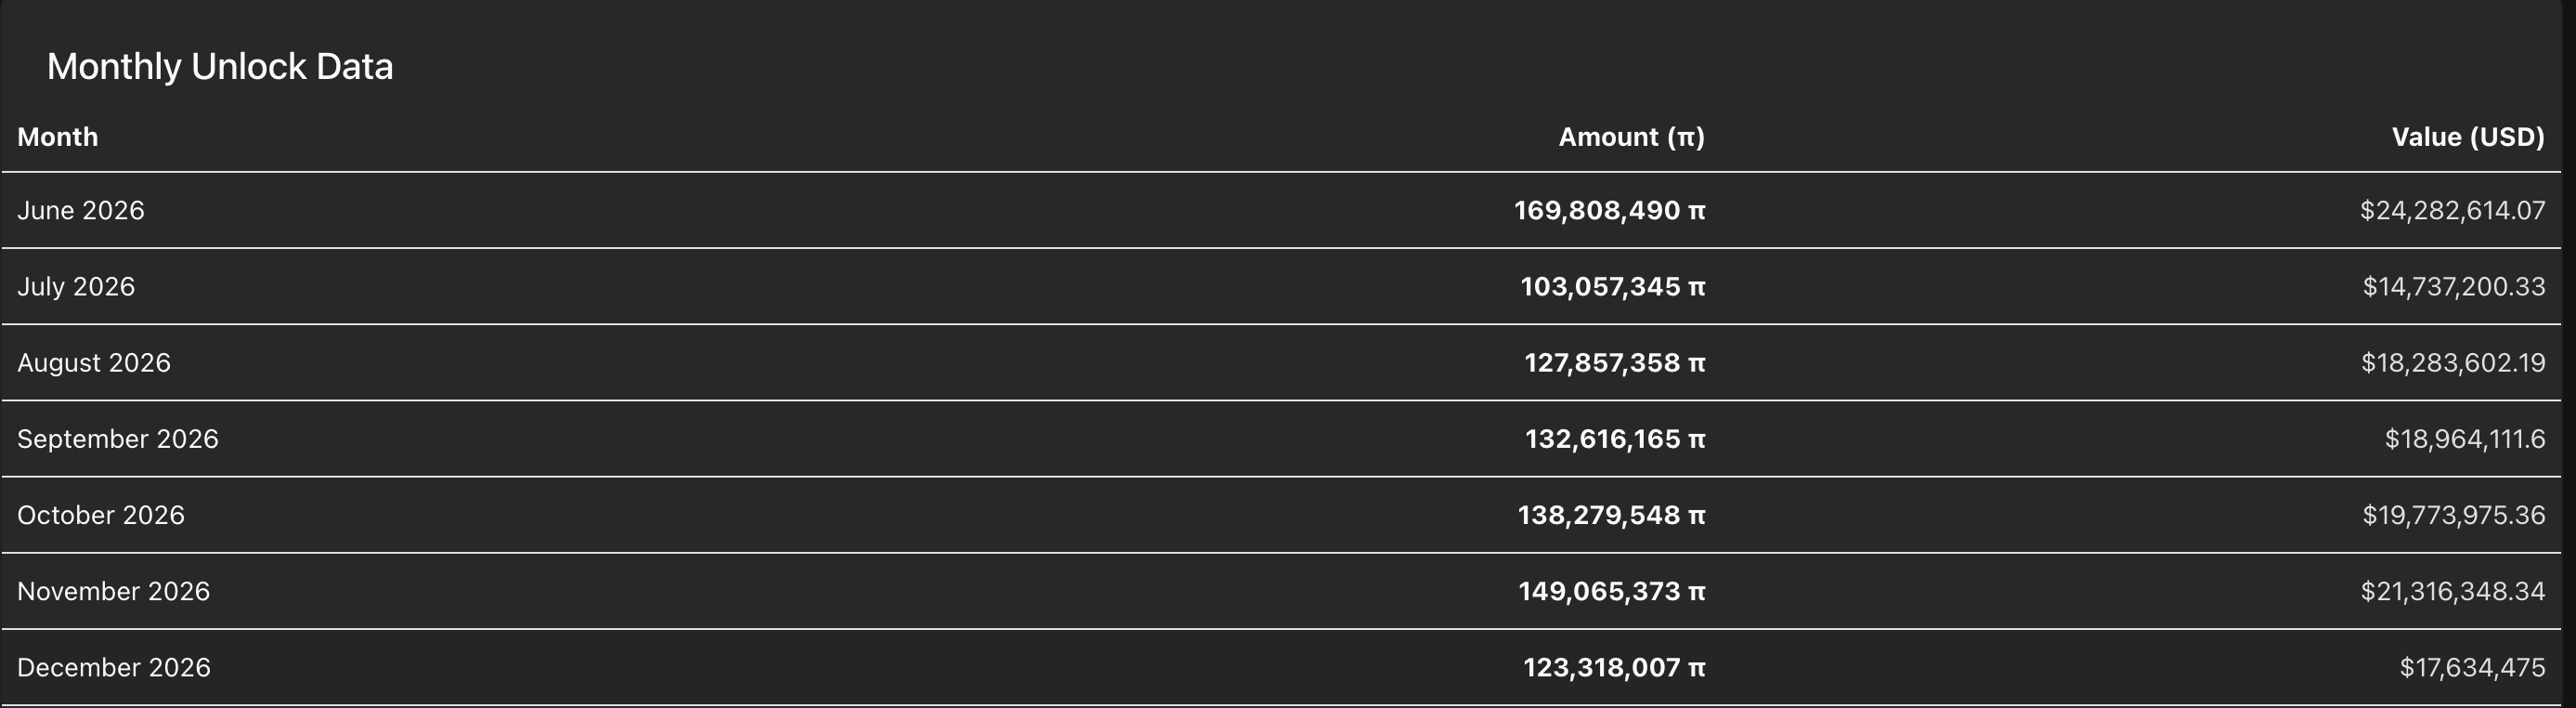
Monthly token unlocks in the Pi ecosystem raise the available Know Your Customer (KYC) verified supply in the market. PiScan data show that 169.80 million PI tokens are scheduled to be unlocked in June, which could add to selling pressure on Centralized Exchanges (CEXs) as investor demand appears low amid the ongoing decline.
Technical outlook: Will the PI token price hit a new lower leg?
Pi Network trades below $0.1450 at press time on Tuesday, maintaining a bearish near-term bias. The PI token extends a bearish reversal after a mild 3% recovery on Sunday, which now threatens Thursday's low at $0.1412.
PI also holds below the 50-period Exponential Moving Average (EMA) on the 4-hour chart at $0.1467, the 100-period EMA at $0.1507, and the 200-period EMA at $0.1578, suggesting that rallies are likely to be capped. Meanwhile, momentum indicators echo the bearish tone as the Relative Strength Index (RSI) is at 39 on the same chart, indicating subdued demand, and the Moving Average Convergence Divergence (MACD) is drifting slightly into negative territory below its signal line.
Looking down, a slip below $0.1412 could test the S2 Pivot Point at $0.1357, followed by its all-time low of $0.1310.
On the topside, initial resistance is seen at the May 18 low of $0.1463, near the 50-period EMA at $0.1467, with further hurdles at the 100-period EMA at $0.1507, where a break would be needed to ease broader downside pressure.
(The technical analysis of this story was written with the help of an AI tool.)
Cryptocurrency prices FAQs
Token launches influence demand and adoption among market participants. Listings on crypto exchanges deepen the liquidity for an asset and add new participants to an asset’s network. This is typically bullish for a digital asset.
A hack is an event in which an attacker captures a large volume of the asset from a DeFi bridge or hot wallet of an exchange or any other crypto platform via exploits, bugs or other methods. The exploiter then transfers these tokens out of the exchange platforms to ultimately sell or swap the assets for other cryptocurrencies or stablecoins. Such events often involve an en masse panic triggering a sell-off in the affected assets.
Macroeconomic events like the US Federal Reserve’s decision on interest rates influence crypto assets mainly through the direct impact they have on the US Dollar. An increase in interest rate typically negatively influences Bitcoin and altcoin prices, and vice versa. If the US Dollar index declines, risk assets and associated leverage for trading gets cheaper, in turn driving crypto prices higher.
Halvings are typically considered bullish events as they slash the block reward in half for miners, constricting the supply of the asset. At consistent demand if the supply reduces, the asset’s price climbs.

超过一百万用户依赖 FXStreet 获取实时市场数据、图表工具、专家洞见和外汇新闻。其全面的经济日历和教育网络研讨会帮助交易者保持信息领先、做出审慎决策。FXStreet 拥有约 60 人的团队,分布在巴塞罗那总部及全球各地区。
阅读更多


