
Pi Network Price Forecast: Pi extends decline as pressure mounts amid core wallet outflows
作者 Vishal Dixit
发布日期: 2 Feb 2026 | 修改日期: 2 Feb 2026


热门文章

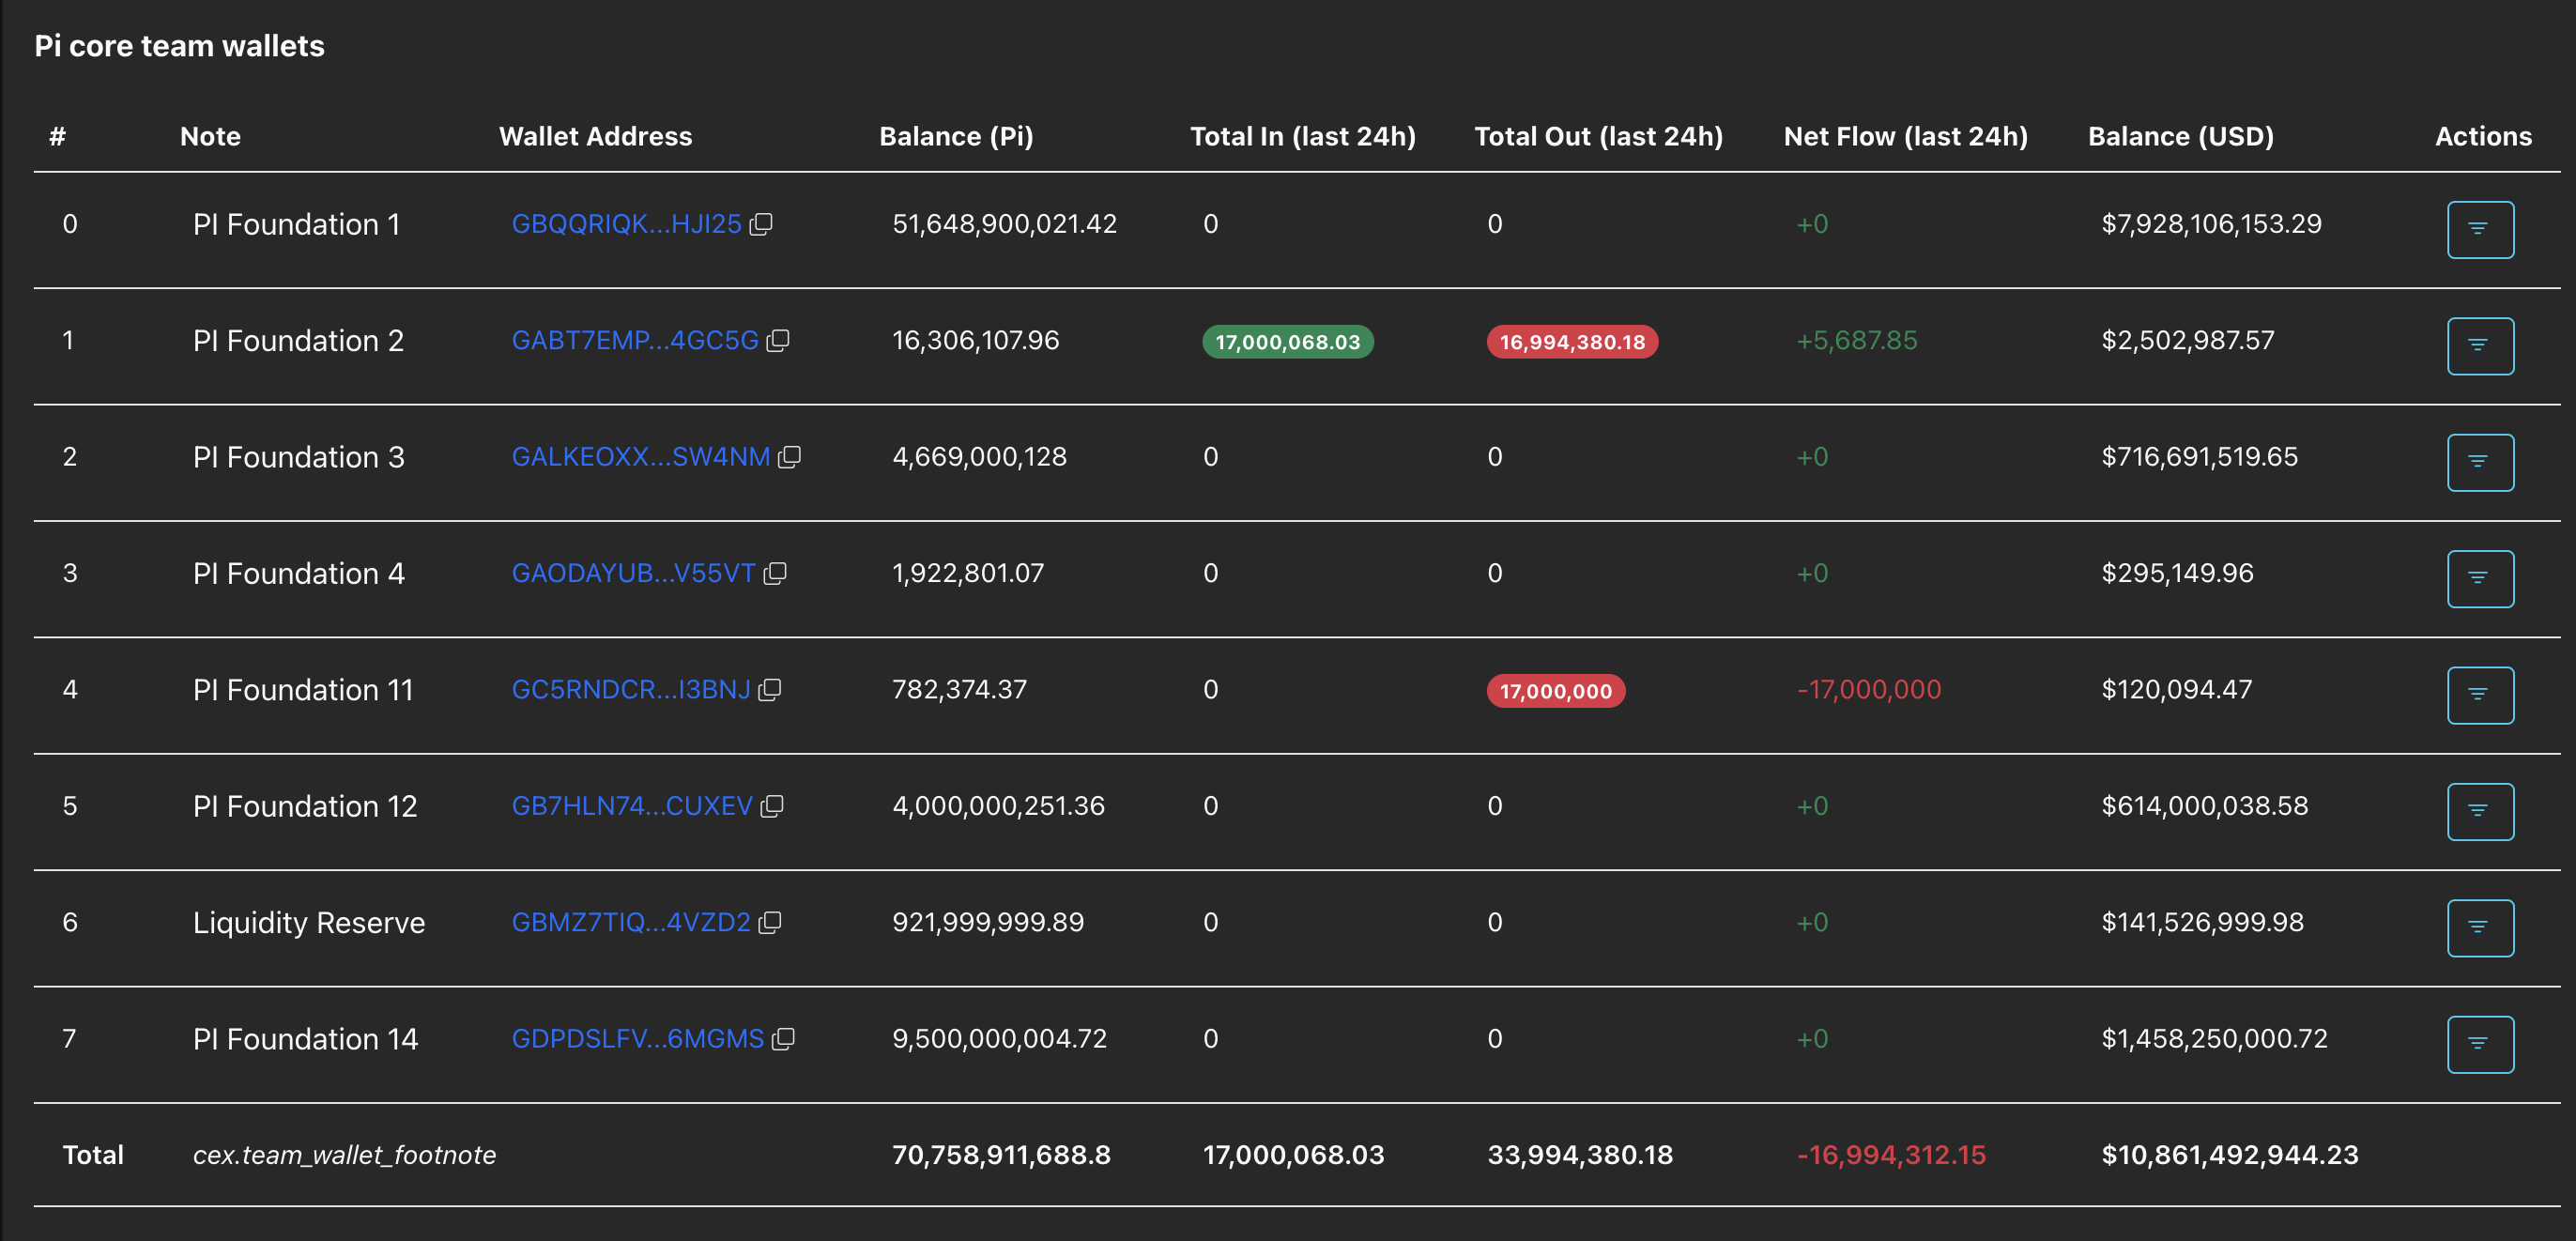
Pi Network (PI) edges lower by nearly 2% at the time of writing on Monday, extending a broader four-week downfall. Consistent outflows from the Pi Network’s core team wallets account for roughly 17 million PI, implying a sell-off under pressure.
- Pi Network extends decline, hovering above $0.1500 after recording nearly 10% loss last week.
- Outflows of nearly 17 million PI tokens from the core team's wallets over the last 24 hours indicate declining confidence.
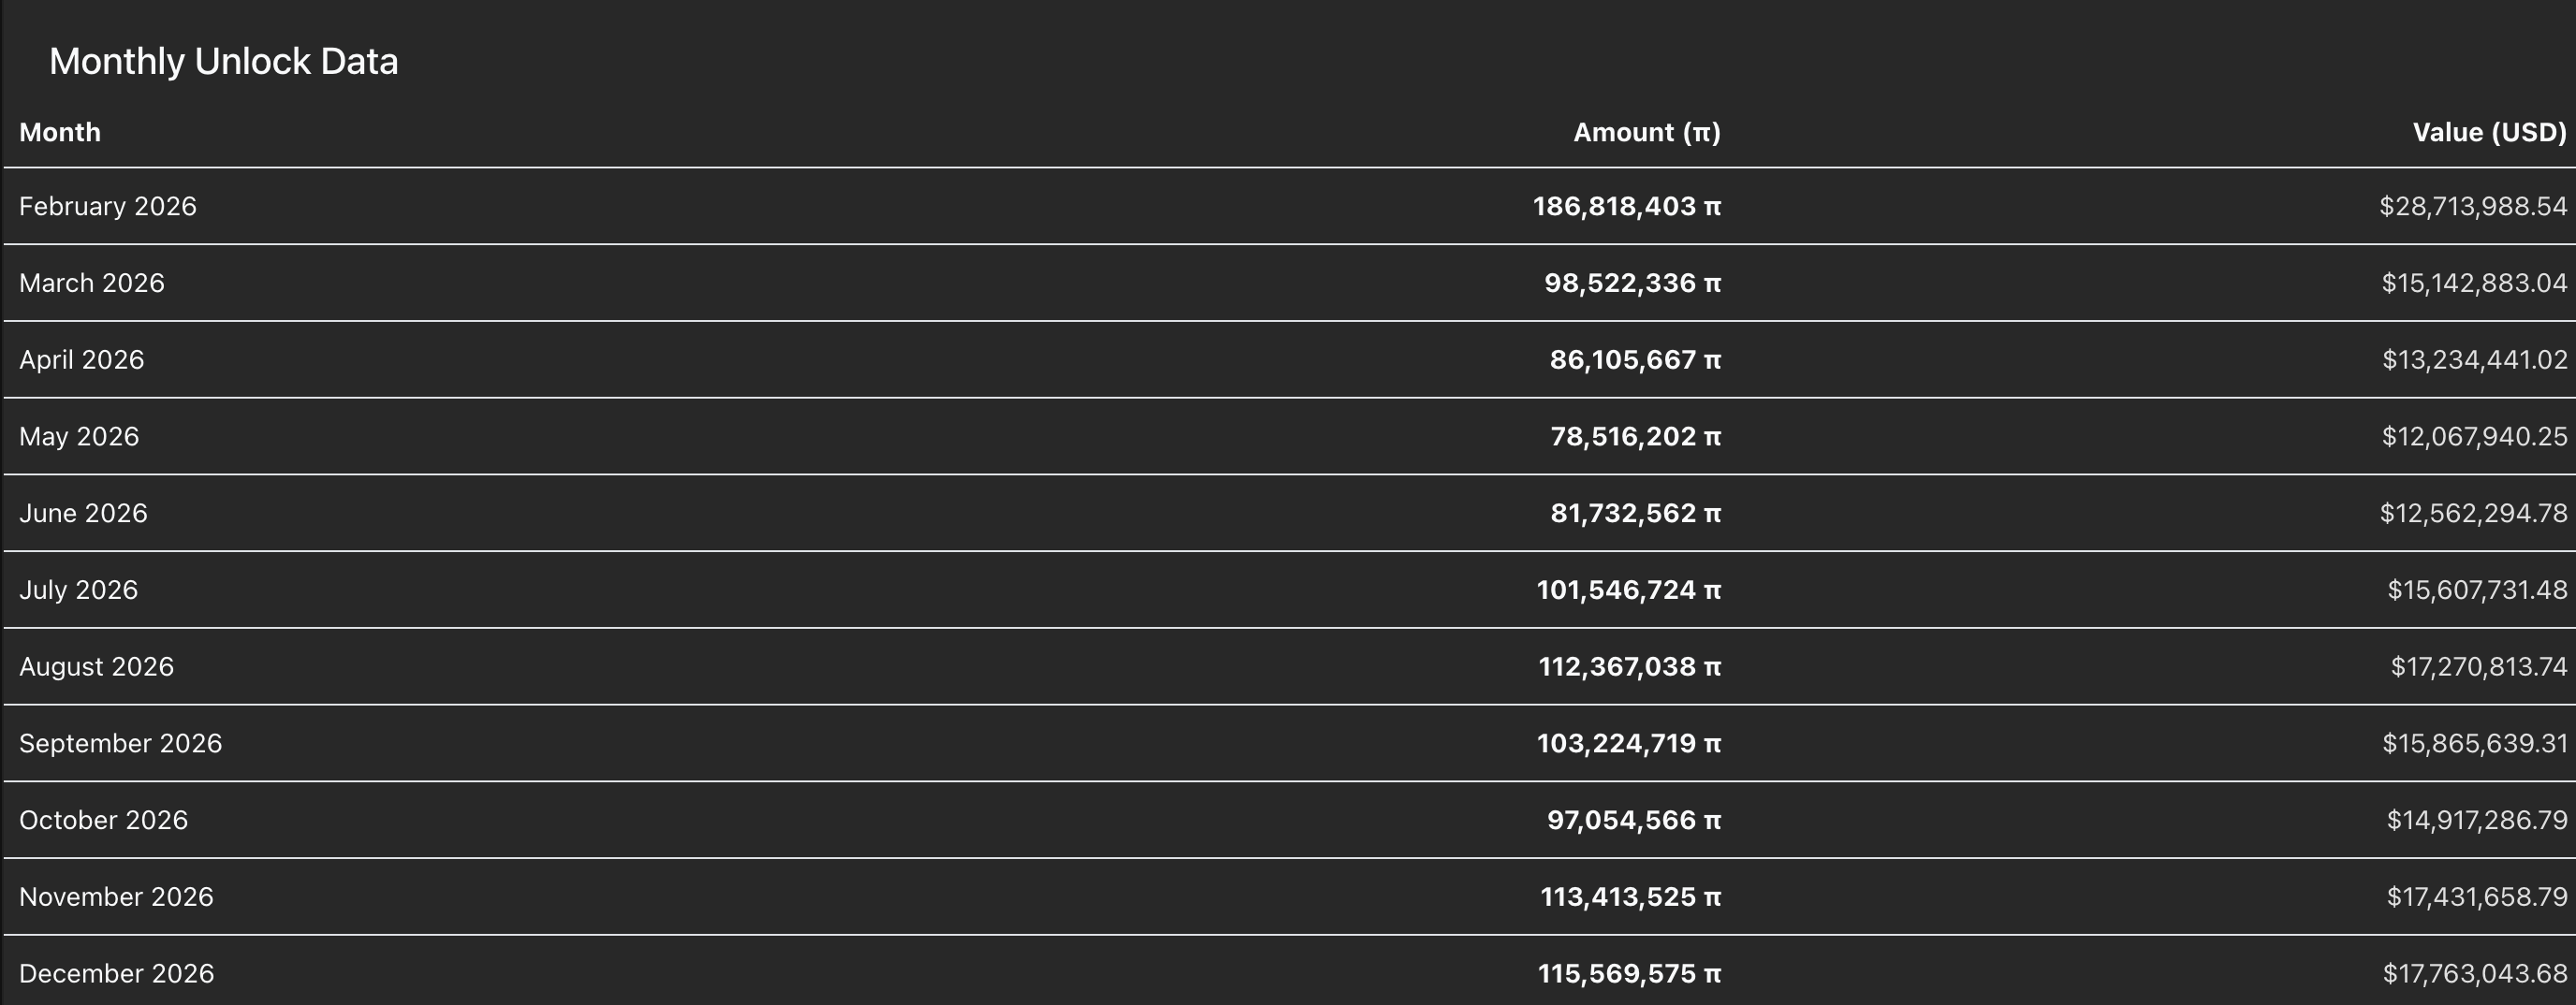
- Pi Network will unlock more than 186 million PI tokens in February for mainnet migration, which could fuel selling pressure.
Pi Network (PI) edges lower by nearly 2% at the time of writing on Monday, extending a broader four-week downfall. Consistent outflows from the Pi Network’s core team wallets account for roughly 17 million PI, implying a sell-off under pressure. Meanwhile, token unlocks of over 186 million PI in February could be dry powder for the existing downward trend.
Technically, the Pi Network signals an extremely bearish outlook, with indicators suggesting bearish momentum has crossed into oversold territory.
Pi Network faces further headwinds
PiScan data shows that the Pi Foundation wallets offloaded 16.99 million PI tokens in the market over the last 24 hours. Typically, a reduction in core team holdings has a negative impact on retail sentiment.
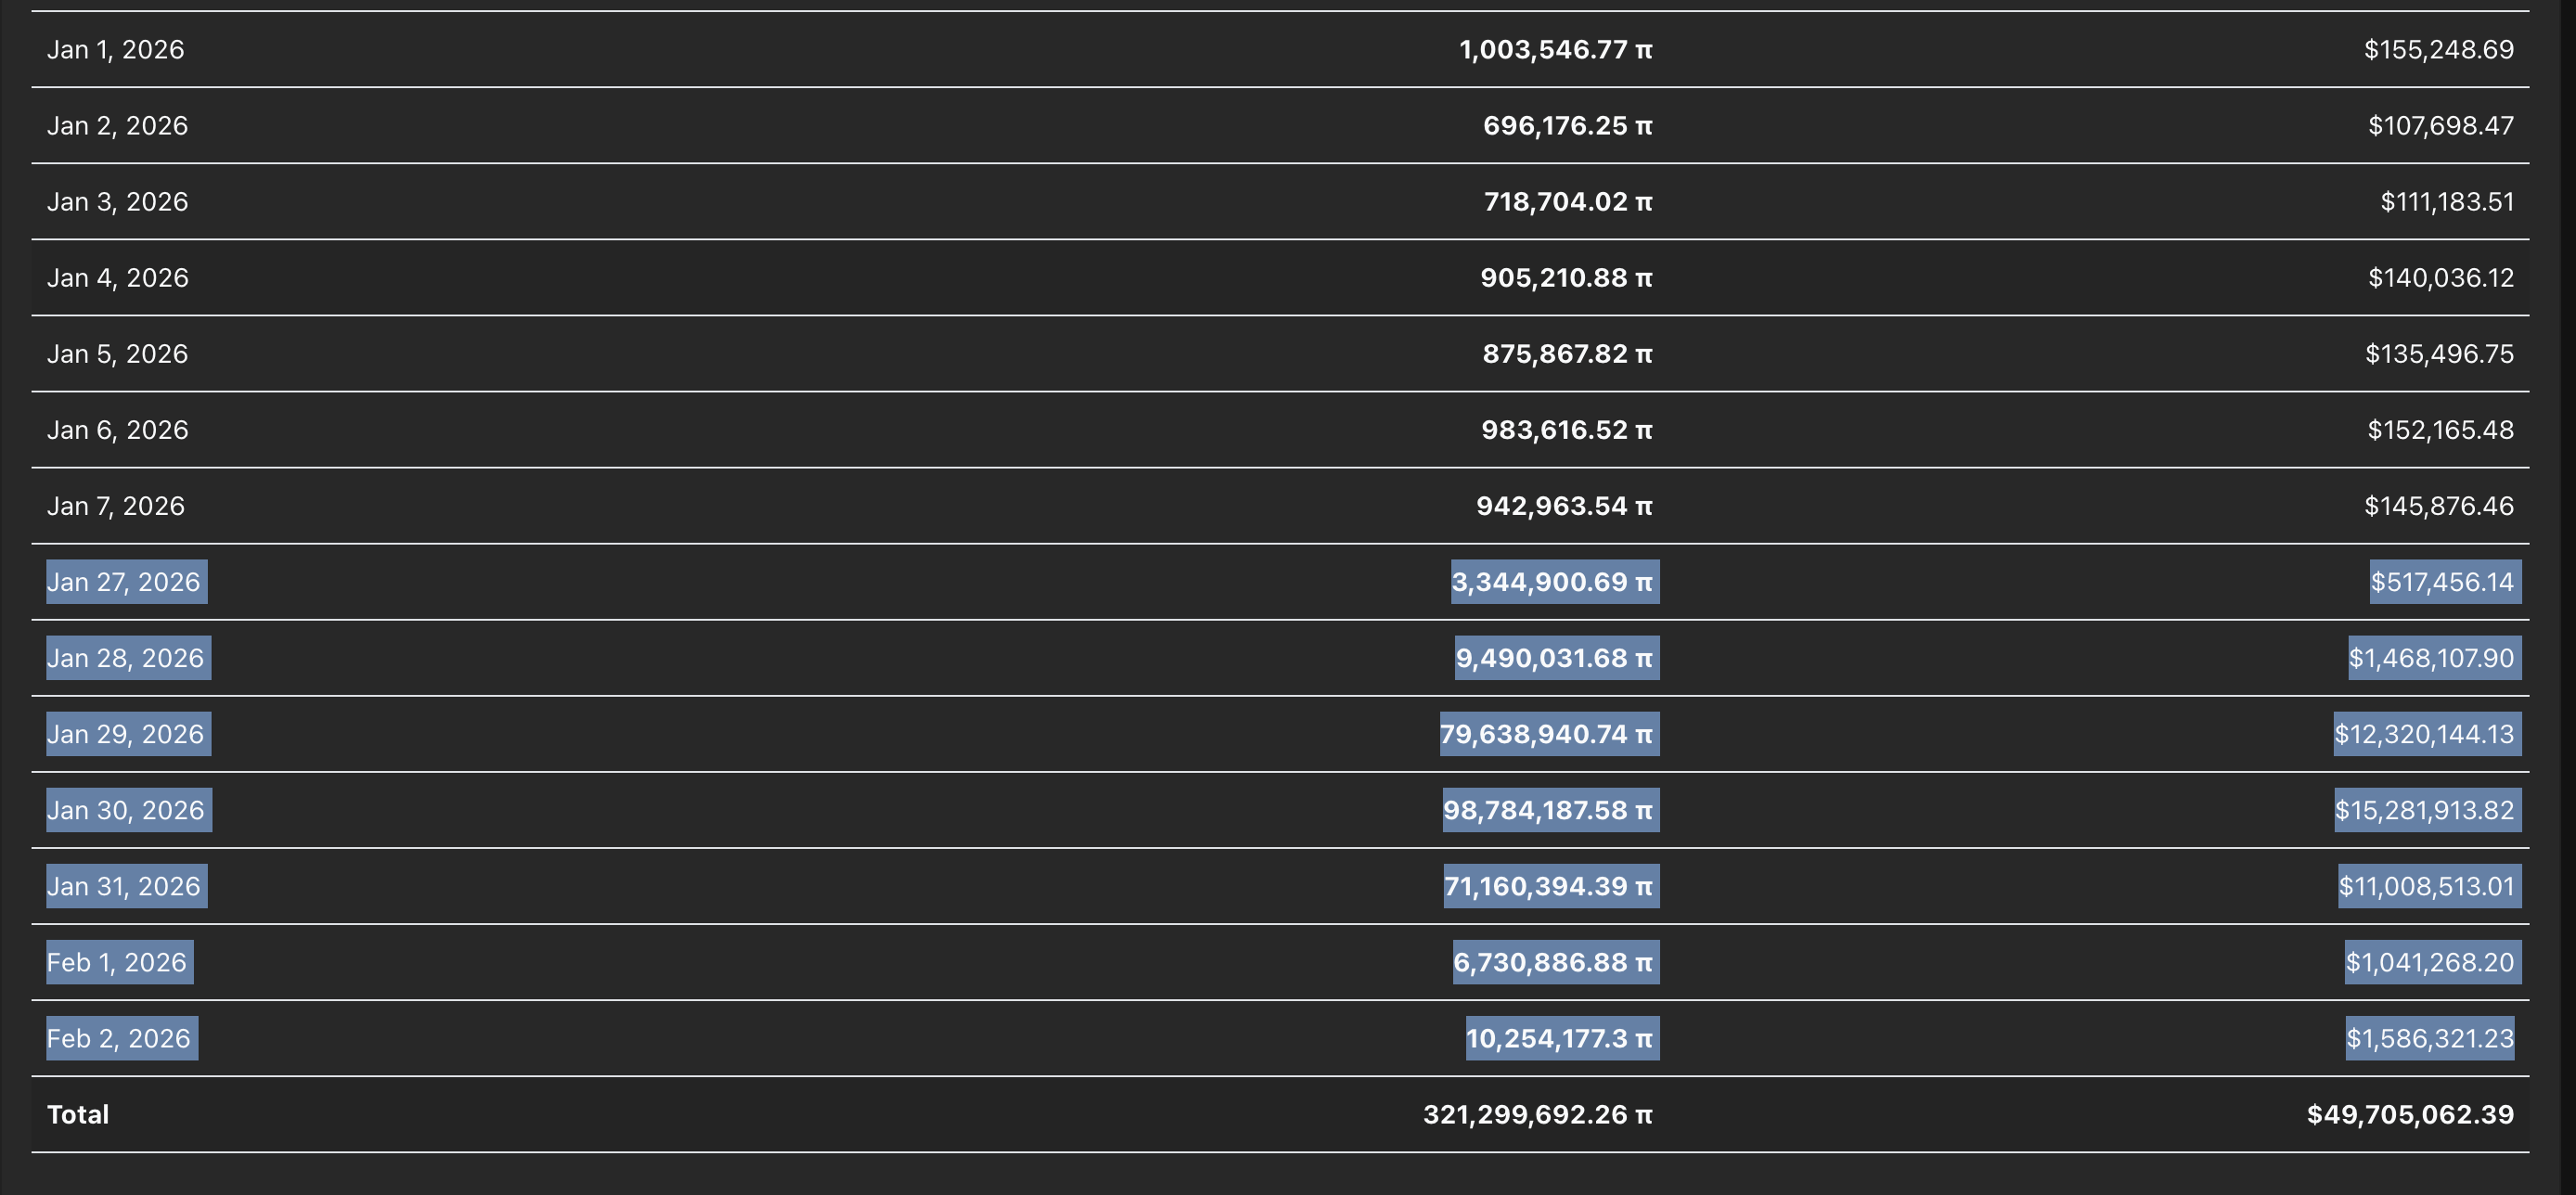
Additionally, data show that 279.40 million PI tokens have been migrated to the Pi Network mainnet from testnet, enabling users to transfer their locked holdings to selected centralized exchanges. Typically, unlocks boost selling pressure at times of reduced investor confidence.
Pi Network will unlock 186.81 million PI tokens in February, the largest monthly release for the remaining year. Consistent unlocks and the mainnet migration, amid a reduction in Pi Foundation holdings, could further increase selling pressure.
Technical outlook: Will Pi Network hold above $0.1500?
Pi Network hovers above $0.1500 at press time on Monday, trading in the red for the third straight day. PI extends the pullback from the 50-day Exponential Moving Average (EMA) at $0.1944 toward the $0.1463 record low hit on Saturday, reinforcing a bearish alignment.
Technically, the momentum indicators on the daily chart signal increased selling pressure after a broader four-week decline.
The Moving Average Convergence Divergence (MACD) and signal line decline deeper into the negative territory as the red histogram bars widen, suggesting persistent bearish pressure. At the same time, the Relative Strength Index (RSI) at 21 remains in the oversold zone, asserting that sellers are in control.
If Pi Network slips below $0.1463, it would enter a support-discovery mode, which could potentially target the $0.1000 listing price.
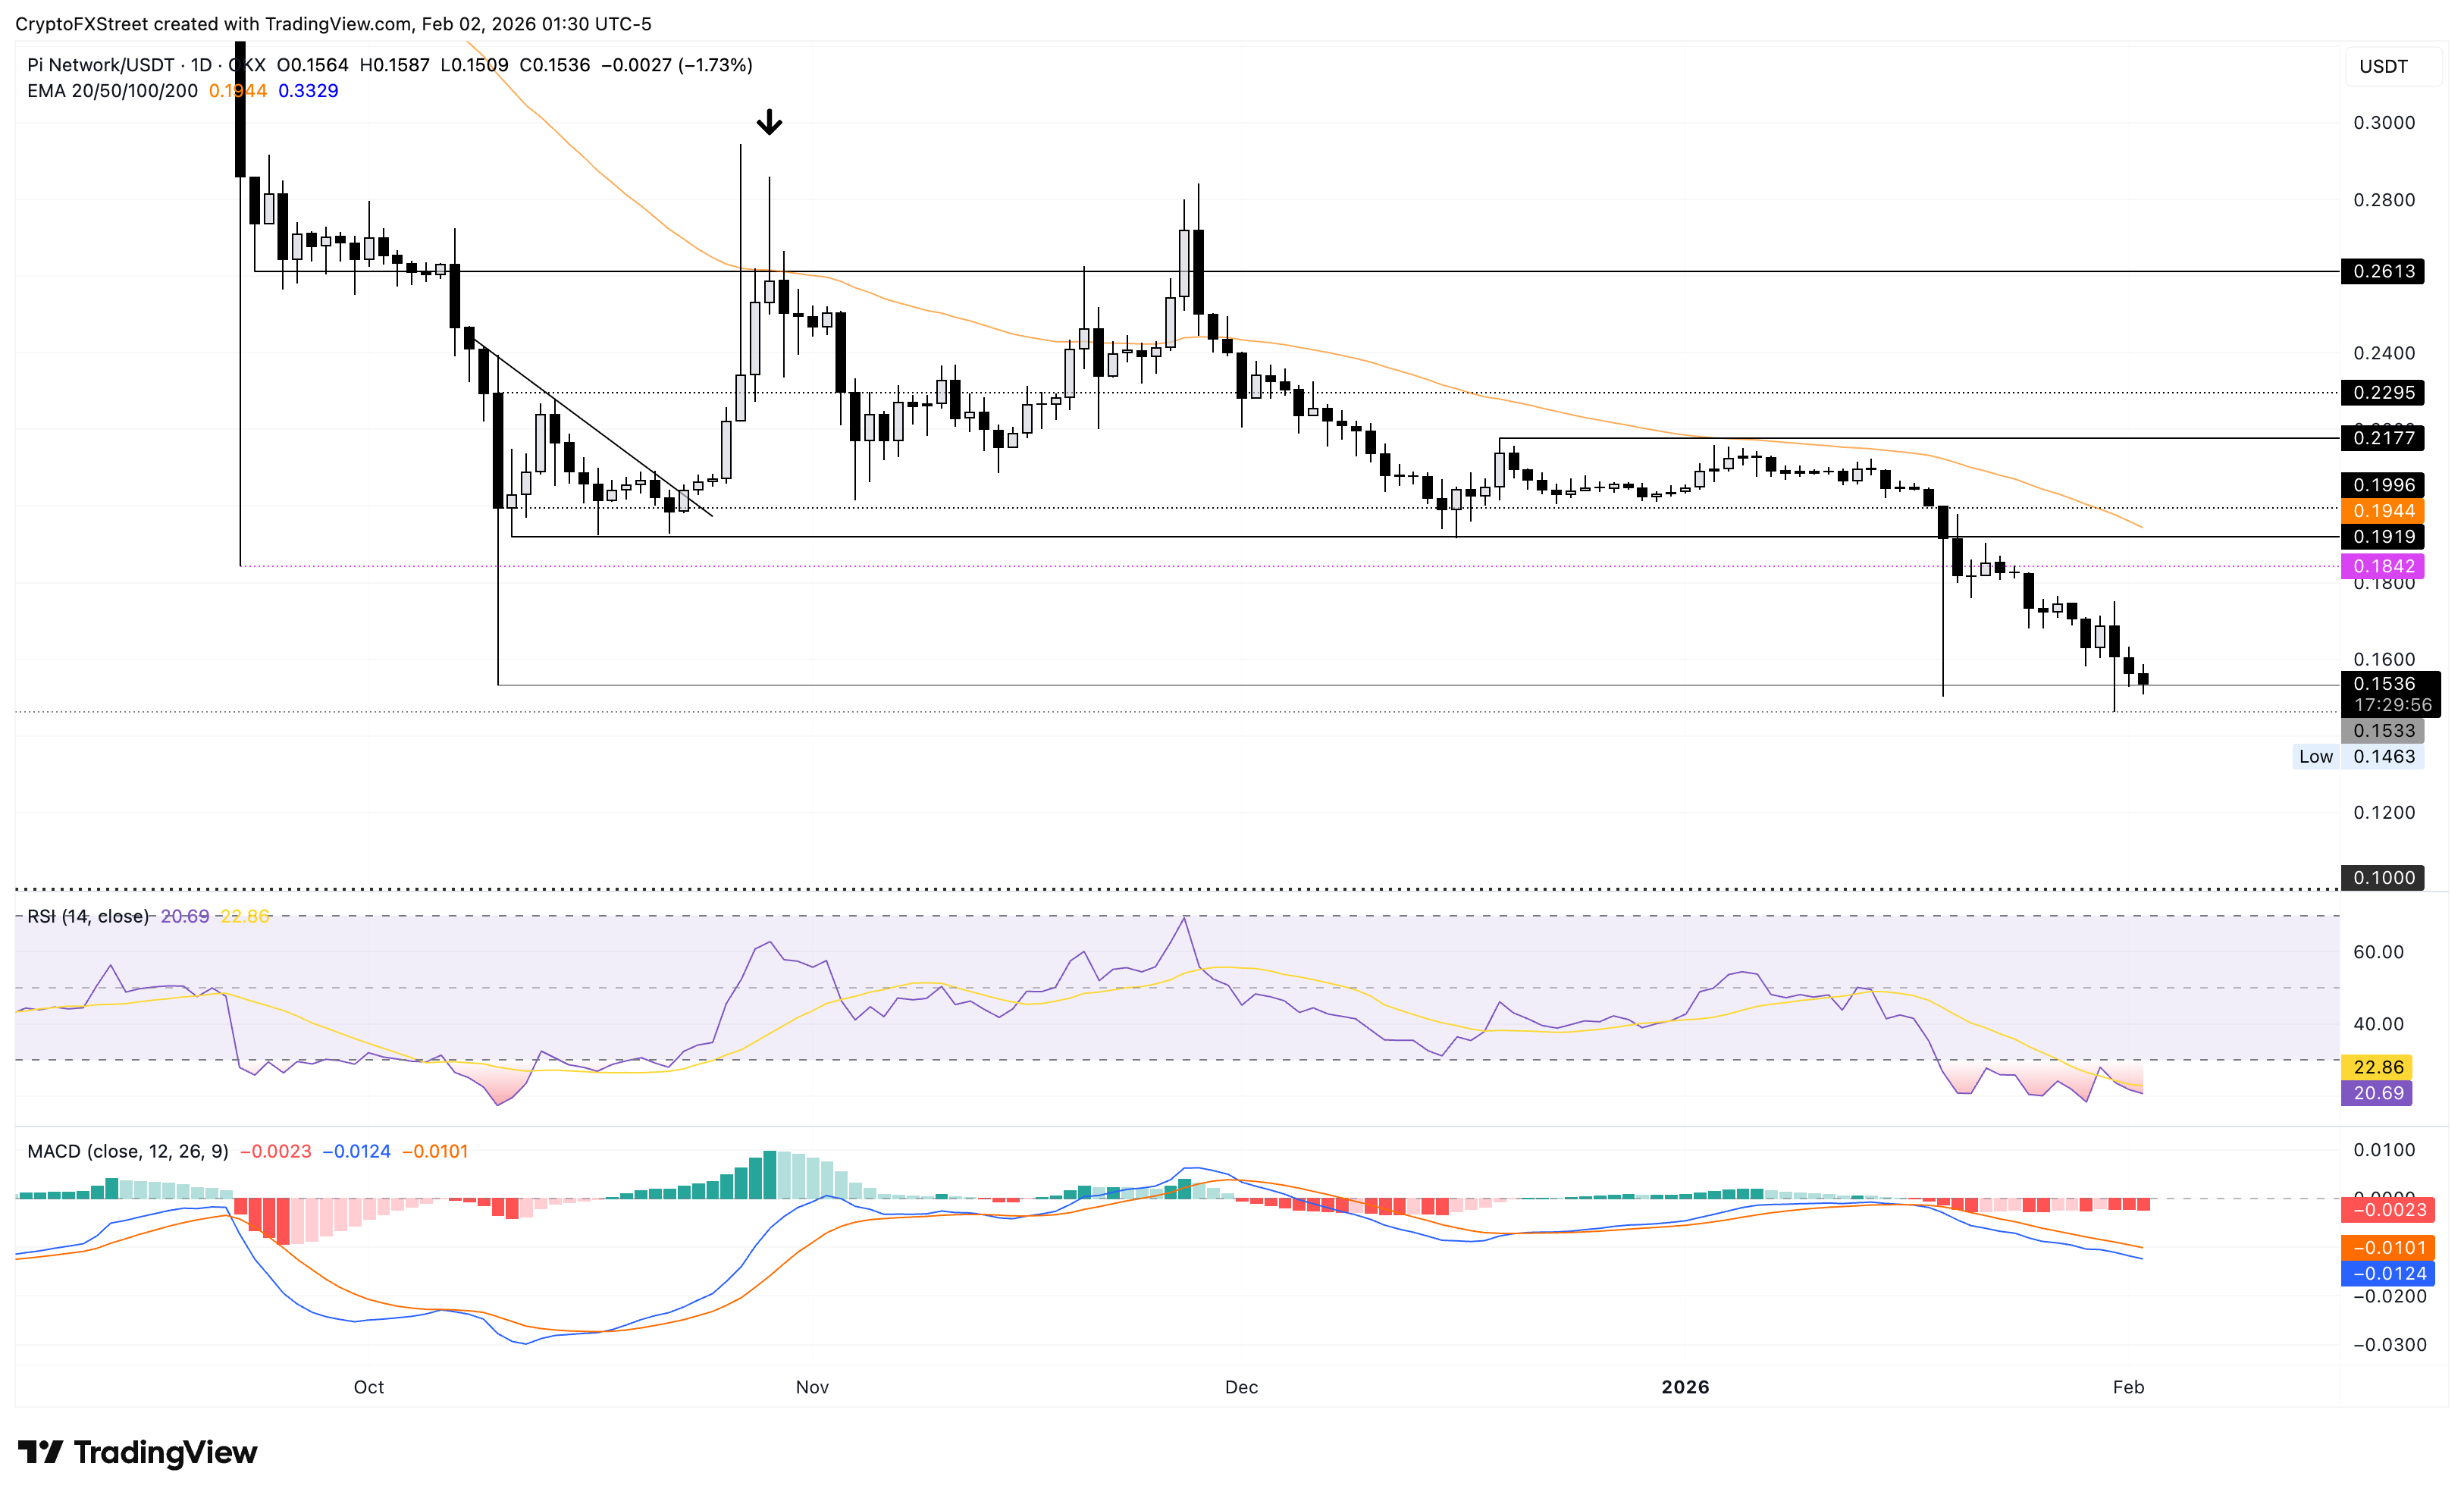
Looking up, the October 11 low at $0.1919 could serve as the immediate resistance, capping PI rebound gains.
Bitcoin, altcoins, stablecoins FAQs
Bitcoin is the largest cryptocurrency by market capitalization, a virtual currency designed to serve as money. This form of payment cannot be controlled by any one person, group, or entity, which eliminates the need for third-party participation during financial transactions.
Altcoins are any cryptocurrency apart from Bitcoin, but some also regard Ethereum as a non-altcoin because it is from these two cryptocurrencies that forking happens. If this is true, then Litecoin is the first altcoin, forked from the Bitcoin protocol and, therefore, an “improved” version of it.
Stablecoins are cryptocurrencies designed to have a stable price, with their value backed by a reserve of the asset it represents. To achieve this, the value of any one stablecoin is pegged to a commodity or financial instrument, such as the US Dollar (USD), with its supply regulated by an algorithm or demand. The main goal of stablecoins is to provide an on/off-ramp for investors willing to trade and invest in cryptocurrencies. Stablecoins also allow investors to store value since cryptocurrencies, in general, are subject to volatility.
Bitcoin dominance is the ratio of Bitcoin's market capitalization to the total market capitalization of all cryptocurrencies combined. It provides a clear picture of Bitcoin’s interest among investors. A high BTC dominance typically happens before and during a bull run, in which investors resort to investing in relatively stable and high market capitalization cryptocurrency like Bitcoin. A drop in BTC dominance usually means that investors are moving their capital and/or profits to altcoins in a quest for higher returns, which usually triggers an explosion of altcoin rallies.

超过一百万用户依赖 FXStreet 获取实时市场数据、图表工具、专家洞见和外汇新闻。其全面的经济日历和教育网络研讨会帮助交易者保持信息领先、做出审慎决策。FXStreet 拥有约 60 人的团队,分布在巴塞罗那总部及全球各地区。
阅读更多


