
Pi Network Price Forecast: PI flashes recovery signs amid improving market mood
作者 Vishal Dixit
更新: 6 May 2026


热门文章

Pi Network (PI) is trading in the green on Wednesday, as the broader cryptocurrency market mood improves. The three-day recovery in PI should firmly clear above the 100-day Exponential Moving Average (EMA) at $0.1844 to target the $0.2000 round figure.
- Pi Network extends recovery for the third consecutive day, testing the 100-day EMA at $0.1844 on Wednesday.
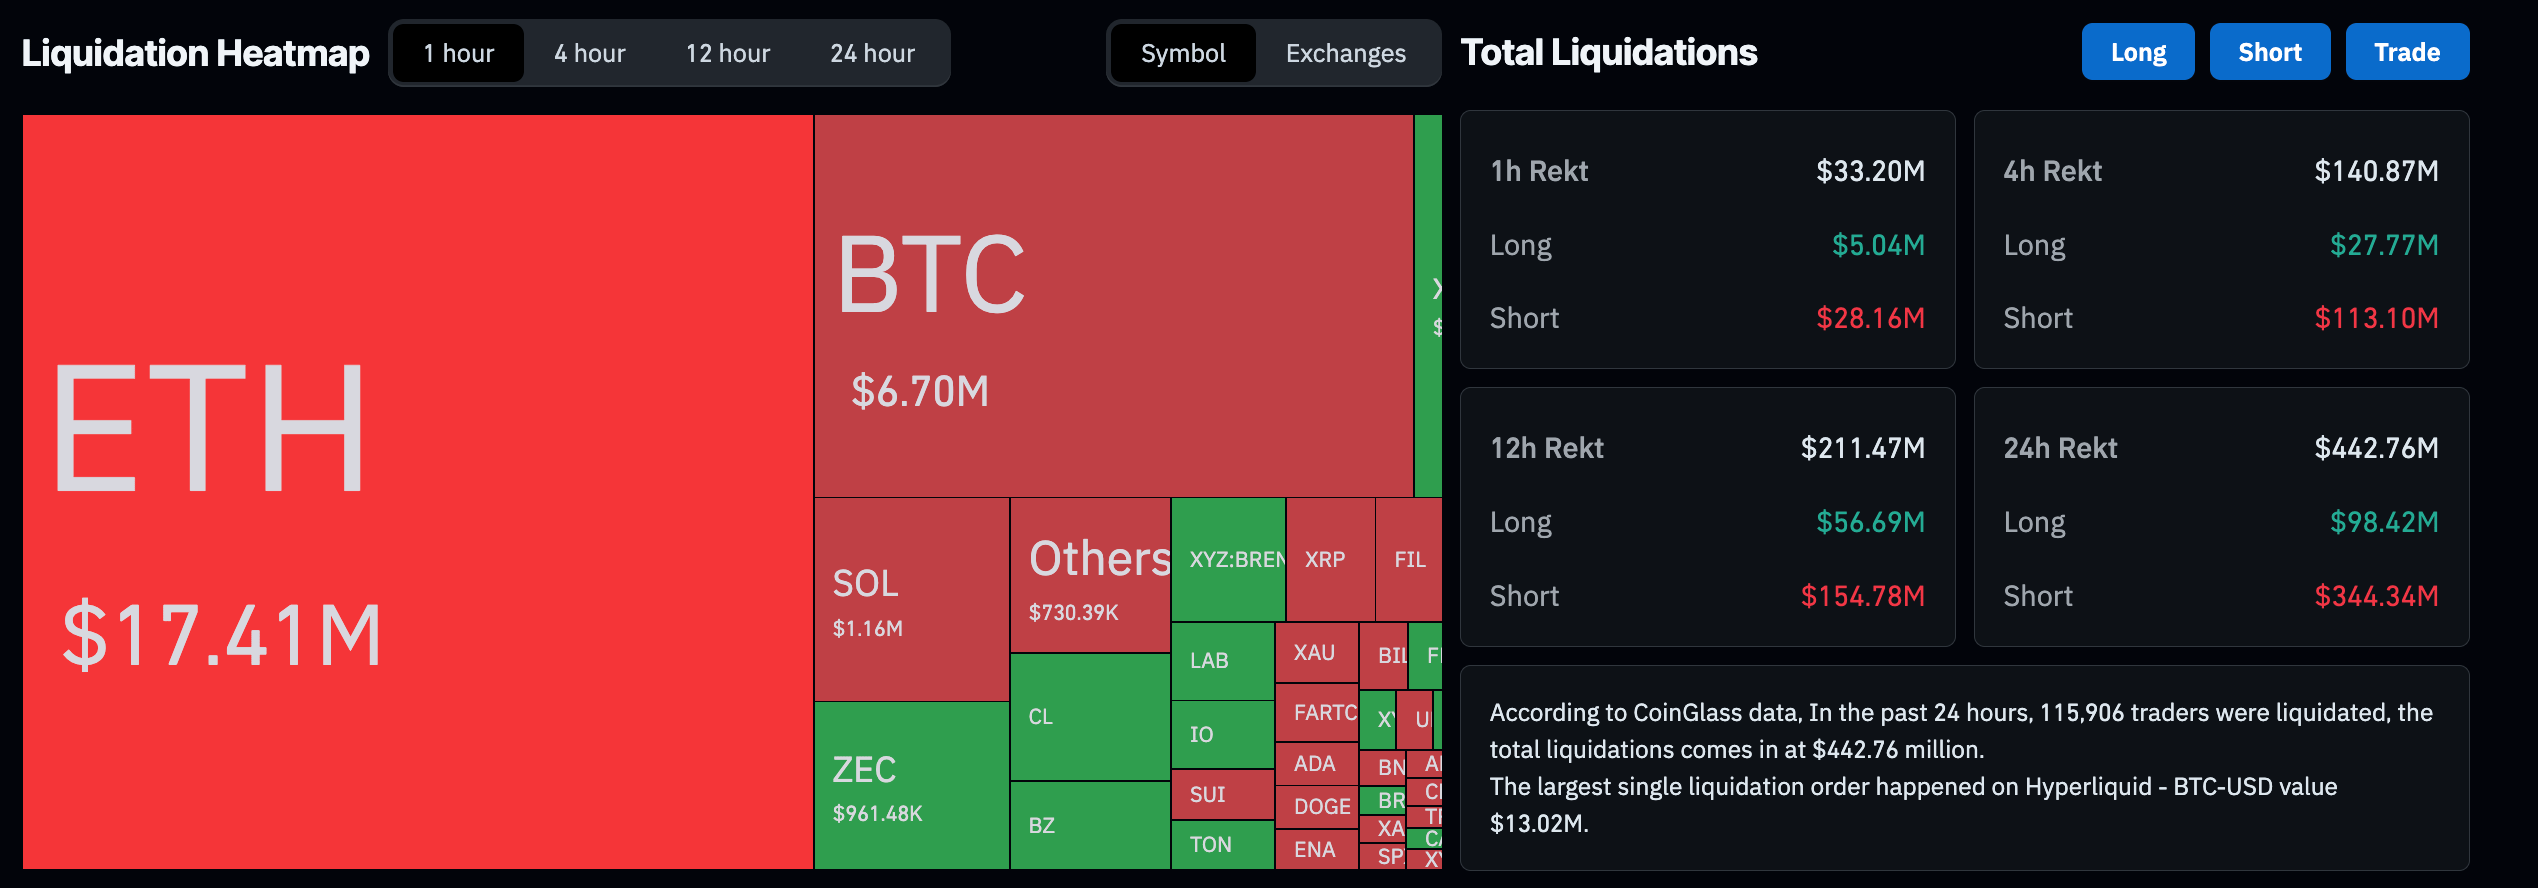
- Broad crypto market's short liquidations of over $300 million in the last 24 hours reflect a recovery in sentiment.
- Pi Network should hold a daily close above the 100-day EMA to extend its short-term recovery.
Pi Network (PI) is trading in the green on Wednesday, as the broader cryptocurrency market mood improves. The three-day recovery in PI should firmly clear above the 100-day Exponential Moving Average (EMA) at $0.1844 to target the $0.2000 round figure.
Pi Network recovers ahead of co-founders’ speech at Consensus 2026
Pi Network has maintained a steady upward trend so far this week as broader market sentiment recovers. CoinGlass data shows the $442.76 million in total liquidations over the last 24 hours, led by $344.34 million in short liquidations, implying a broader bullish bias in the market.
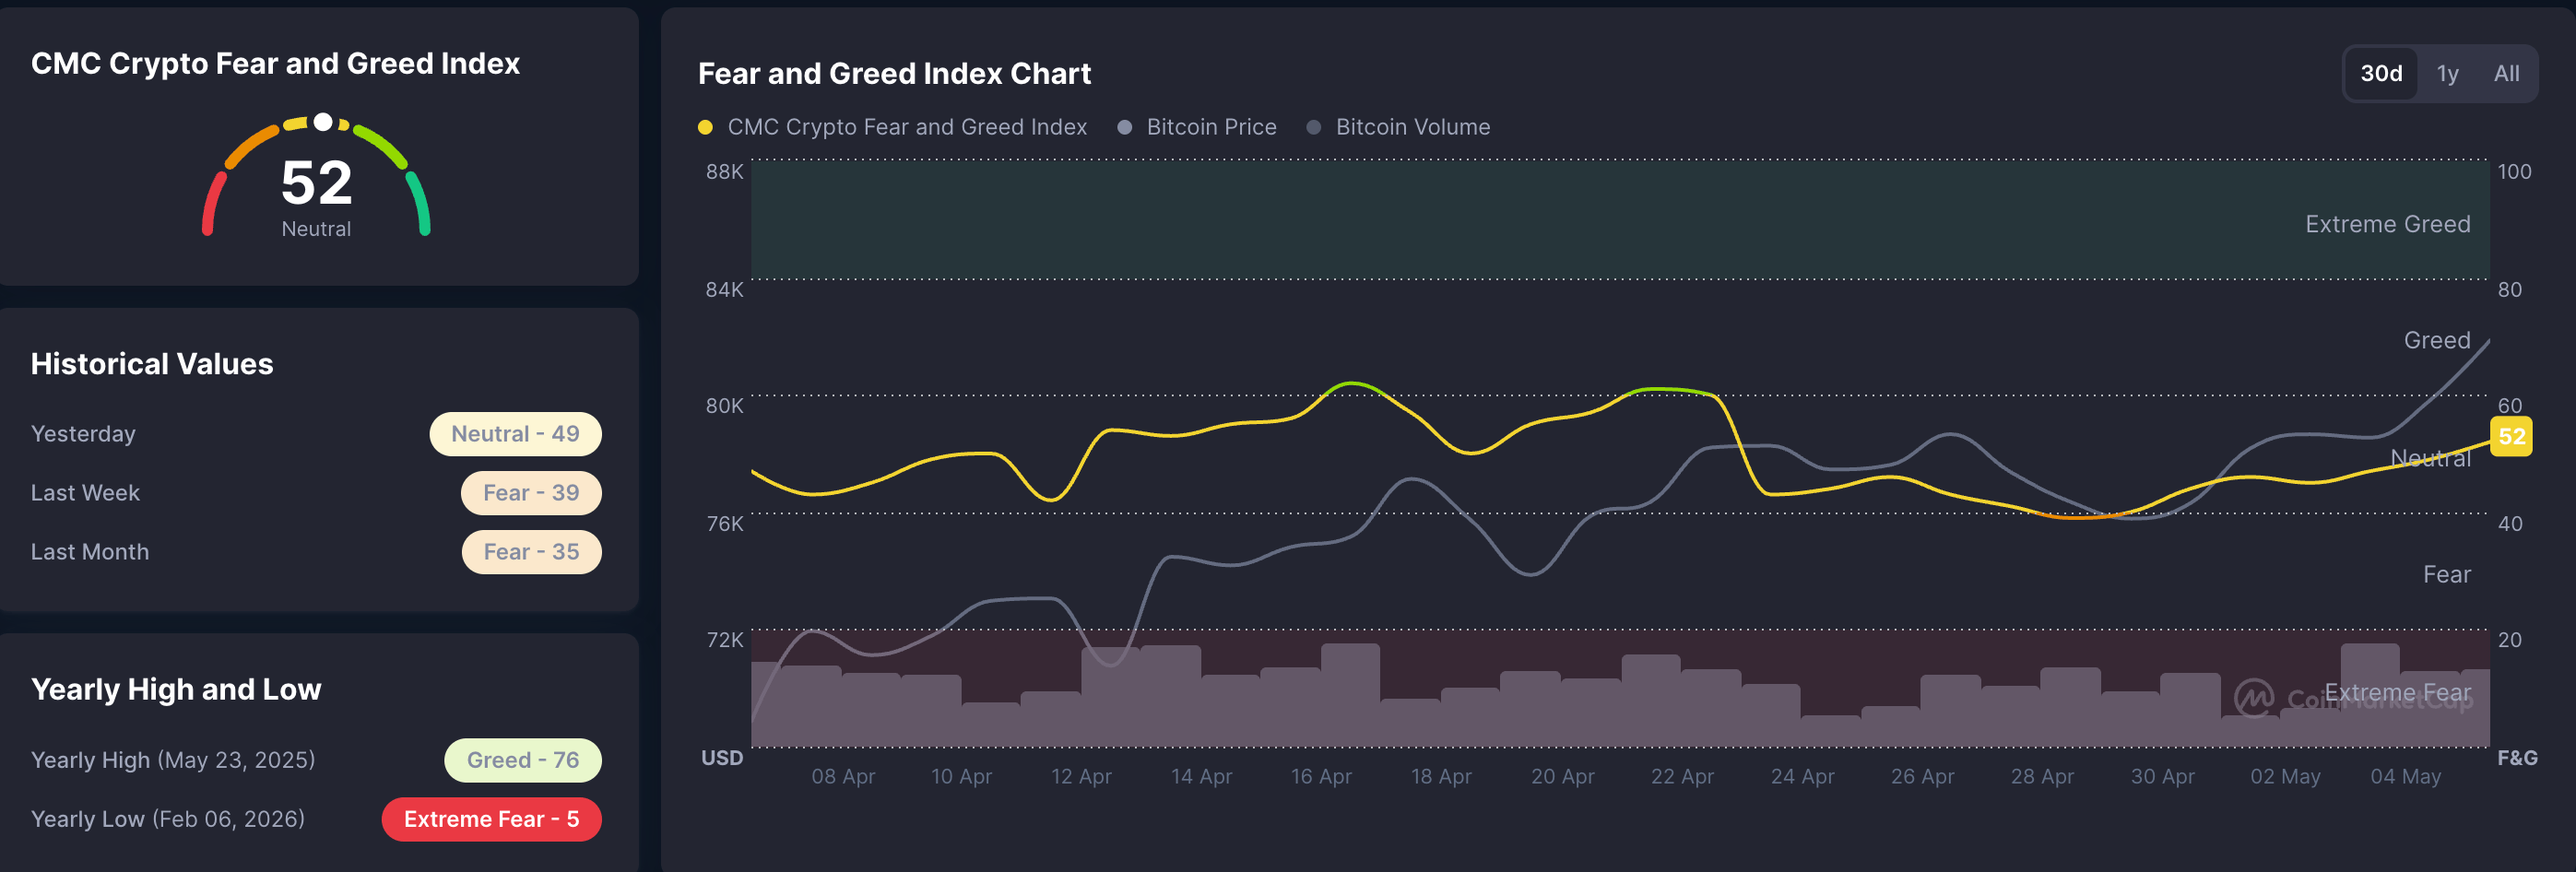
CoinMarketCap’s Crypto Fear and Greed Index rises higher in the neutral territory to 52 on Wednesday, up from 39 in fear territory seen last week, as the risk-off sentiment wanes across the market. Typically, an increase in broader market risk appetite improves the upside potential for high-risk tokens such as the Pi network.
Additionally, co-founders of the Pi Network, Chengdiao Fan and Nicolas Kokkalis, will speak at Consensus 2026 on Wednesday and Thursday, which could boost retail confidence.
Will Pi Network rebound to $0.20?
Pi Network holds a modest bullish bias, with three straight days of recovery, and is testing the 100-day Exponential Moving Average (EMA) at $0.1844. The faster 50-day EMA at $0.1788 below the spot suggests an emerging demand zone underpinning the latest bounce, while the slower 200-day EMA near $0.2271 still caps the broader recovery scope.
Momentum conditions are constructive, with the Relative Strength Index (RSI) at 56 on the daily chart, which hovers slightly above the midline, while the Moving Average Convergence Divergence (MACD) line remains above its signal line, suggesting that buyers retain the near-term initiative.
On the topside, a daily close above the 100-day EMA at $0.1844 could extend the recovery toward the $0.2000 threshold. A break above this psychological barrier could target the 200-day EMA at $0.2271 stands out as the next significant resistance.
On the downside, initial support is seen around the 50-day EMA at $0.1788, followed by the April 23 low around $0.1633, offering a deeper layer of protection if sellers regain control.
(The technical analysis of this story was written with the help of an AI tool.)

超过一百万用户依赖 FXStreet 获取实时市场数据、图表工具、专家洞见和外汇新闻。其全面的经济日历和教育网络研讨会帮助交易者保持信息领先、做出审慎决策。FXStreet 拥有约 60 人的团队,分布在巴塞罗那总部及全球各地区。
阅读更多


