
Pi Network Price Forecast: PI hesitates near key resistance amid CEX outflows
作者 Vishal Dixit
更新: 22 May 2026


热门文章
Pi Network (PI) holds steady above $0.1500 at press time on Friday as Centralized Exchanges (CEXs) record minor outflows over the last 24 hours. The technical outlook for PI is mildly bullish, with waning downside pressure while price wavers below a key resistance level at $0.1550.
- Pi Network steadies above $0.1500 on Friday, as buyers hesitate to test a key resistance level breakout.
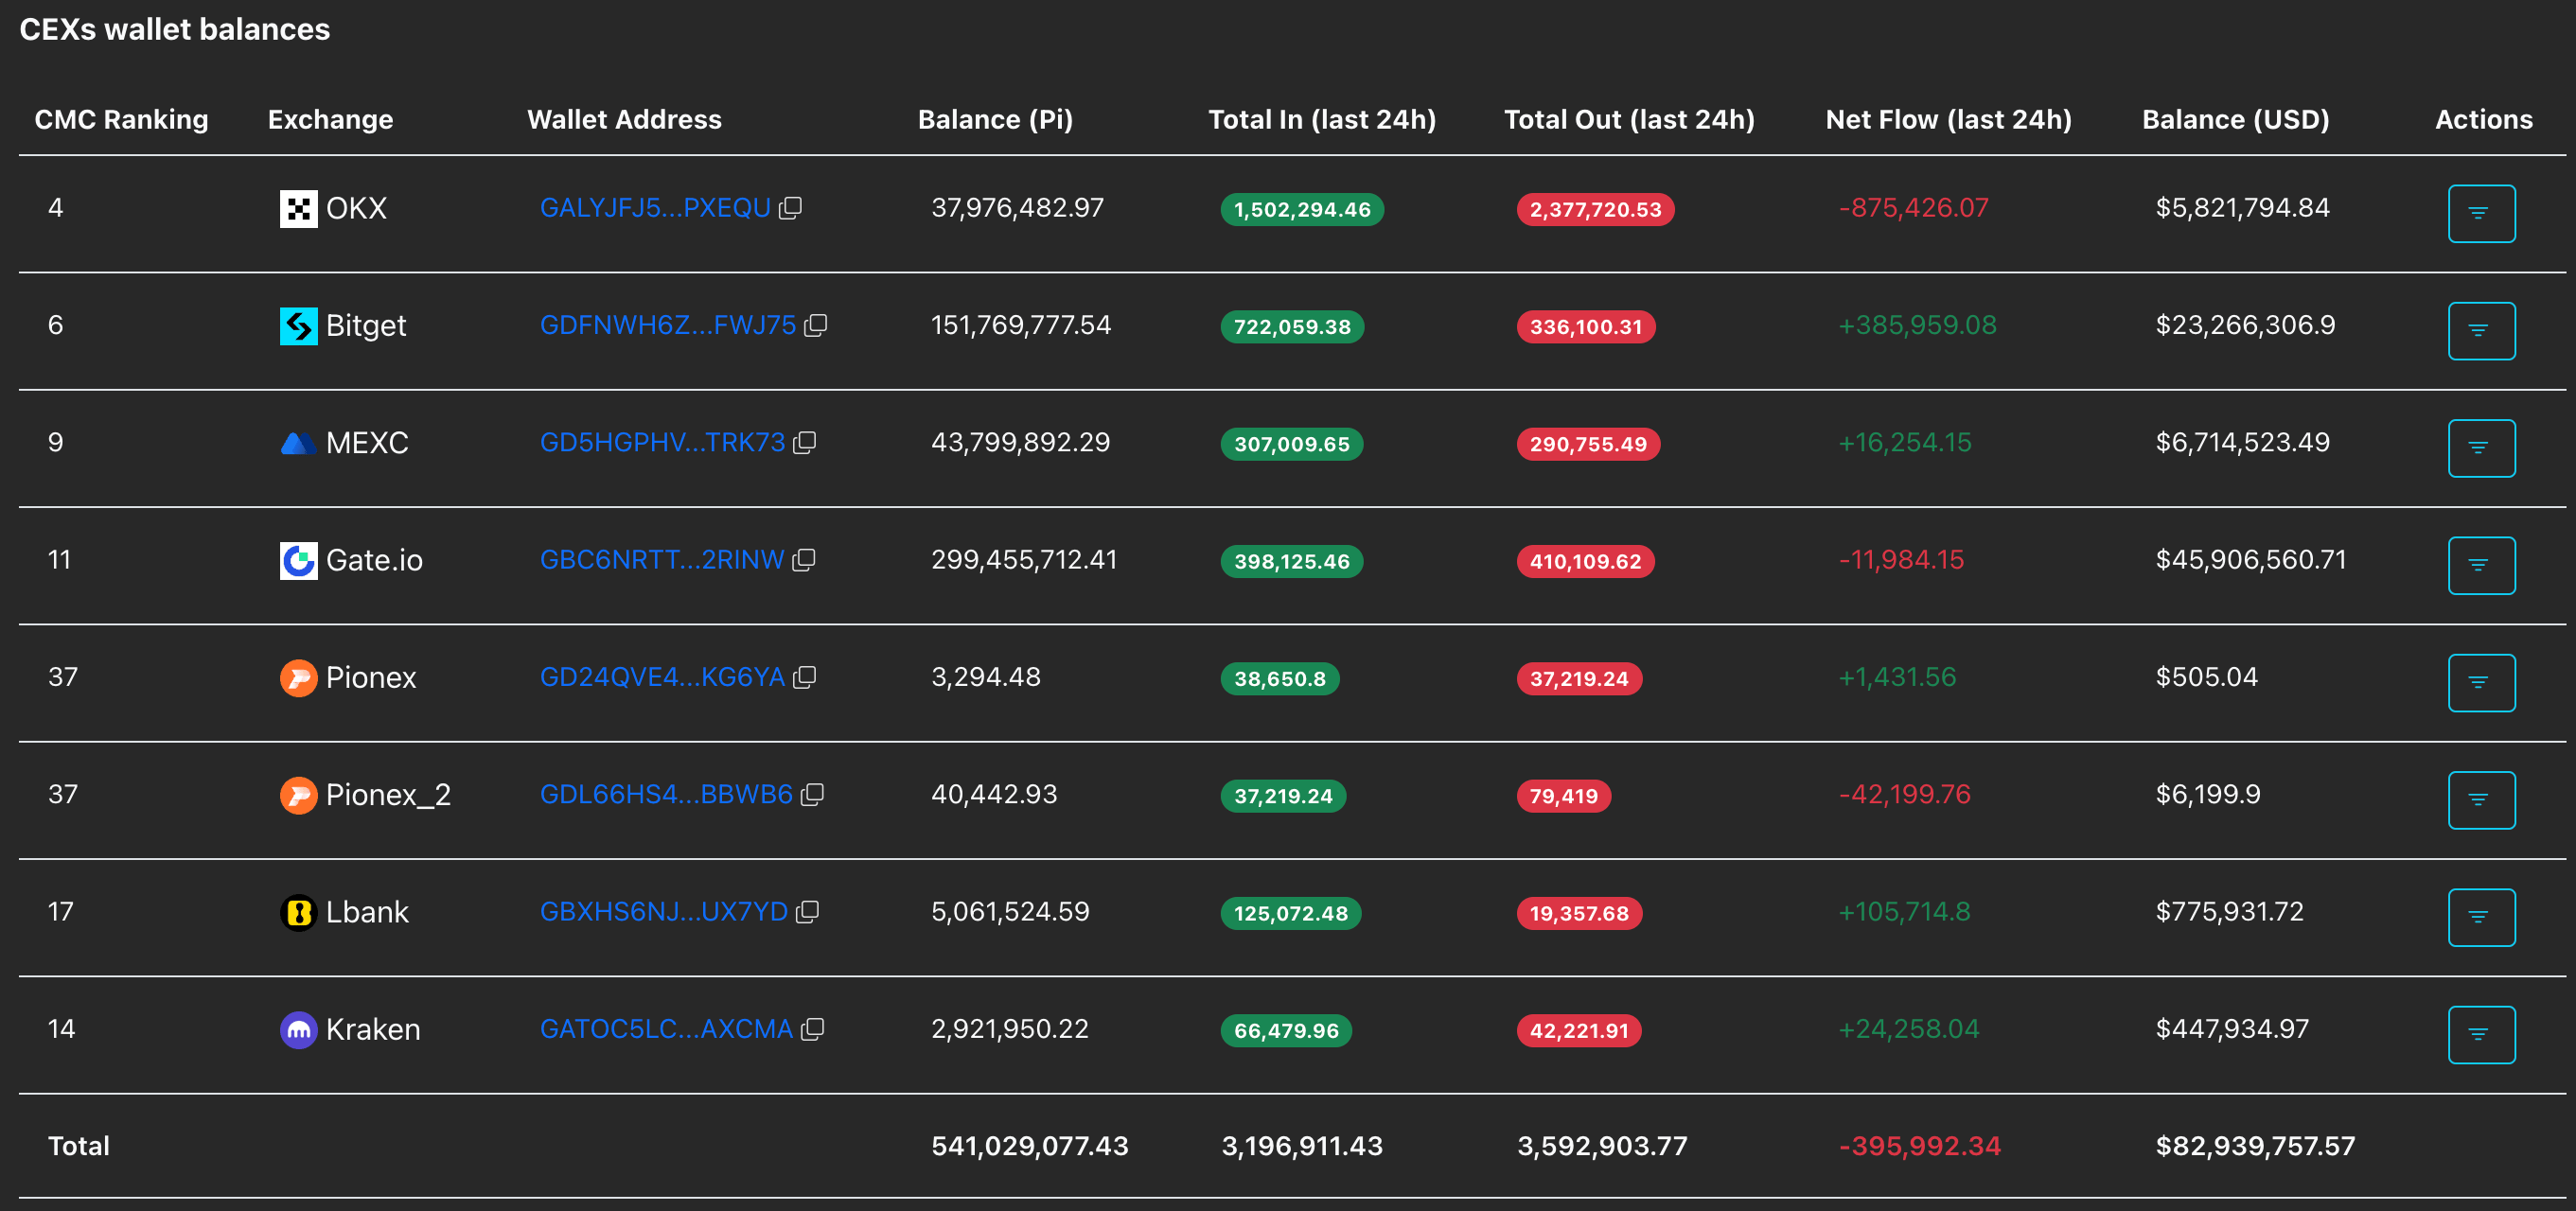
- PiScan data shows minor outflows from Centralized Exchanges, supporting the short-term recovery.
- The technical outlook is cautiously bullish, as waning selling pressure supports a potential breakout.
Pi Network (PI) holds steady above $0.1500 at press time on Friday as Centralized Exchanges (CEXs) record minor outflows over the last 24 hours. The technical outlook for PI is mildly bullish, with waning downside pressure while price wavers below a key resistance level at $0.1550.
CEX withdrawals support PI token recovery
Typically, a reduction in available supply on CEXs implies a demand surge. In the case of Pi Network, PiScan data shows roughly 400,00 PI tokens were withdrawn from CEXs in the last 24 hours, suggesting short-term buying activity. A steady decline in CEX reserves could support PI token's next recovery run.
Will Pi Network rally to the upside?
Pi Network trades at $0.1536, at press time on Friday, beneath the 50-period EMA at $0.1573 and the 200-period EMA at $0.1680, keeping the near-term bias bearish. Price action shows a consolidation range defined by Tuesday's low and high at $0.1463 and $0.1550, respectively.
To reinstate an upward trend, PI should clear the $0.1550 ceiling and the 50-period EMA at $0.1573. This would open the path toward the 200-period EMA at $0.1680.
The Moving Average Convergence Divergence (MACD) and its signal line rise but remain below the zero line on the 4-hour chart, suggesting a short-term recovery within a broader bearish trend. Meanwhile, the Relative Strength Index (RSI) is at roughly 50, holding a neutral stand as selling pressure wanes.
Looking down, a clear support remains at Tuesday's low of $0.1463, guarding the downside toward PI token's all-time low of $0.1310.
(The technical analysis of this story was written with the help of an AI tool.)
Bitcoin, altcoins, stablecoins FAQs
Bitcoin is the largest cryptocurrency by market capitalization, a virtual currency designed to serve as money. This form of payment cannot be controlled by any one person, group, or entity, which eliminates the need for third-party participation during financial transactions.
Altcoins are any cryptocurrency apart from Bitcoin, but some also regard Ethereum as a non-altcoin because it is from these two cryptocurrencies that forking happens. If this is true, then Litecoin is the first altcoin, forked from the Bitcoin protocol and, therefore, an “improved” version of it.
Stablecoins are cryptocurrencies designed to have a stable price, with their value backed by a reserve of the asset it represents. To achieve this, the value of any one stablecoin is pegged to a commodity or financial instrument, such as the US Dollar (USD), with its supply regulated by an algorithm or demand. The main goal of stablecoins is to provide an on/off-ramp for investors willing to trade and invest in cryptocurrencies. Stablecoins also allow investors to store value since cryptocurrencies, in general, are subject to volatility.
Bitcoin dominance is the ratio of Bitcoin's market capitalization to the total market capitalization of all cryptocurrencies combined. It provides a clear picture of Bitcoin’s interest among investors. A high BTC dominance typically happens before and during a bull run, in which investors resort to investing in relatively stable and high market capitalization cryptocurrency like Bitcoin. A drop in BTC dominance usually means that investors are moving their capital and/or profits to altcoins in a quest for higher returns, which usually triggers an explosion of altcoin rallies.

超过一百万用户依赖 FXStreet 获取实时市场数据、图表工具、专家洞见和外汇新闻。其全面的经济日历和教育网络研讨会帮助交易者保持信息领先、做出审慎决策。FXStreet 拥有约 60 人的团队,分布在巴塞罗那总部及全球各地区。
阅读更多


