
Pi Network Price Forecast: PI rallies ahead of its first anniversary
作者 Vishal Dixit
发布日期: 17 Feb 2026 | 修改日期: 17 Feb 2026


热门文章

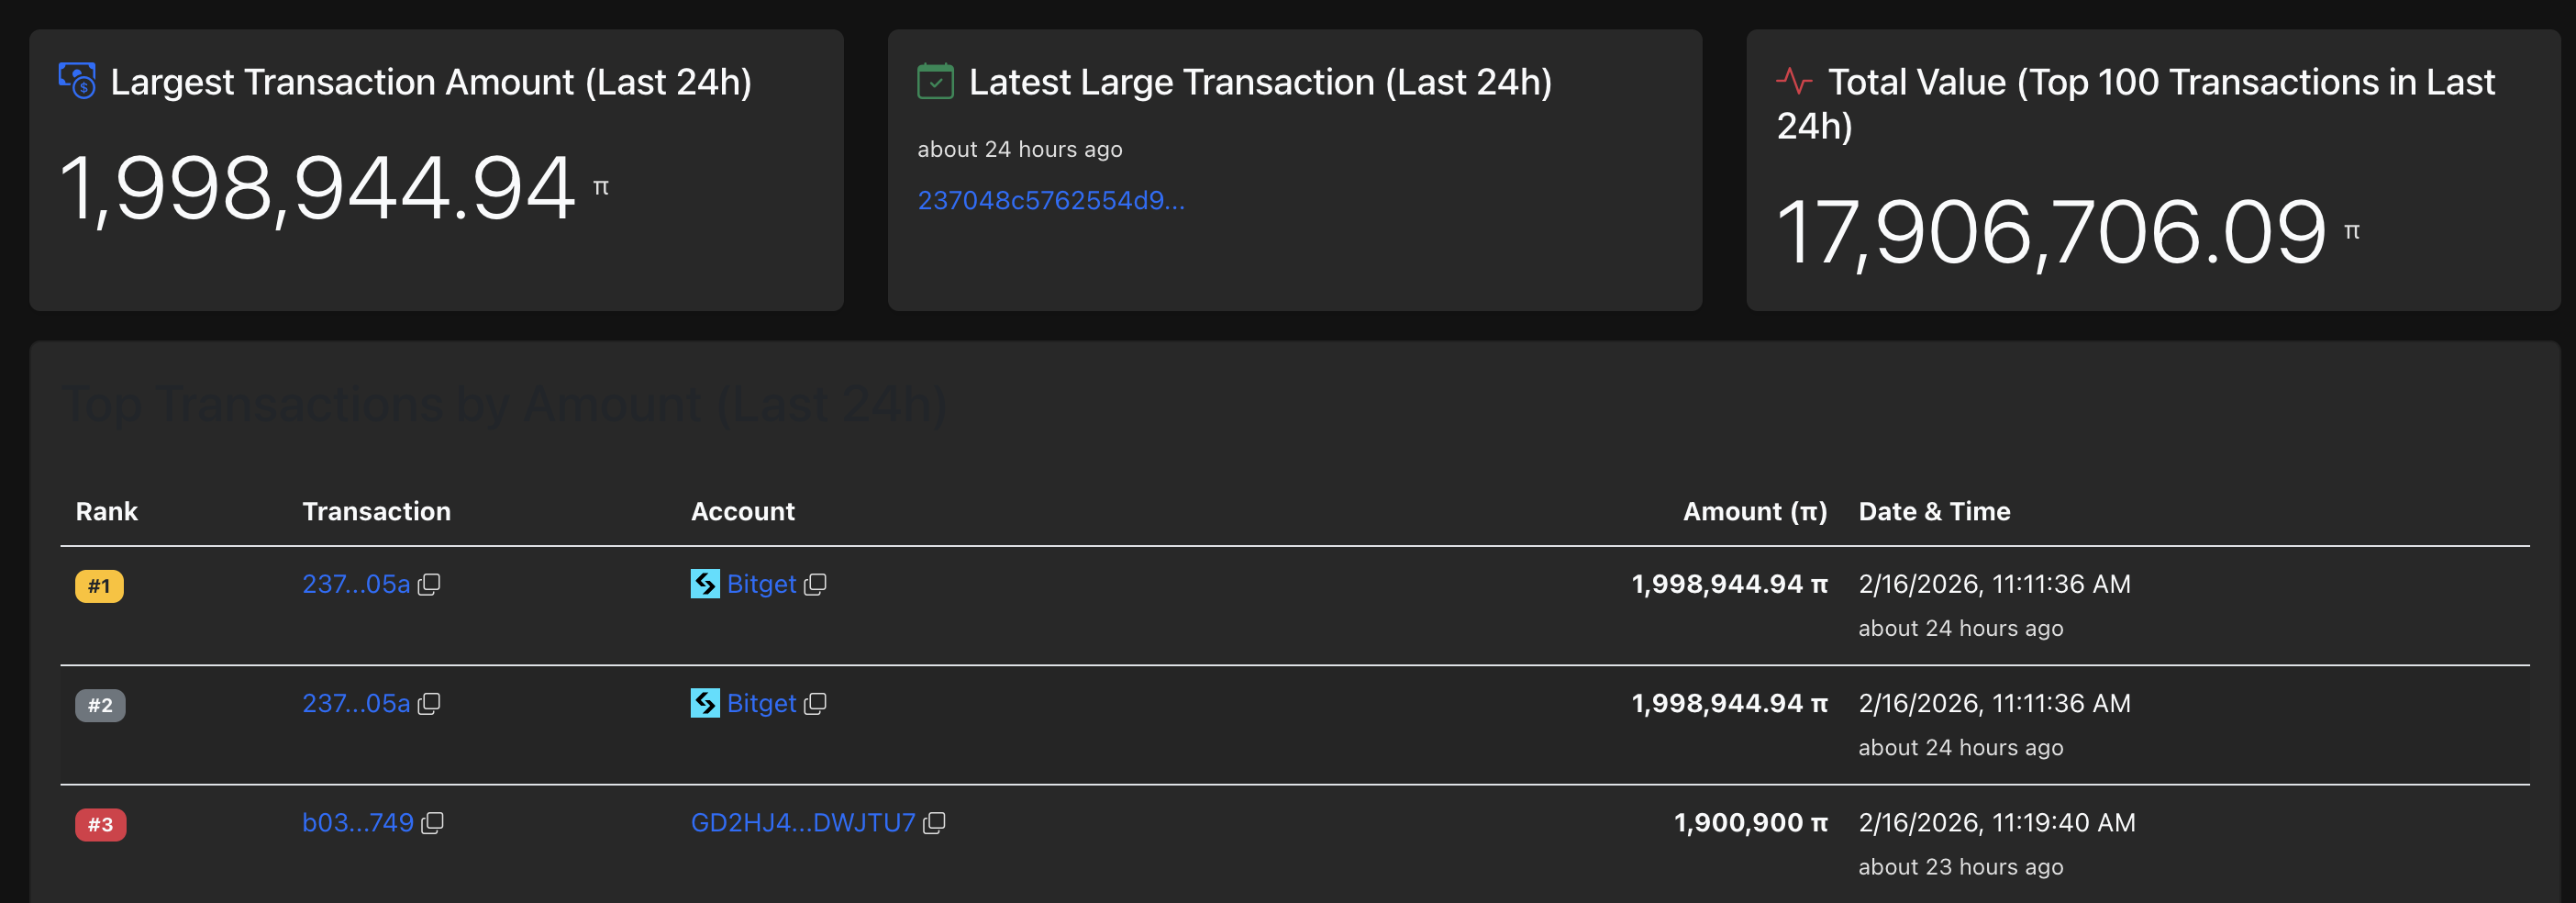
Pi Network (PI) trades above $0.1800 at the time of writing on Tuesday, recording nearly 5% gains so far. On-chain data indicate that large wallet investors, commonly known as whales, have accumulated approximately 4 million PI tokens over the last 24 hours.
- Pi Network is up roughly 5% on Tuesday, with bulls targeting a move above the 50-day EMA.
- PiScan data indicate that large wallet investors have acquired nearly 4 million PI tokens over the last 24 hours.
- The technical outlook for Pi Network centers on the 50-day EMA, which serves as the immediate resistance level.
Pi Network (PI) trades above $0.1800 at the time of writing on Tuesday, recording nearly 5% gains so far. On-chain data indicate that large wallet investors, commonly known as whales, have accumulated approximately 4 million PI tokens over the last 24 hours. Technically, Pi Network could extend its tally with a decisive breakout of the 50-day Exponential Moving Average (EMA).
Pi Network gains demand ahead of first release anniversary
Piscan data shows two large value withdrawals of 1.99 million PI tokens each over the last 24 hours, reflecting heightened demand from whales. The sudden increase in whale activity aligns with the upcoming first anniversary of the open-net release on Friday (February 20).
Pi Network eyes extend gains amid rising bullish momentum
Pi Network has shown a sharp 20% recovery since Thursday, bouncing off the S1 Pivot Point at $0.1327. The briskly V-shaped recovery tests the 50-day EMA at 0.1767 with bulls focusing on a potential breakout.
A decisive daily close above this level could confirm the bullish shift and extend the rally to the support-turned-resistance level, aligning with the October 11 low at $0.1919.
The technical indicators on the daily chart remain bullish. The Relative Strength Index (RSI) at 60 rises above the midline with more upside before reaching the overbought zone. At the same time, the Moving Average Convergence Divergence (MACD) shows a steady upward trend toward the zero line as positive histograms widen, suggesting increasing bullish momentum.
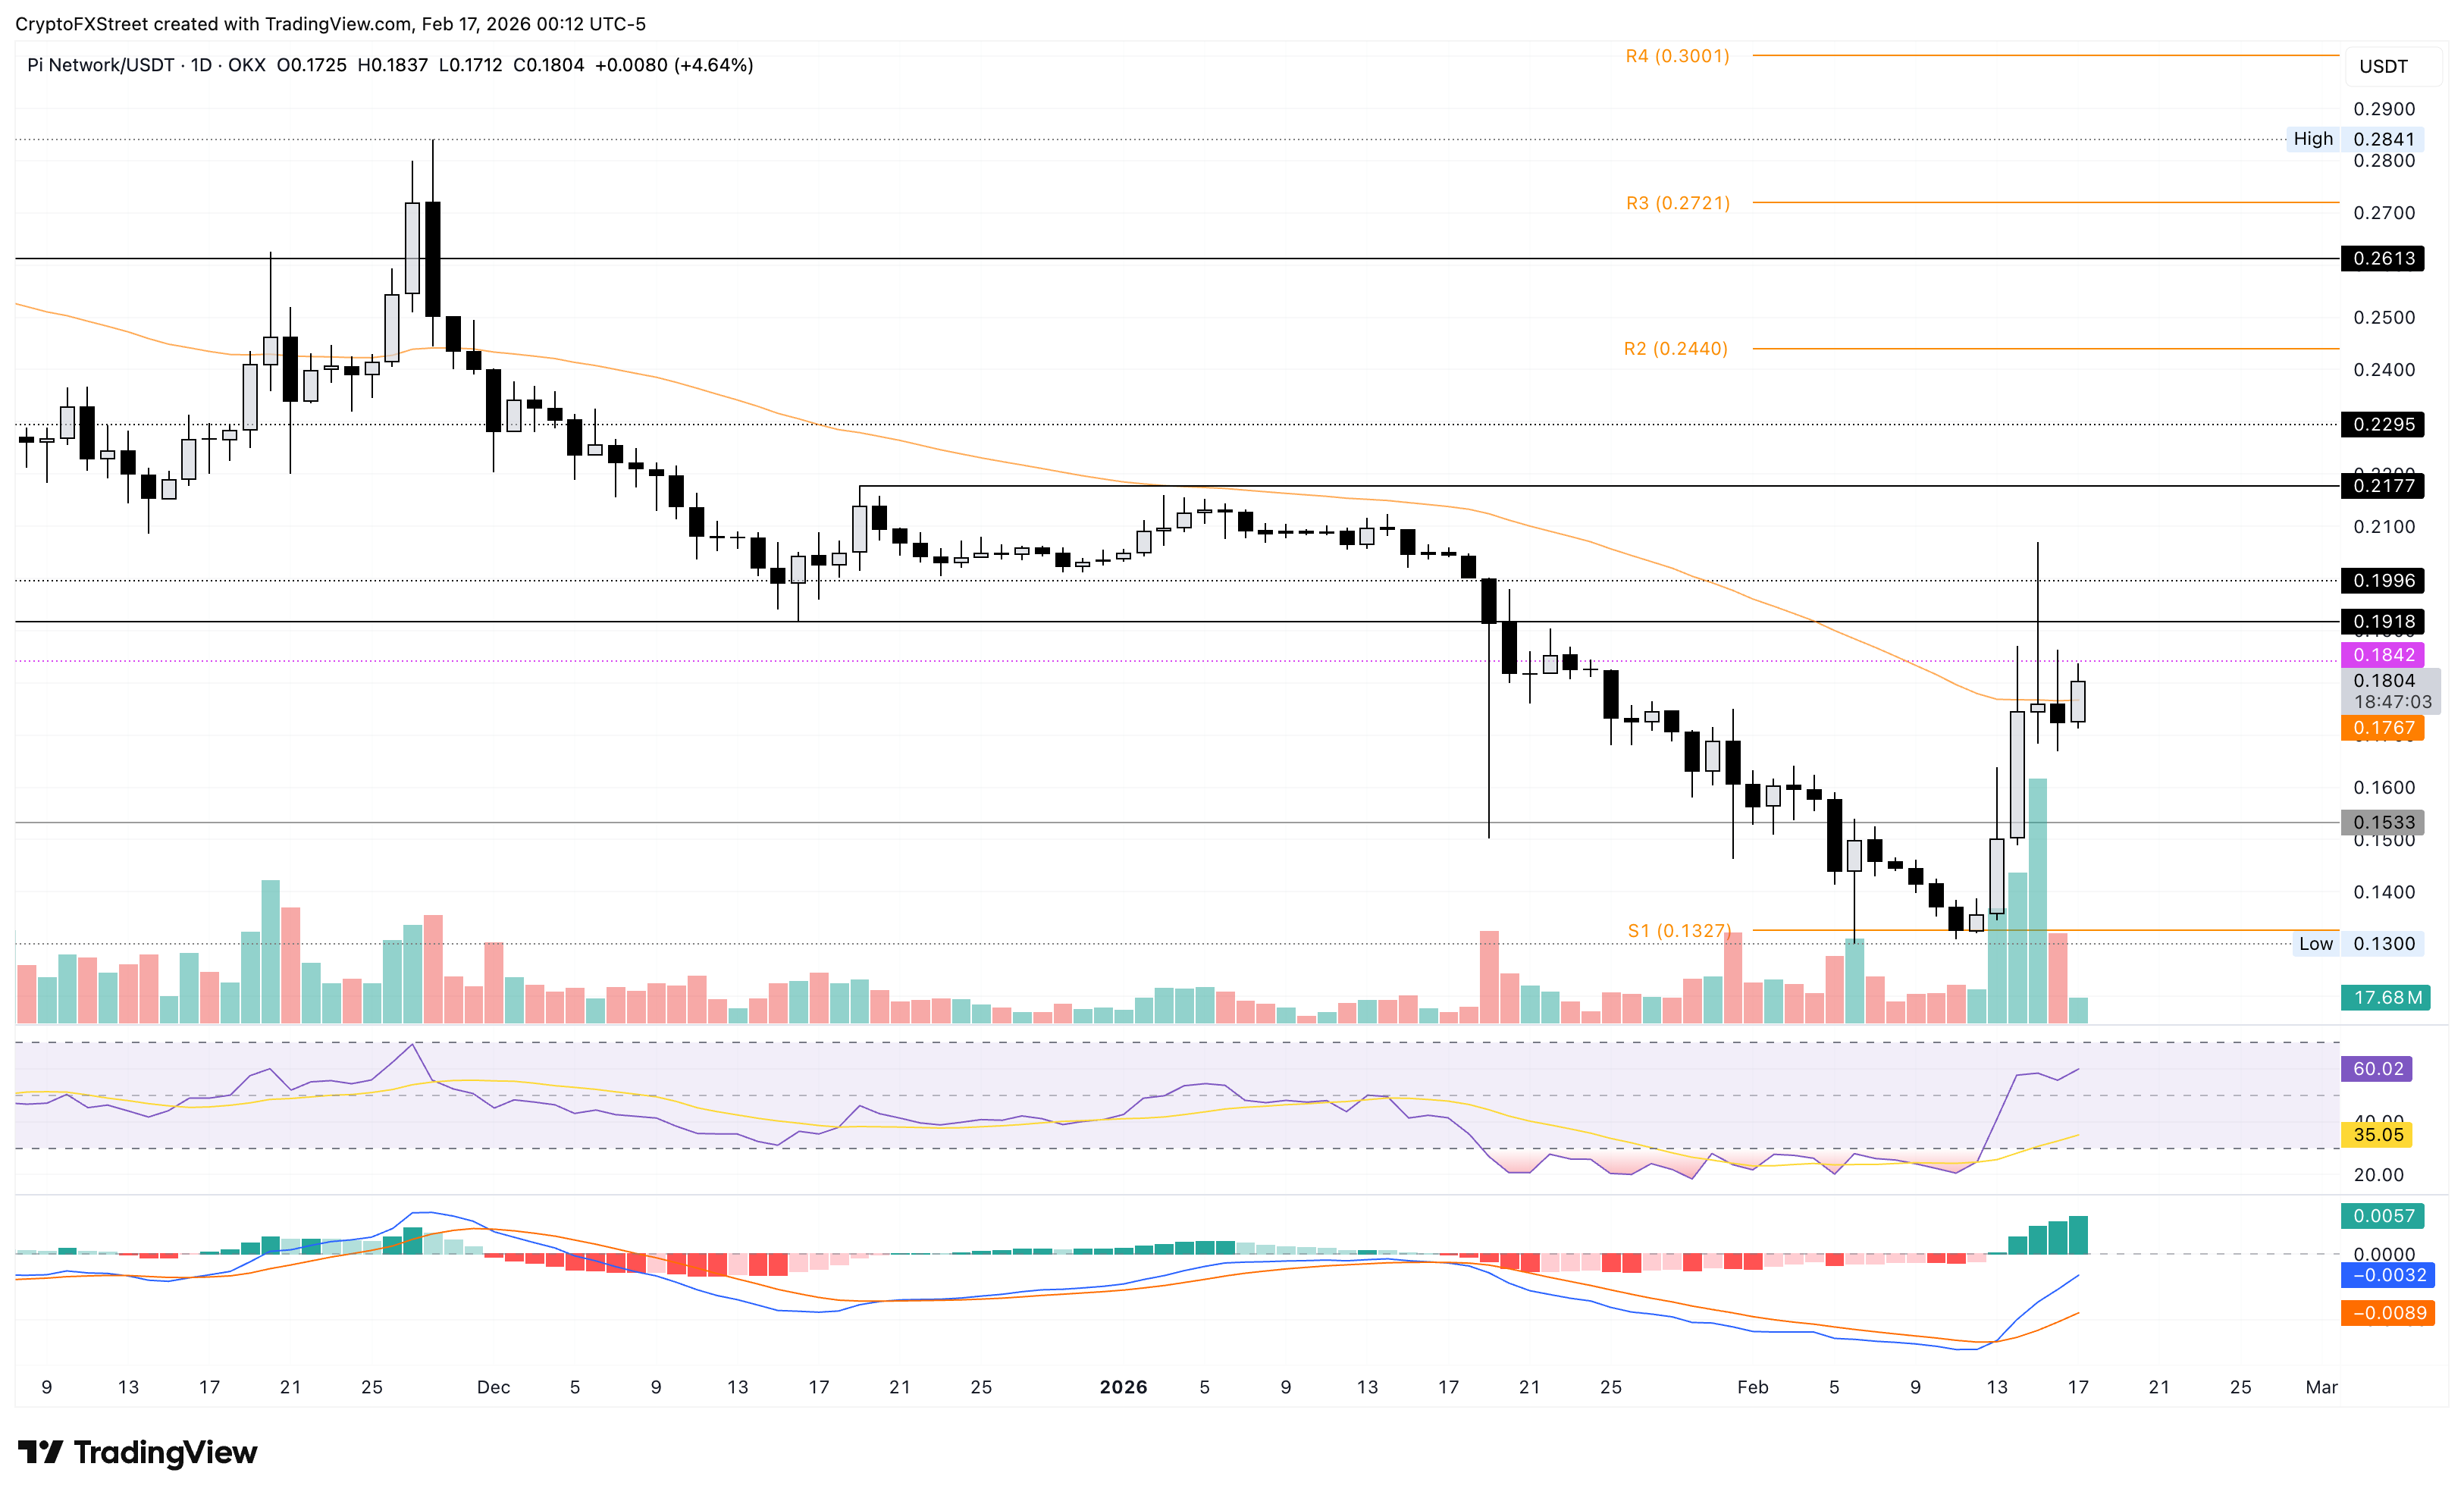
On the flip side, a close below $0.1767 could cap bullish momentum, likely leading to a retest of the October 10 low at $0.1533.

超过一百万用户依赖 FXStreet 获取实时市场数据、图表工具、专家洞见和外汇新闻。其全面的经济日历和教育网络研讨会帮助交易者保持信息领先、做出审慎决策。FXStreet 拥有约 60 人的团队,分布在巴塞罗那总部及全球各地区。
阅读更多


