
Pi Network Price Forecast: PI remains under pressure, risking further losses
作者 Vishal Dixit
更新: 25 Mar 2026


热门文章
Pi Network (PI) trades slightly below $0.1900 at press time on Wednesday, maintaining a broadly sideways trend after Sunday’s 4% drop. PiScan data shows over 1 million PI tokens left the Centralized Exchanges (CEXs) in the last 24 hours, indicating strong buying pressure.
- Pi Network hovers below $0.1900 on Wednesday, clinging to the 50-day EMA support.
- Investors are buying the dip as the Centralized Exchanges record outflows of over 1 million in the last 24 hours.
- The technical outlook for PI is mildly bearish after a 4% drop on Sunday.
Pi Network (PI) trades slightly below $0.1900 at press time on Wednesday, maintaining a broadly sideways trend after Sunday’s 4% drop. PiScan data shows over 1 million PI tokens left the Centralized Exchanges (CEXs) in the last 24 hours, indicating strong buying pressure. Still, the technical outlook is mildly bearish, as PI risks losing support from the 50-day Exponential Moving Average (EMA).
Renewed demand for PI
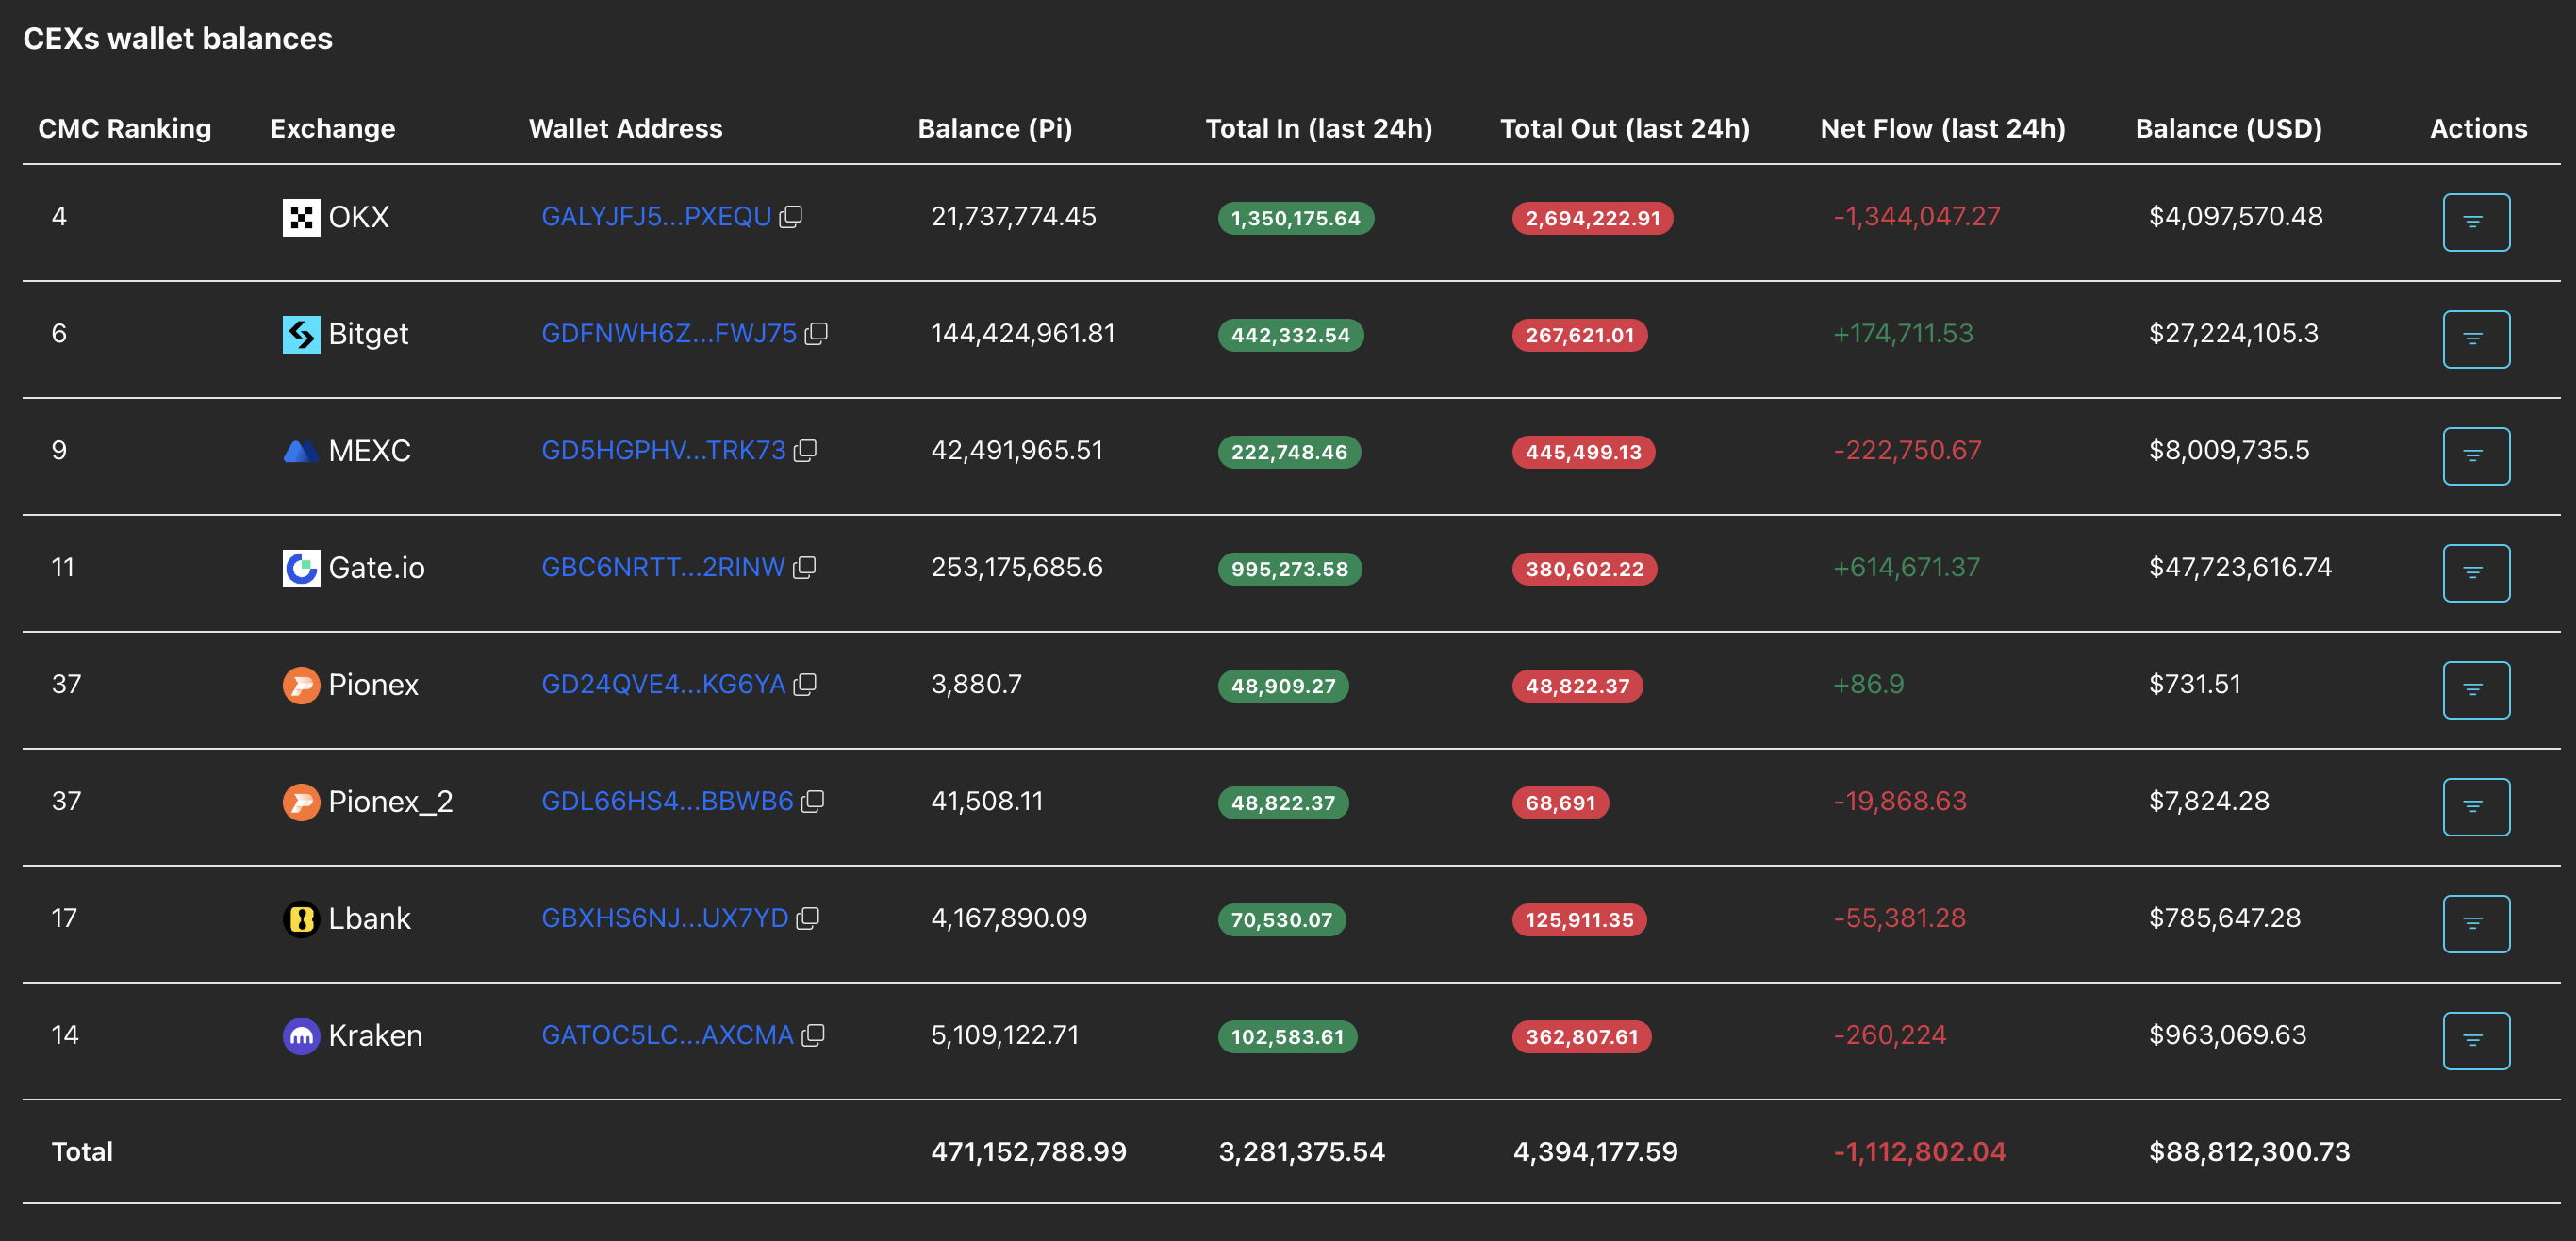
PiScan data shows that CEXs recorded 1.11 million PI tokens being withdrawn over the last 24 hours, indicating intense buying that has reduced the available supply that fueled selling pressure. Outflows from OKX and Kraken reflect steady demand in the US market.
Technical outlook: Will Pi Network extend losses below the 50-day EMA?
Pi Network remains under pressure after the 4% drop on Sunday. The near-term bias is mildly bearish, as the PI token trades below the 50-, 100-, and 200-day Exponential Moving Averages (EMAs), reinforcing the downside bias.
Looking down, the immediate support appears at $0.1736, with a break opening the way toward $0.1556. A sustained move below this level would extend the corrective phase and risk a deeper slide.
The Moving Average Convergence Divergence (MACD) line stays below its signal line, as both approach the zero line while negative histograms contract, suggesting persistent but modest downside momentum after the late-February spike faded. The Relative Strength Index (RSI) at 48 remains neutral, reinforcing the view of soft selling pressure rather than an impulsive downtrend.
On the flip side, the 100-day EMA at $0.1980 caps the upside toward the March 7 high at $0.2396.
(The technical analysis of this story was written with the help of an AI tool.)

超过一百万用户依赖 FXStreet 获取实时市场数据、图表工具、专家洞见和外汇新闻。其全面的经济日历和教育网络研讨会帮助交易者保持信息领先、做出审慎决策。FXStreet 拥有约 60 人的团队,分布在巴塞罗那总部及全球各地区。
阅读更多


