
Pi Network Price Forecast: PI risks steeper decline as market sentiment wanes
作者 Vishal Dixit
更新: 23 Jun 2026


热门文章

Pi Network (PI) trades in the red below $0.1300 on Tuesday, testing the bearish breakout of a rising support trendline amid rising selling pressure and faltering broader market sentiment.
- Pi Network is down 2% on Tuesday, testing the bearish breakout of a rising support trendline near $0.1300.
- Negative cumulative volume delta reflects a seller-dominant spot market, suggesting further downside potential.
- The technical outlook for PI is bearish, prompting a 10% downside risk toward the June 6 low at $0.1184.
Pi Network (PI) trades in the red below $0.1300 on Tuesday, testing the bearish breakout of a rising support trendline amid rising selling pressure and faltering broader market sentiment.
Sellers maintain dominance amid weak market sentiment
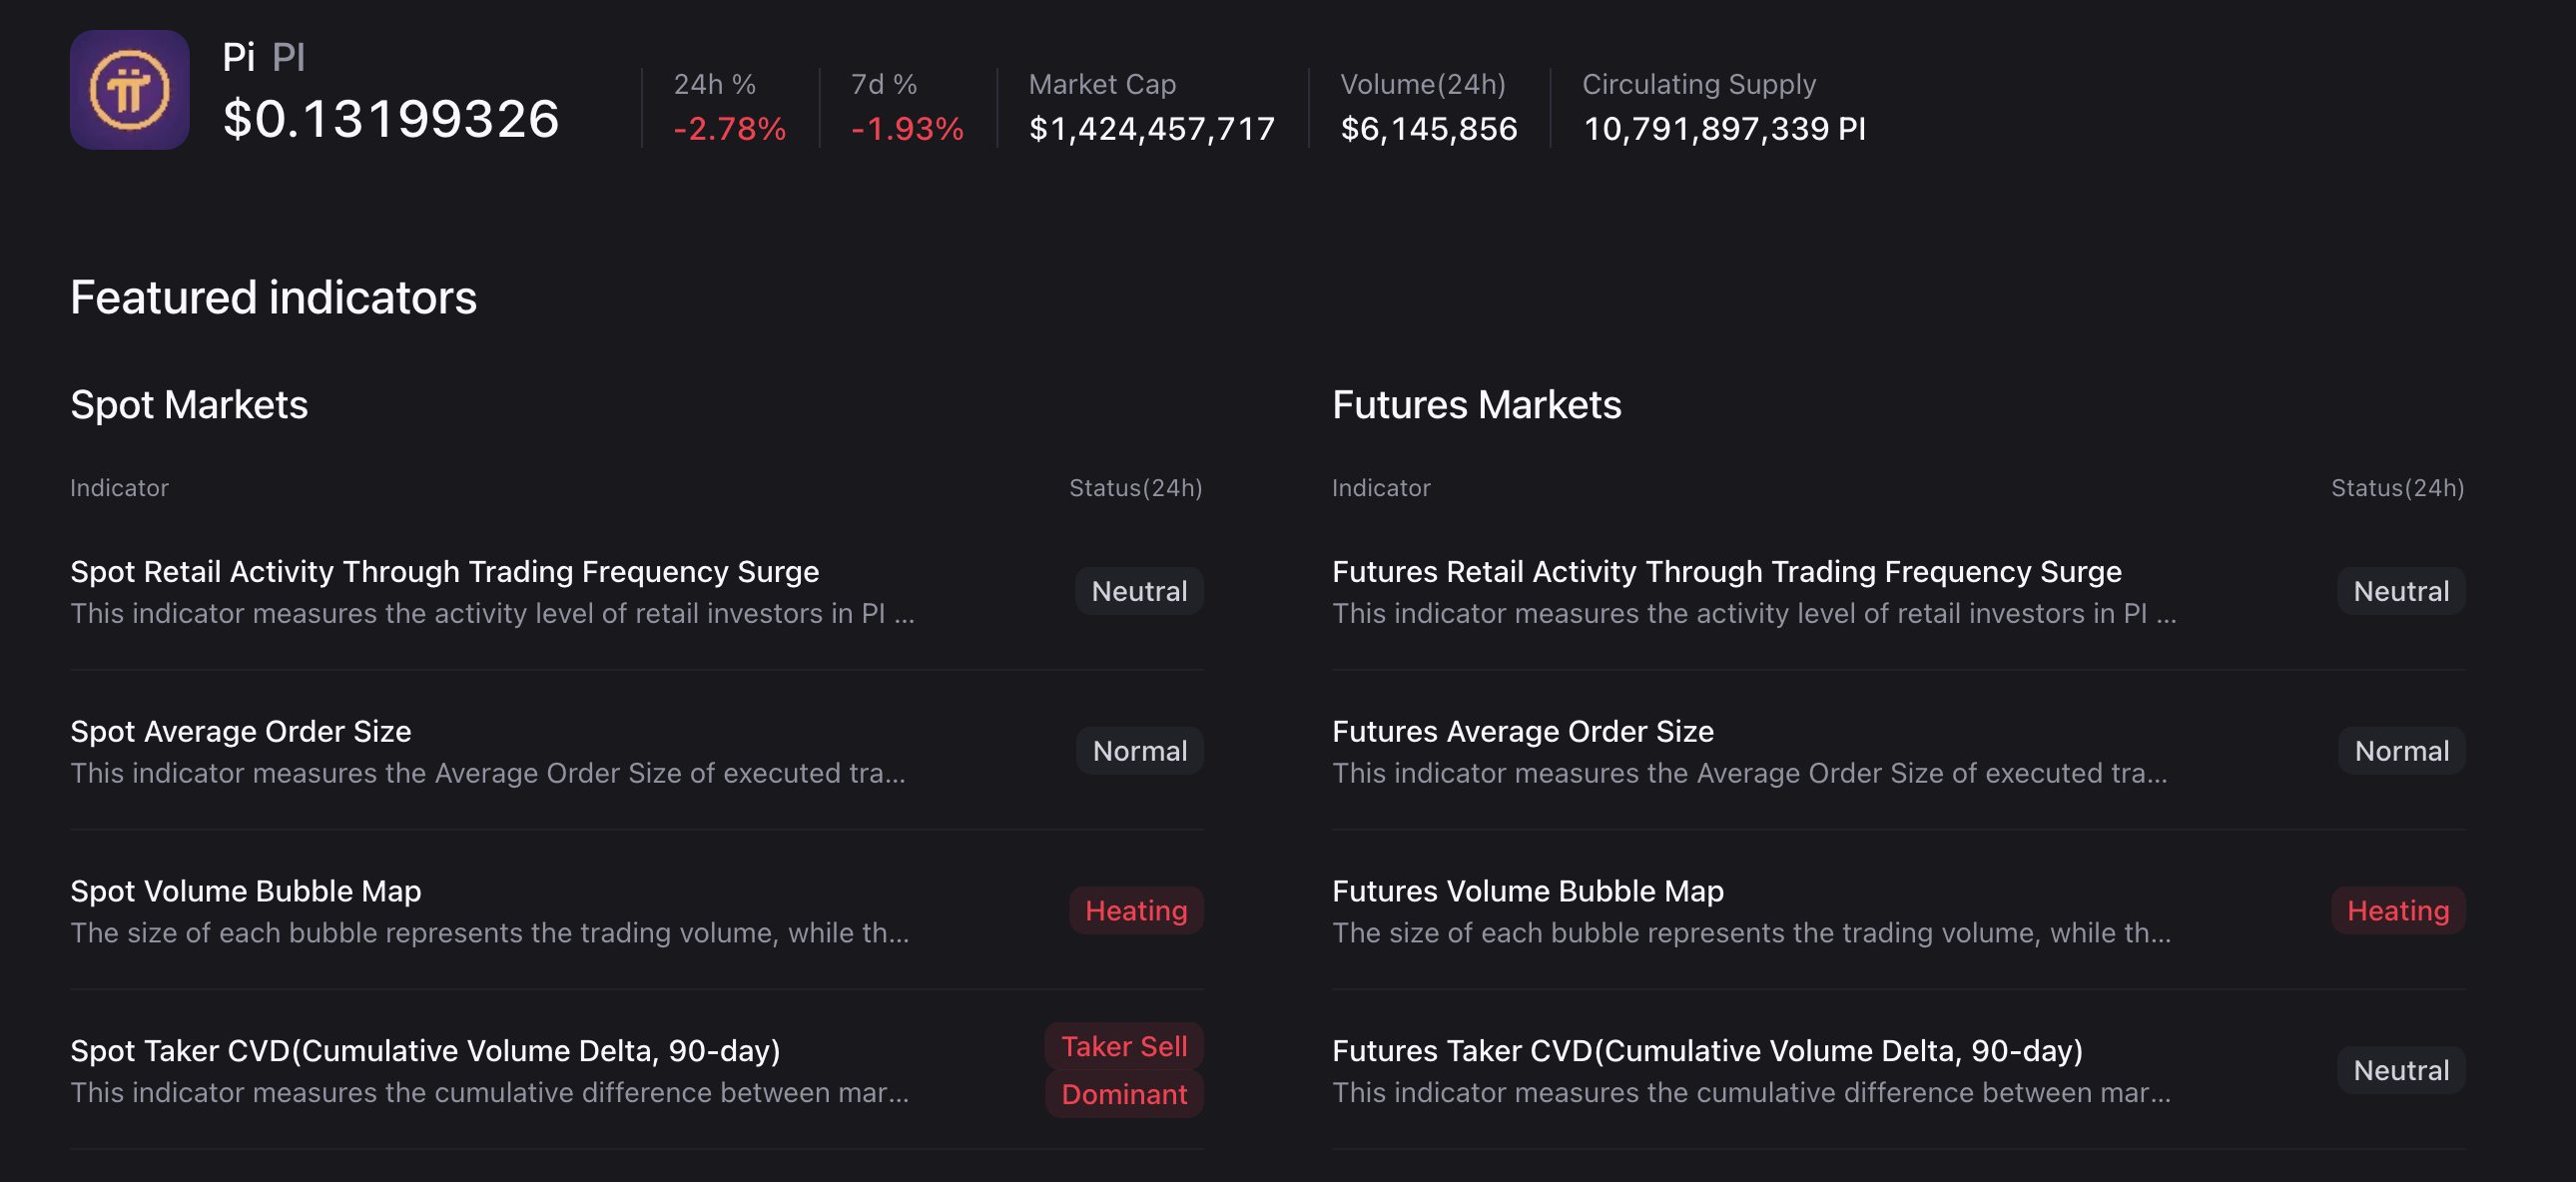
Pi Network continues to face intense selling pressure in the spot market as demand wanes amid weakening broader market sentiment. CryptoQuant data show the taker Cumulative Volume Delta (CVD) has been negative and contracting over the last 90 days, suggesting sellers are dominating the market based on the difference between market buy and market sell volumes.
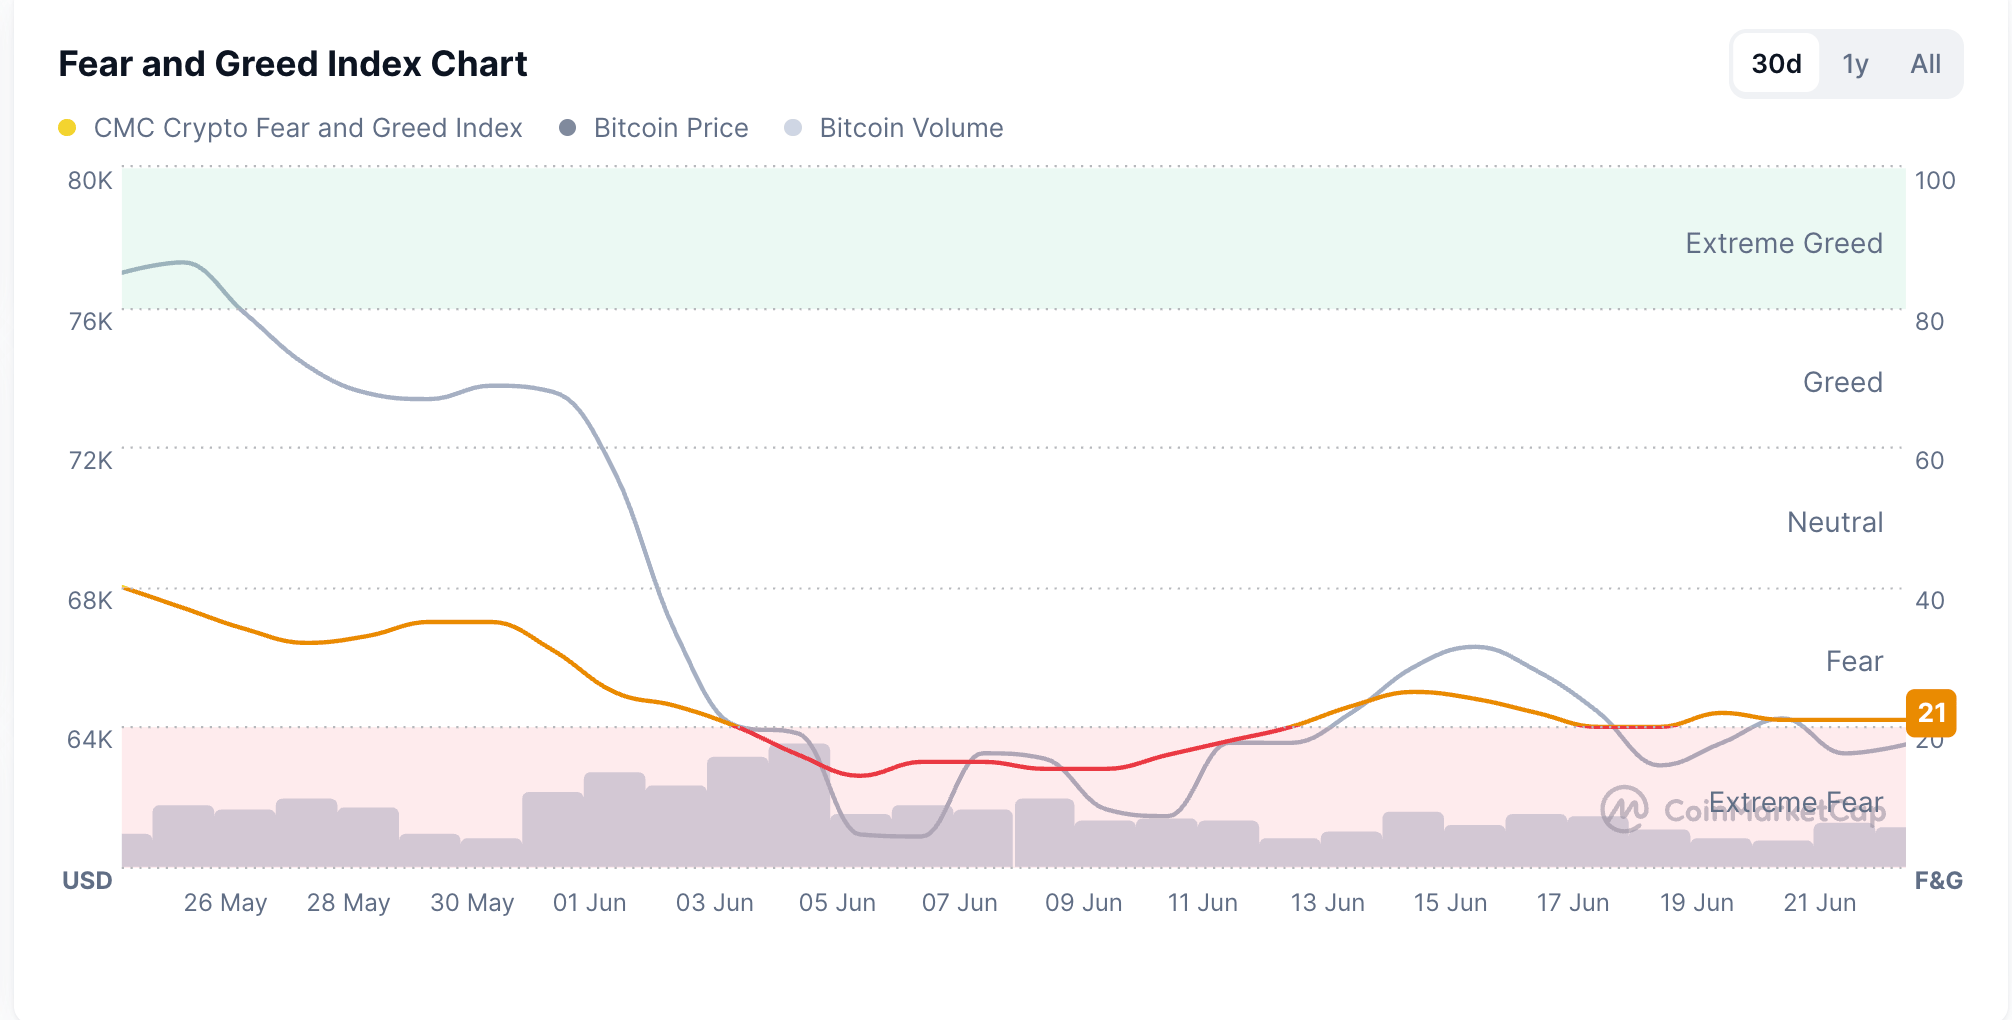
At the same time, the broader market sentiment weakens. CoinMarketCap’s Fear and Greed Index at 21 on Tuesday reflects a clear risk-off signal and could flash “Extreme Fear” if it falls below 20. Typically, high-risk, community-driven, speculative crypto assets like PI token extend losses amid risk-averse market conditions.
Technical outlook: Will Pi Network hit a fresh low?
Pi Network extends a bearish tone as price drops below the 50-period Exponential Moving Average (EMA) at $0.1335 on the 4-hour chart and the $0.1300 mark. The PI token has slipped back under the prior rising support trendline around $0.1300, where a decisive close would confirm the bearish breakout.
From a technical perspective, the breakout could threaten the 78.6% Fibonacci retracement level at $0.1251, measured over the downswing from $0.1532 to $0.1184. The 100% Fibonacci anchor at $0.1184, followed by the 127.2% Fibonacci extension level at $0.1103, could emerge as the next bearish objectives if the downtrend extends.
That said, the momentum indicators suggest renewed selling pressure, with the Relative Strength Index (RSI) tanking to 31 on the 4-hour chart while the Moving Average Convergence Divergence (MACD) slips below the signal line, triggering a sell signal as downside pressure remains dominant despite being close to oversold conditions.
On the topside, initial resistance appears in a tight cluster between the overhead trendline near $0.1300, followed by the 50-period EMA at $0.1335, close to the 50% Fibonacci retracement at $0.1346. Further up, the 200-period EMA at $0.1390 and the 78.6% retracement at $0.1441 cap the broader recovery.
(The technical analysis of this story was written with the help of an AI tool.)
Cryptocurrency metrics FAQs
The developer or creator of each cryptocurrency decides on the total number of tokens that can be minted or issued. Only a certain number of these assets can be minted by mining, staking or other mechanisms. This is defined by the algorithm of the underlying blockchain technology. On the other hand, circulating supply can also be decreased via actions such as burning tokens, or mistakenly sending assets to addresses of other incompatible blockchains.
Market capitalization is the result of multiplying the circulating supply of a certain asset by the asset’s current market value.
Trading volume refers to the total number of tokens for a specific asset that has been transacted or exchanged between buyers and sellers within set trading hours, for example, 24 hours. It is used to gauge market sentiment, this metric combines all volumes on centralized exchanges and decentralized exchanges. Increasing trading volume often denotes the demand for a certain asset as more people are buying and selling the cryptocurrency.
Funding rates are a concept designed to encourage traders to take positions and ensure perpetual contract prices match spot markets. It defines a mechanism by exchanges to ensure that future prices and index prices periodic payments regularly converge. When the funding rate is positive, the price of the perpetual contract is higher than the mark price. This means traders who are bullish and have opened long positions pay traders who are in short positions. On the other hand, a negative funding rate means perpetual prices are below the mark price, and hence traders with short positions pay traders who have opened long positions.

超过一百万用户依赖 FXStreet 获取实时市场数据、图表工具、专家洞见和外汇新闻。其全面的经济日历和教育网络研讨会帮助交易者保持信息领先、做出审慎决策。FXStreet 拥有约 60 人的团队,分布在巴塞罗那总部及全球各地区。
阅读更多


