
Pi Network Price Forecast: PI struggles to rebound amid muted demand
作者 Vishal Dixit
发布日期: 24 Dec 2025 | 修改日期: 24 Dec 2025


热门文章

Pi Network (PI) edges higher by almost 1% at press time on Wednesday, bouncing off the $0.2000 level after a four-day decline. The recovery lacks momentum as the social interest surrounding Pi Network declines. Technically, PI is at a crossroads, struggling for a rebound as momentum is lacking.
- Pi Network trades above $0.2000, ticking higher after four consecutive days of losses.
- The PI token is losing trading volume as social dominance and volume decline.
- The technical outlook remains mixed, with PI holding at a crucial support level.
Pi Network (PI) edges higher by almost 1% at press time on Wednesday, bouncing off the $0.2000 level after a four-day decline. The recovery lacks momentum as the social interest surrounding Pi Network declines. Technically, PI is at a crossroads, struggling for a rebound as momentum is lacking.
Retail demand wanes for PI
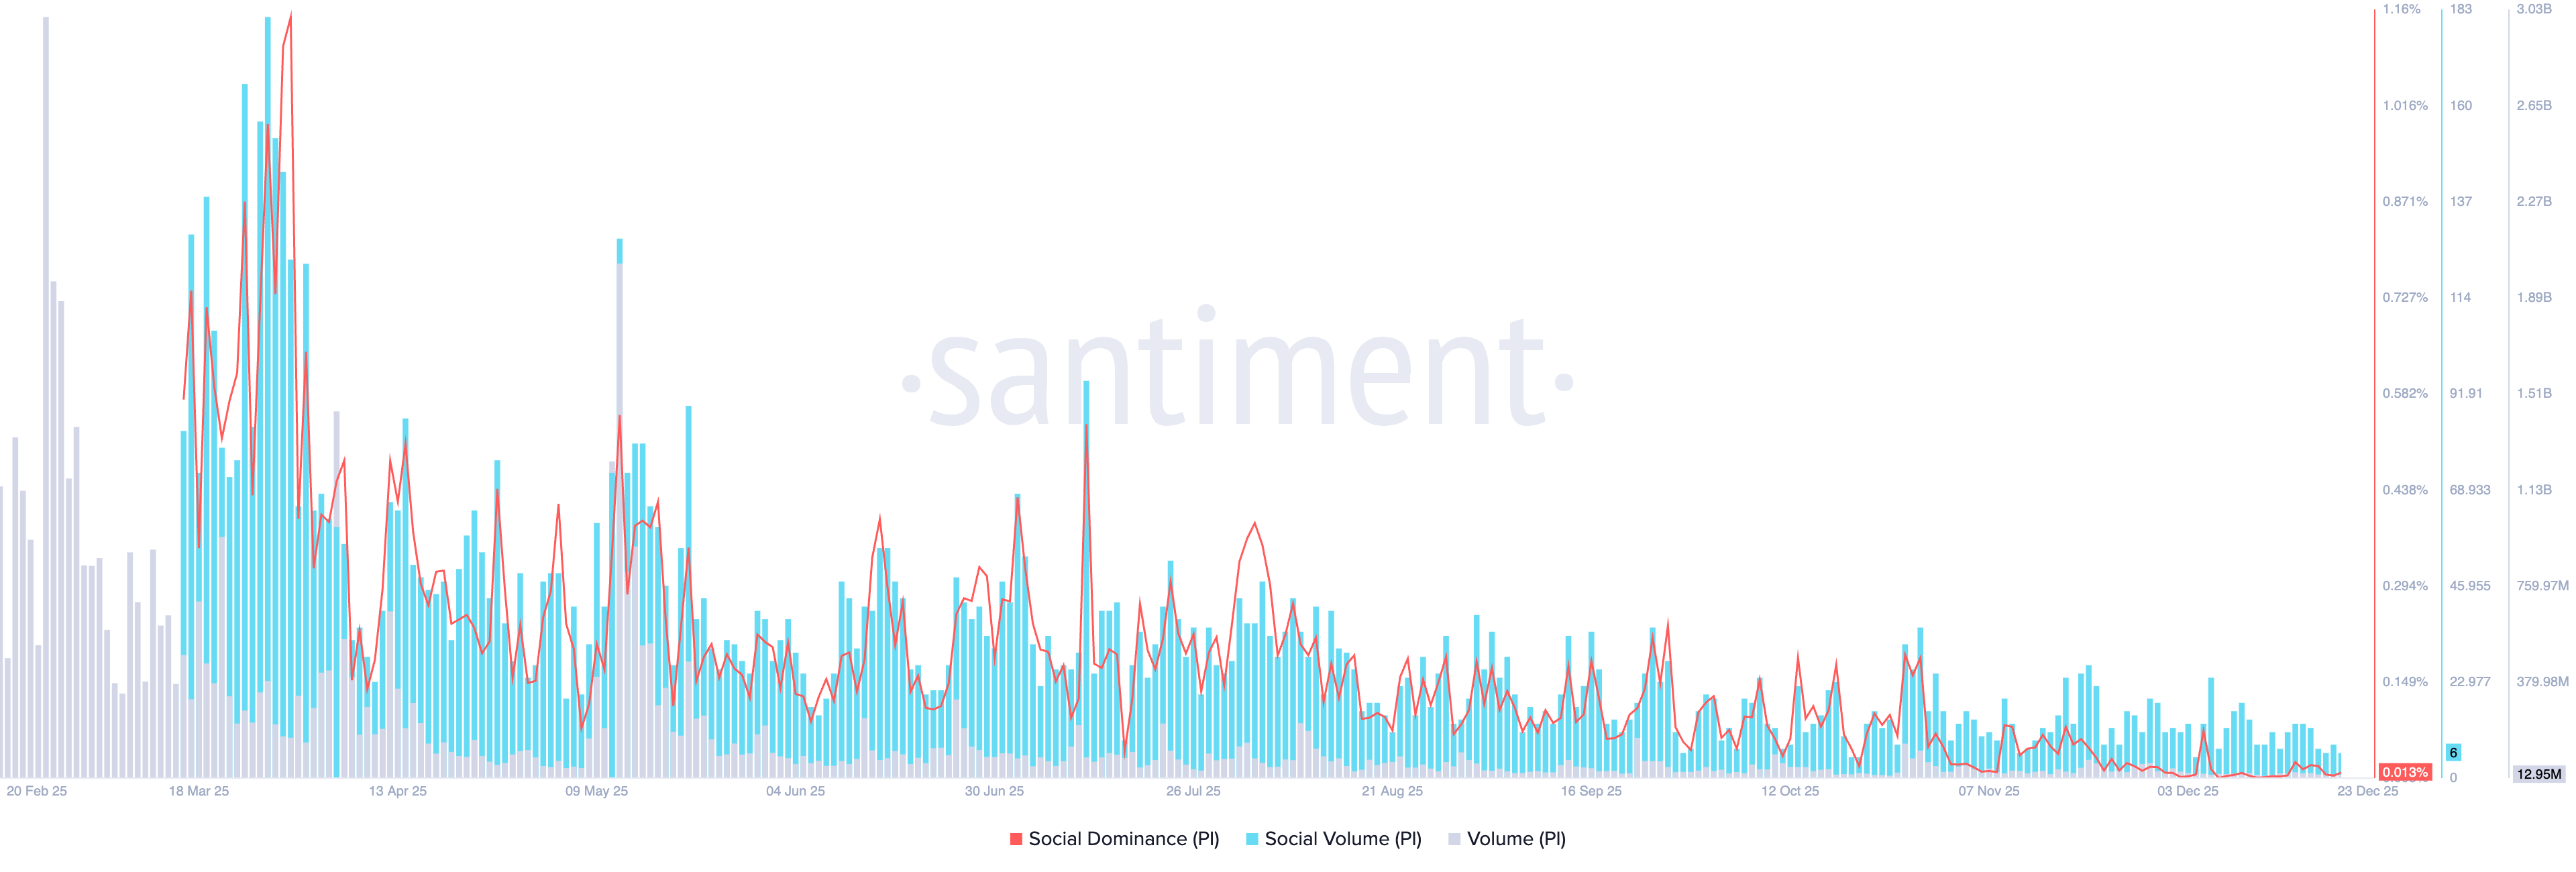
Santiment data shows that the social interest in Pi Network is declining, signaling reduced retail demand. It also shows that the social dominance and volume for PI are down to 0.013% and 6, respectively, on Wednesday, from the 0.017% and 24 peak on December 6.
Similarly, daily trading volume has shrunk to below 12 million PI, down from over 2 billion PI on May 12.
Pi Network struggles to boost demand at retail scale during the recent Pi Hackathon and the ongoing Pi’s community commerce holiday initiative. If the muted demand persists, PI could lose further ground.

Pi Network’s hold at $0.2000 is at risk
Pi Network struggles to hold above the $0.2000 level, rising 1% at press time on Wednesday, after four consecutive days of trading in the red. The intraday recovery reflects demand at this psychological level and hints at a potential rebound close from the S1 Pivot Point at $0.1997.
Still, the PI token could face opposition from the declining 50-day Exponential Moving Average (EMA) at $0.2239 before targeting the R1 Pivot Point at $0.2823.
The technical indicators on the daily chart signal a stagnancy in bearish momentum. The Relative Strength Index (RSI) is at 40, slightly reversing upward toward the halfway line. At the same time, the Moving Average Convergence Divergence (MACD) stabilizes above the signal line after crossing above it on Sunday.
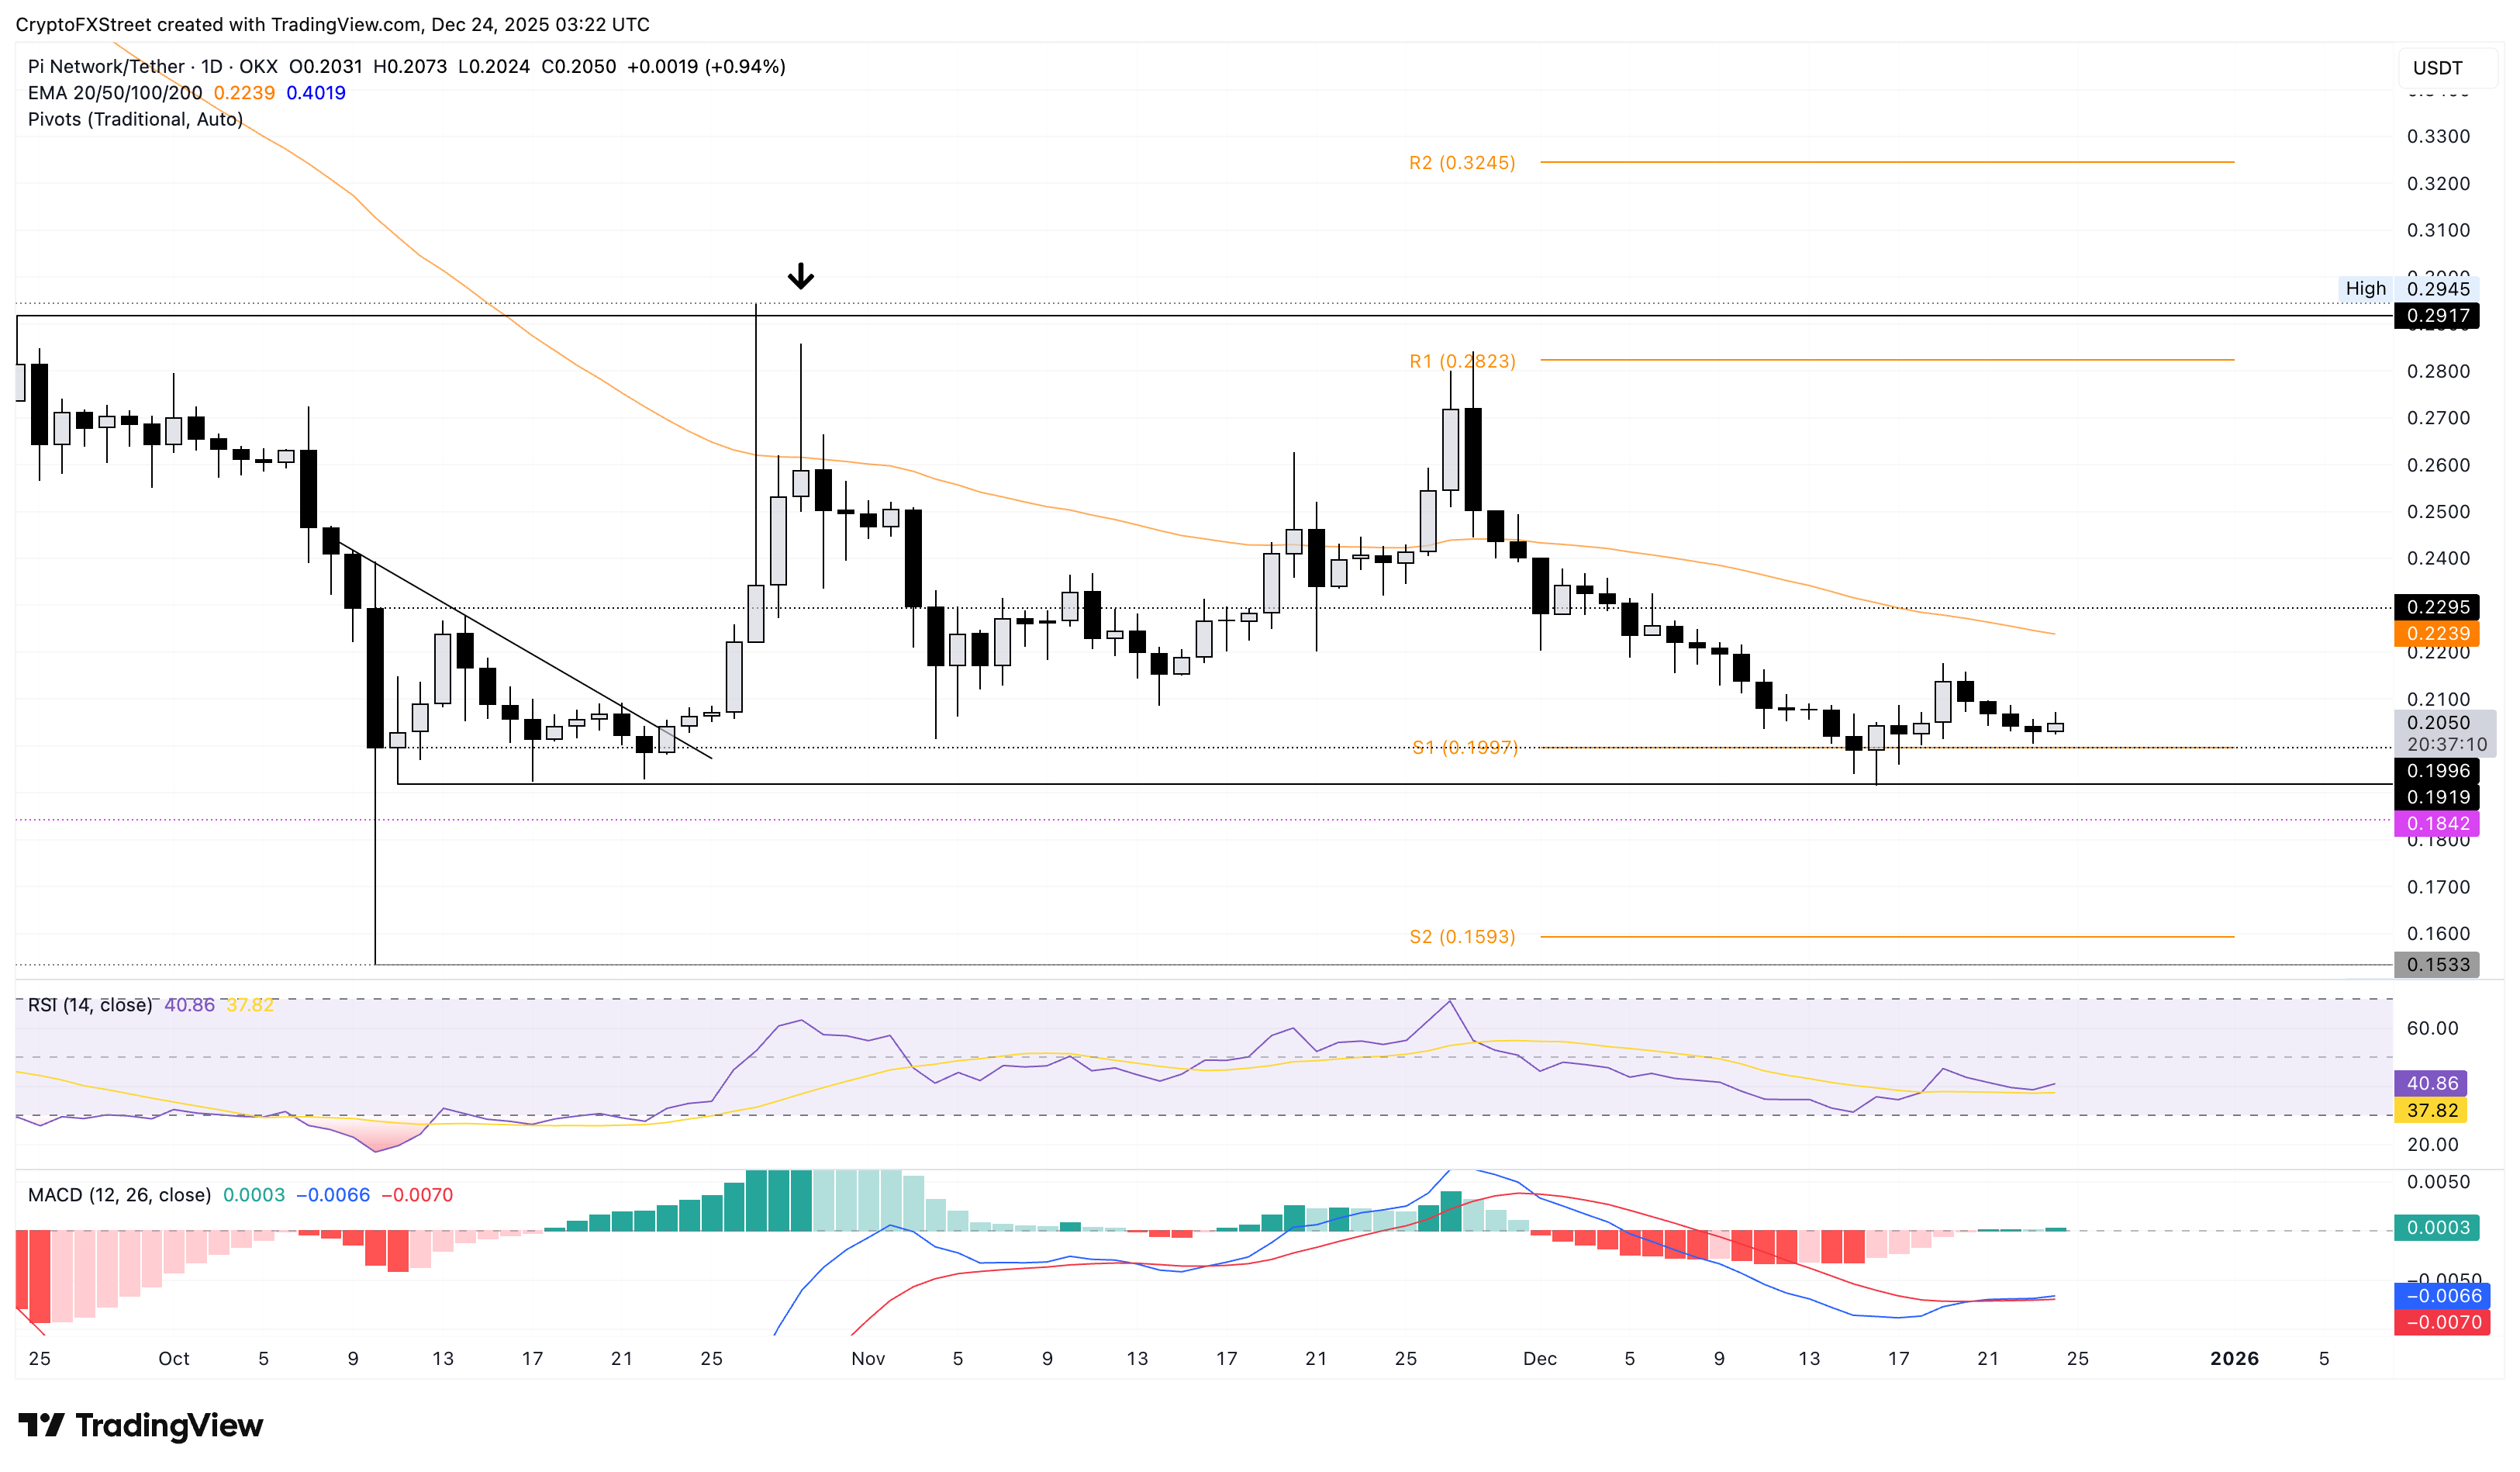
If PI fails to secure a bullish close for the day, it could extend the bearish streak below $0.2000. In such a case, the October 11 low at $0.1919 and the S2 Pivot Point at $0.1593 could serve as support levels.

超过一百万用户依赖 FXStreet 获取实时市场数据、图表工具、专家洞见和外汇新闻。其全面的经济日历和教育网络研讨会帮助交易者保持信息领先、做出审慎决策。FXStreet 拥有约 60 人的团队,分布在巴塞罗那总部及全球各地区。
阅读更多


