
Pi Network Price Forecast: PI struggles under 50-day EMA as recovery stalls
作者 Vishal Dixit
发布日期: 26 Feb 2026 | 修改日期: 26 Feb 2026


热门文章
Pi Network (PI) edges higher toward $0.1700 at press time on Thursday, building on over 3% gains from the previous day. The Pi core team is pushing nodes to upgrade to a higher version, while the community remains skeptical about the transparency of the migration.
- Pi Network hovers near $0.1700 on Thursday, struggling to extend the gains seen in the past two days.
- Pi Network faces another milestone towards its mainnet upgrade, but community criticism persists over transparency about the migration.
- The technical outlook for Pi Network remains mildly bearish as the 50-day EMA could cap the short-term recovery.
Pi Network (PI) edges higher toward $0.1700 at press time on Thursday, building on over 3% gains from the previous day. The Pi core team is pushing nodes to upgrade to a higher version, while the community remains skeptical about the transparency of the migration. The technical outlook for Pi Network remains mildly bearish as it approaches the 50-day Exponential Moving Average (EMA), which serves as an upside barrier.
Pi Network announces final dates for step 2 of the mainnet upgrade
Pi Network's core team announced March 1 as the deadline for step 2 of the mainnet upgrade, which will update the underlying Stellar blockchain to consensus protocol version 19.9 as part of its goal to reach Stellar consensus protocol version 23 by June 2026.

Meanwhile, community criticism about the transparency of the mainnet migration of tokens from the testnet persists, as Know Your Customer (KYC) verification remains a key obstacle for PI holders.
Technical outlook: Will Pi Network extend gains above the 50-day EMA?
Pi Network approaches $0.1700 at press time on Thursday after two consecutive days of gains, reflecting a short-term recovery above the $0.1533 support level. Still, the recovery remains below the 50-day EMA at $0.1748, keeping the broader trend bearish despite the latest bullish phase.
The Moving Average Convergence Divergence (MACD) remains marginally above its signal line as positive histograms fade on the daily chart, suggesting that bullish momentum has cooled. At the same time, the Relative Strength Index (RSI) at 51 remains near the midline, maintaining a neutral bias.
If PI clears the 50-day EMA at $0.1748, it could test the initial resistance at the October 11 low of $0.1919, close to a descending resistance trendline, which connects the August 30, 2025, and February 15, 2026, highs.
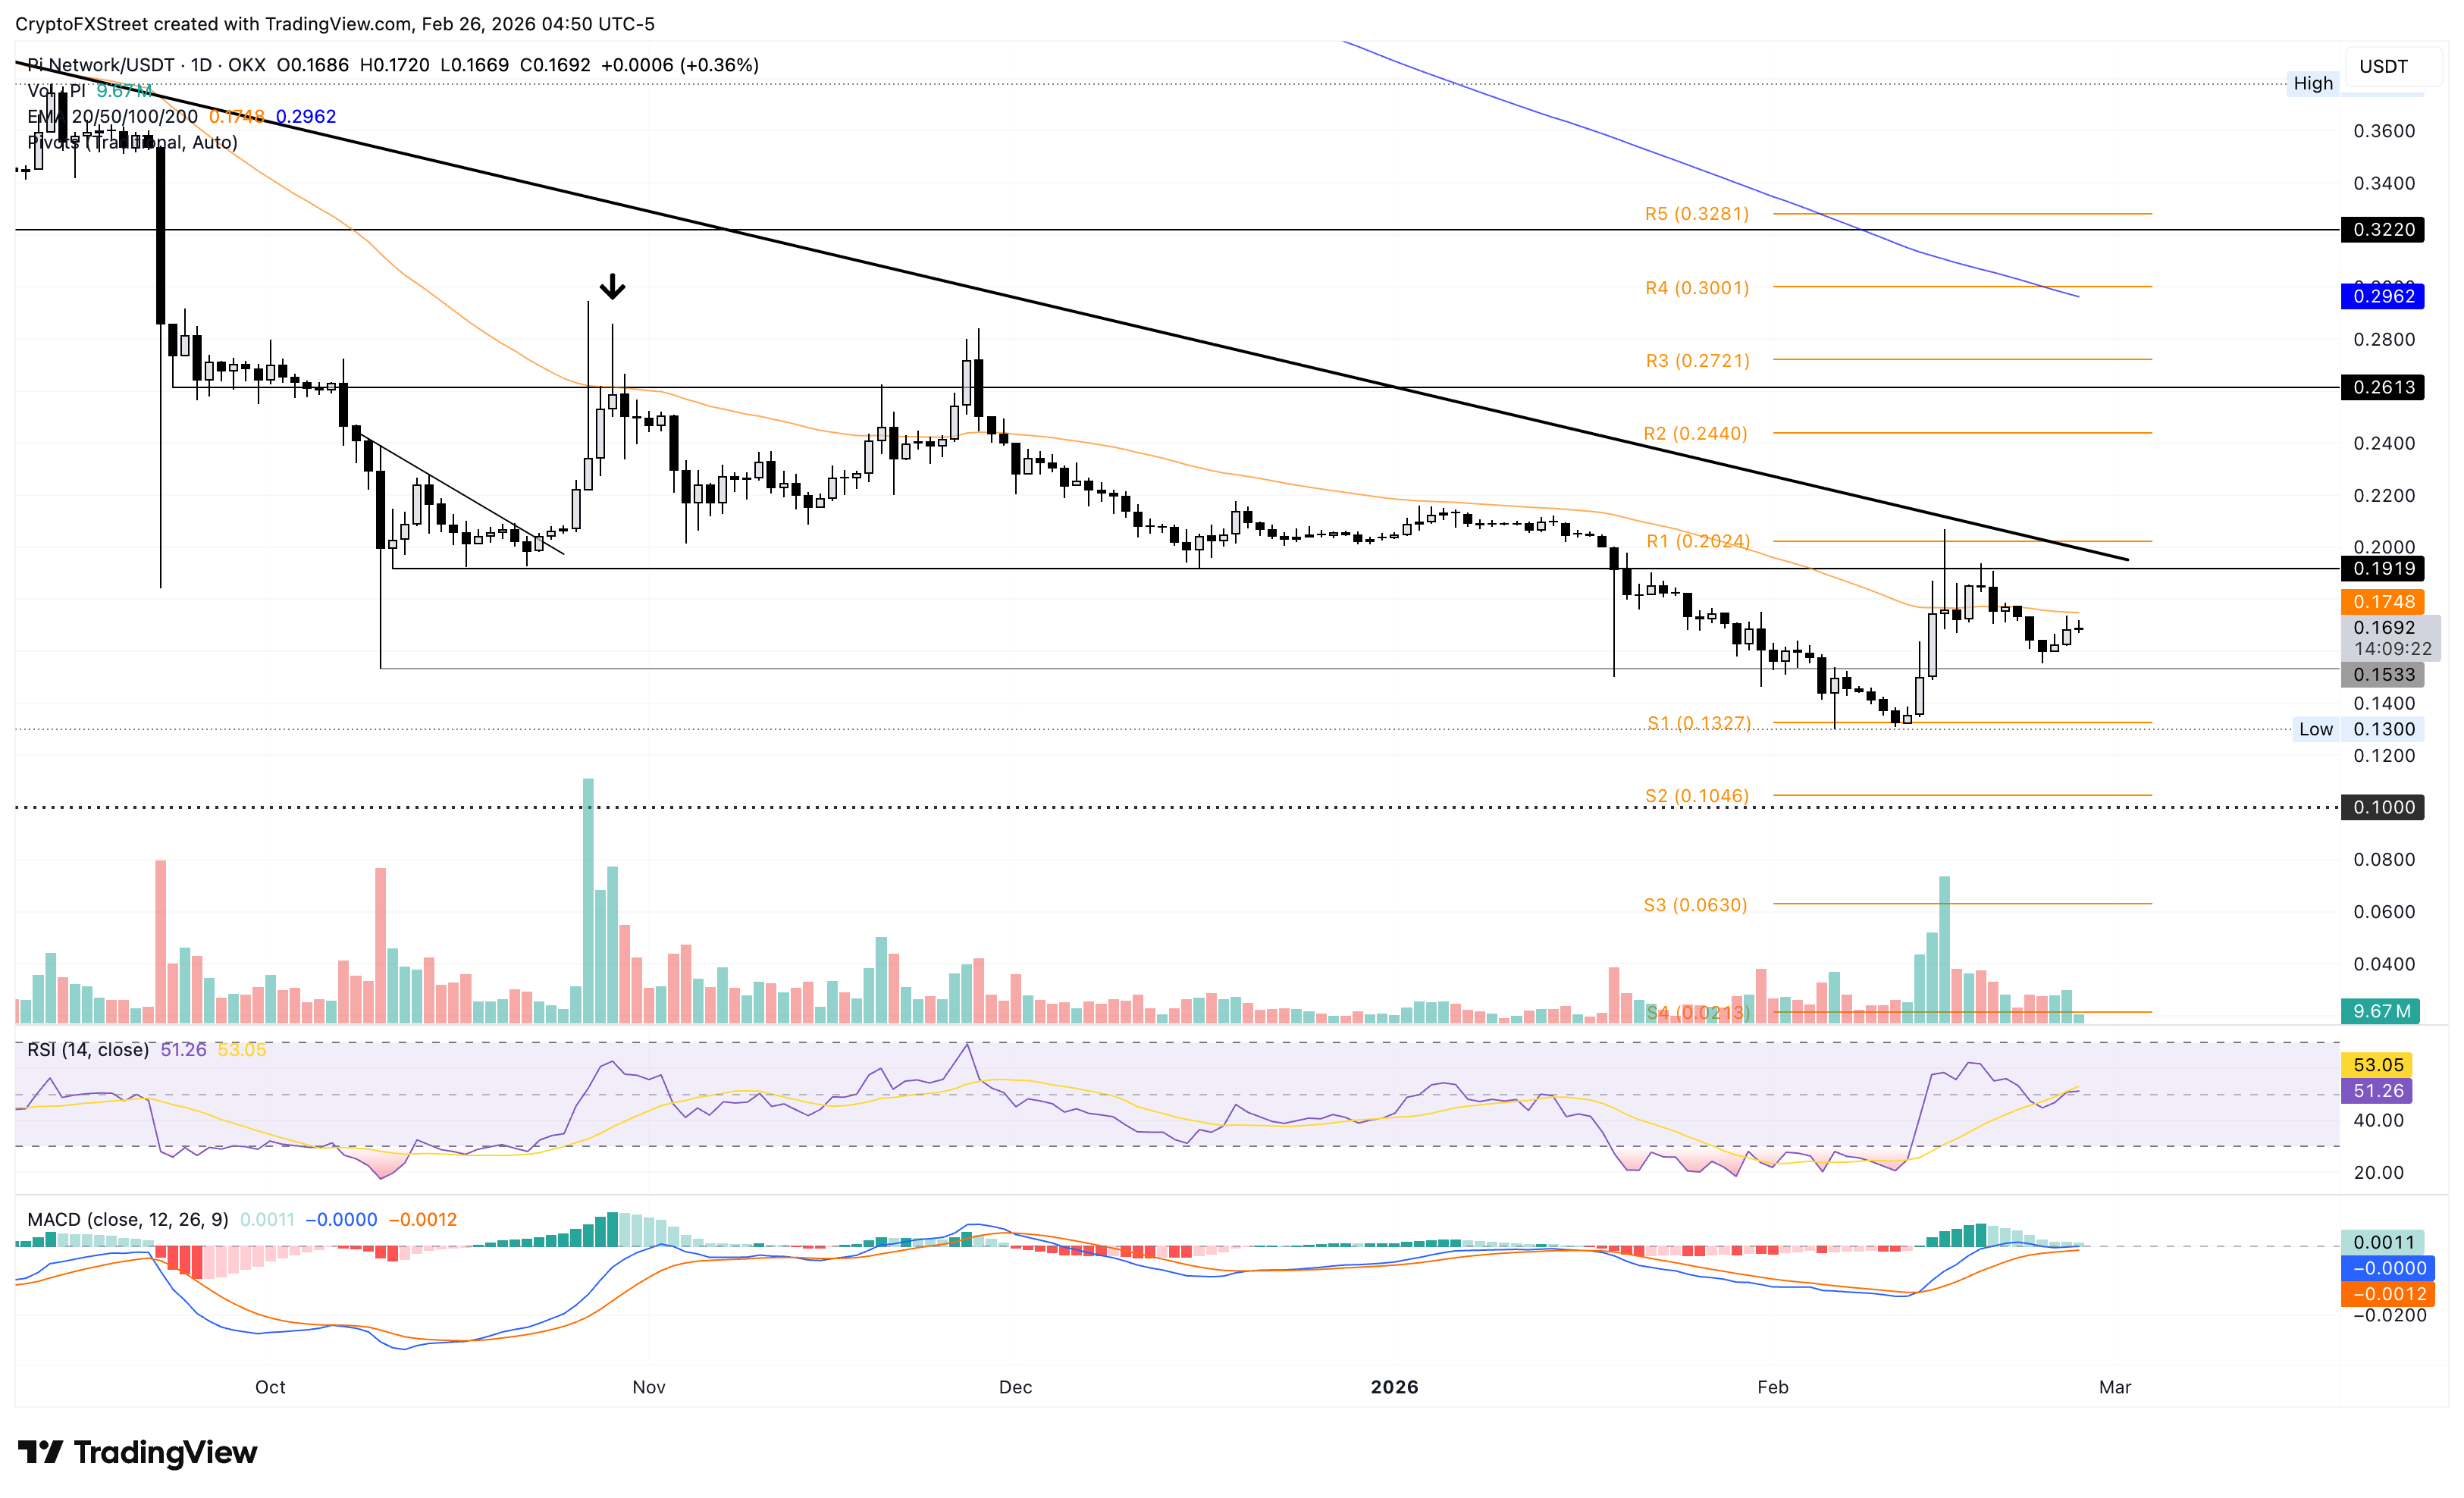
On the downside, immediate support is seen at the October 10 low of $0.1533, which protects the base level near at $0.1300, where buyers last regained control on February 6.
(The technical analysis of this story was written with the help of an AI tool.)

超过一百万用户依赖 FXStreet 获取实时市场数据、图表工具、专家洞见和外汇新闻。其全面的经济日历和教育网络研讨会帮助交易者保持信息领先、做出审慎决策。FXStreet 拥有约 60 人的团队,分布在巴塞罗那总部及全球各地区。
阅读更多


