
Pi Network Price Forecast: PI takes a downturn as broader market recovery stalls
作者 Vishal Dixit
更新: 18 Jun 2026


热门文章

Pi Network (PI) price is down to $0.1300 at press time on Thursday, extending its nearly 3% losses from the previous day. The PI token remains capped as the broader market recovery stalls amid recurring mild spikes in long liquidation.
- Pi Network edges lower on Thursday, extending its nearly 3% losses from the previous day.
- The stalling of the broader market recovery weighs on PI as risk-off sentiment lingers amid rising long liquidations.
- The technical outlook for PI is bearish, as the declining price could offset the bullish breakout of a broken trendline near $0.1300.
Pi Network (PI) price is down to $0.1300 at press time on Thursday, extending its nearly 3% losses from the previous day. The PI token remains capped as the broader market recovery stalls amid recurring mild spikes in long liquidation. The technical outlook for PI shifts bearish as the declining price could negate a previous bullish breakout from a descending trendline.
Broader market sentiment remains heavy
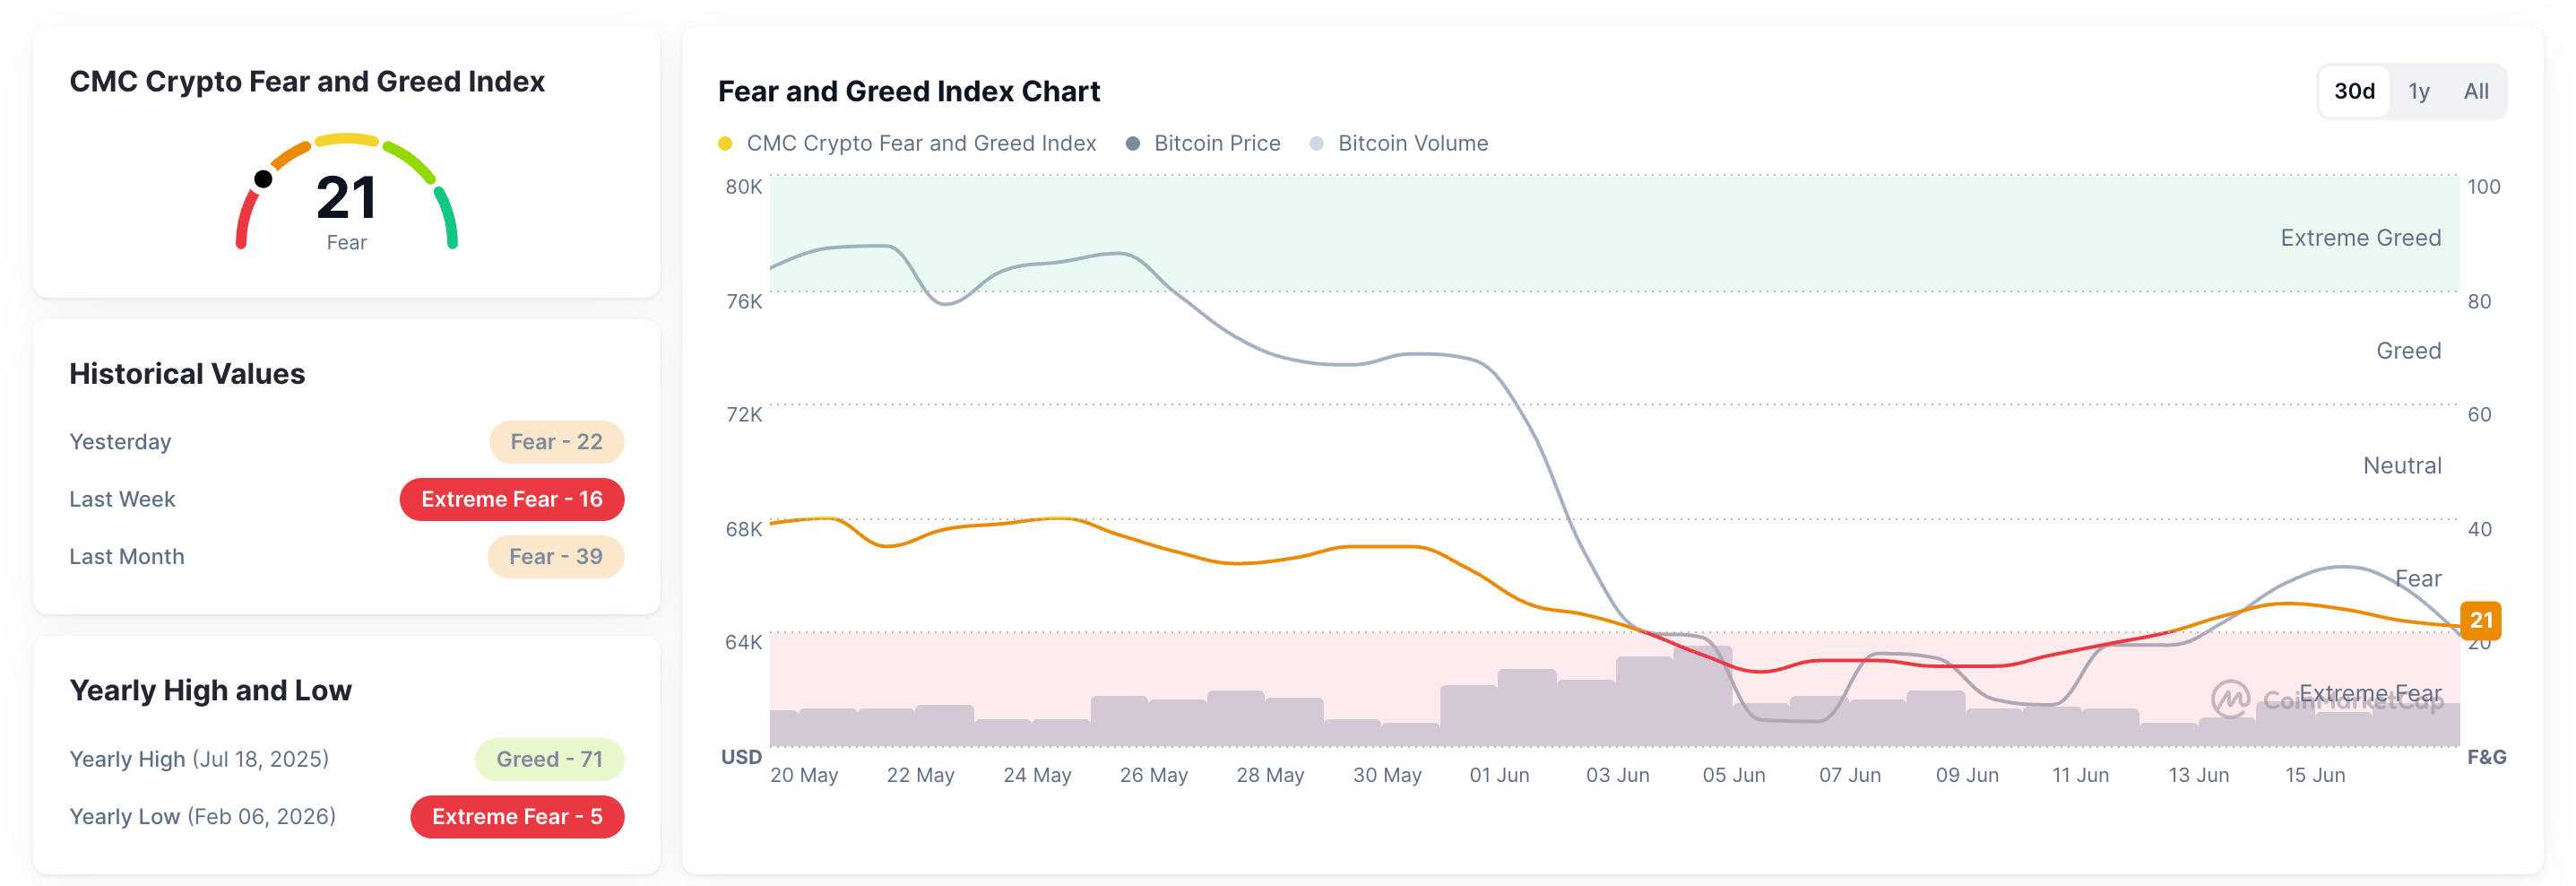
The broader market recovery stalls, with Bitcoin (BTC) back below $65,000 as the US Federal Reserve, under the new leadership of Kevin Warsh, leans toward a more hawkish stance. CoinMarketCap’s Fear and Greed Index is down to 21 on Thursday, down from 25 on Monday, and inching closer toward the Extreme Fear zone.
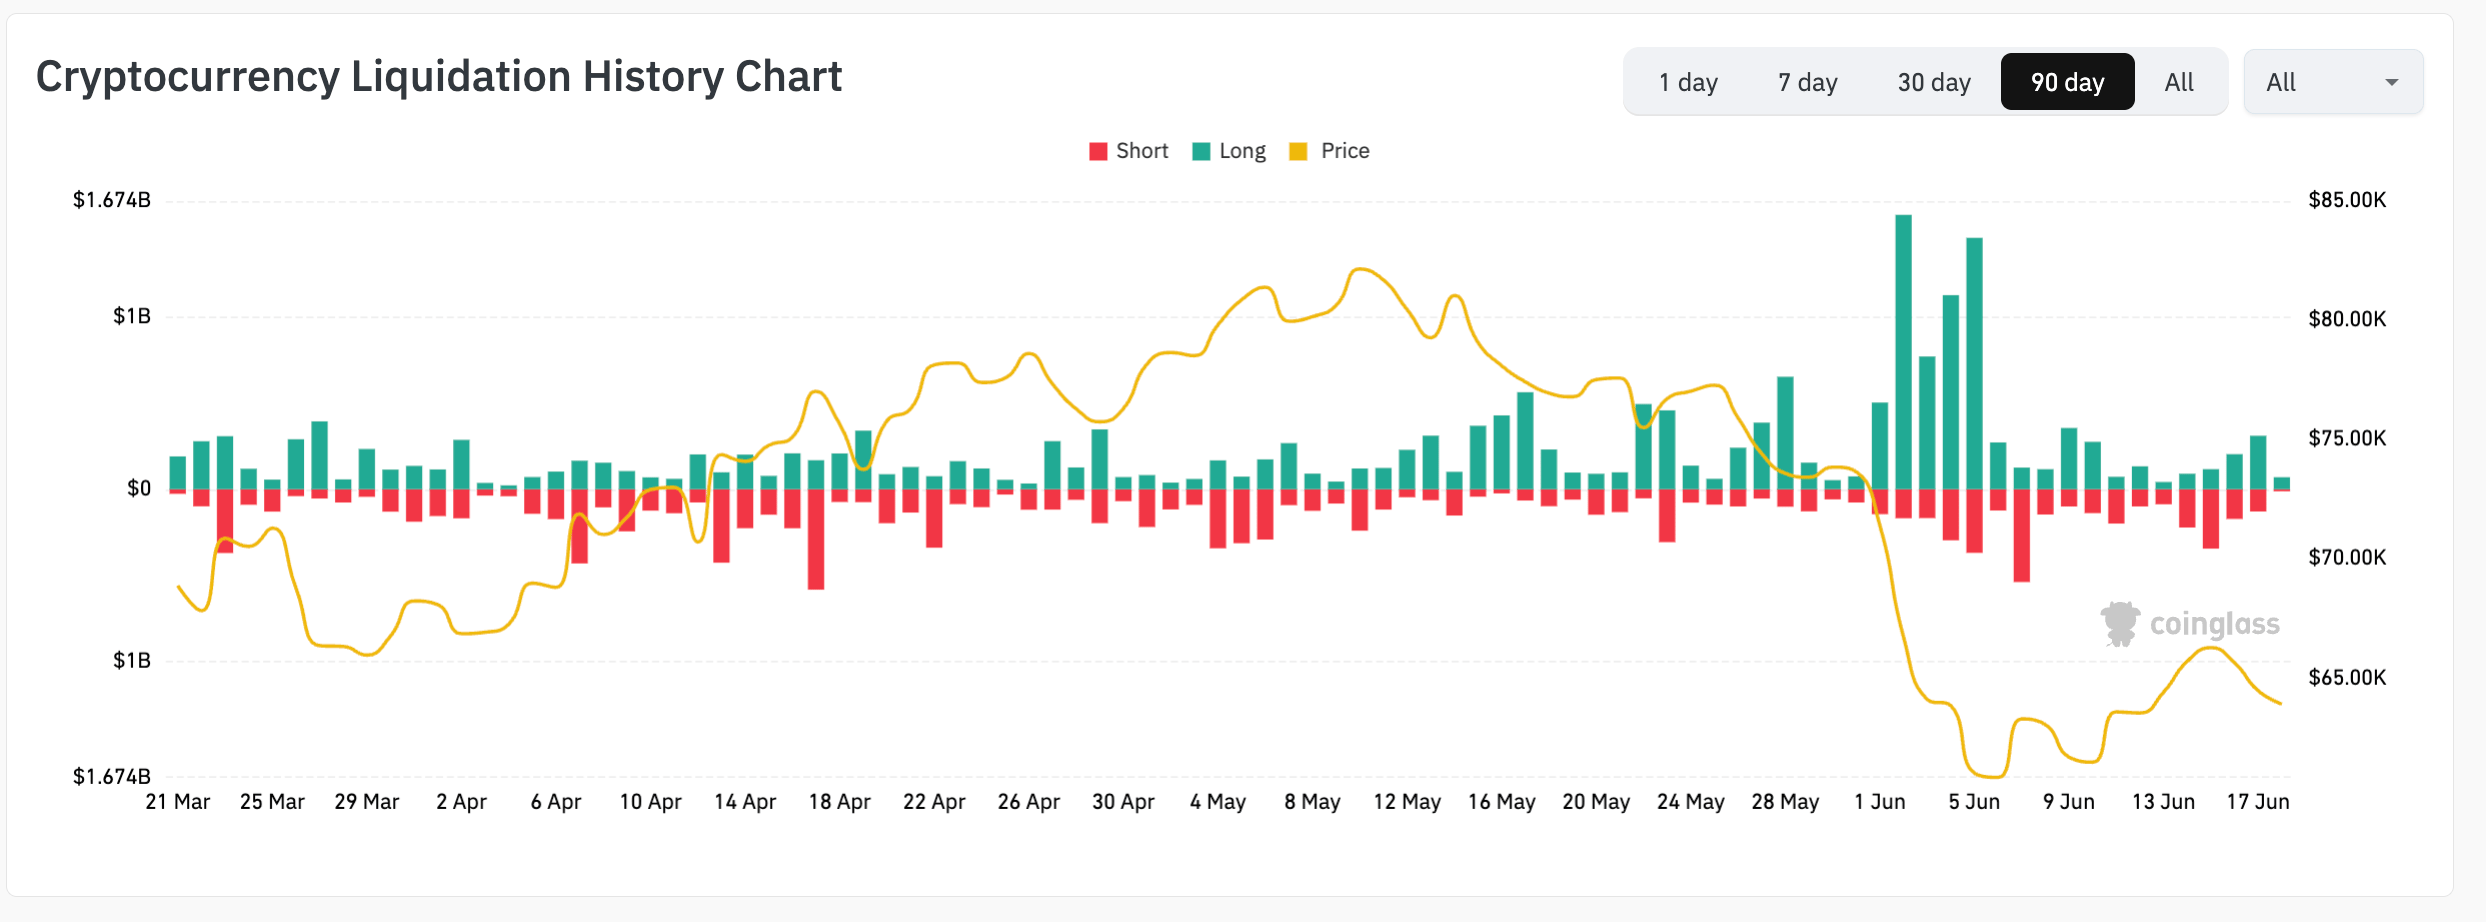
On the other hand, the mild but recurring spikes in long liquidations over the last week keep the short-term bias favorably bearish. CoinGlass data shows $311 million in long liquidations on Wednesday outpaced $129 million in short liquidations, confirming the bearish dominance.
Pi Network reverses to retest a key trendline as bears regain control
Pi Network edges lower at press time on Thursday, maintaining a broader declining trend. The short-term recovery from the June 6 low at $0.1184 briefly surpassed a key long-term descending trendline near $0.1300 that had previously capped multiple recovery attempts. However, the intraday pullback following the 3% loss the previous day warns of a steeper decline, which could offset the bullish breakout if the daily close is below $0.1300.
Consistent with the lack of bullish follow-through, the momentum on the daily chart remains neutral to bearish. The Moving Average Convergence Divergence (MACD) histogram contracts above the zero line as the average lines risk a bearish crossover, while the Relative Strength Index (RSI) near 40 remains below the midline, pointing to subdued demand rather than a sustained recovery.
Looking down, a slip below $0.1300 could open the path toward $0.1186, followed by the $0.1000 psychological threshold.
On the topside, initial resistance is seen at the 50-day Exponential Moving Average (EMA) near $0.1471 and the 100-day EMA around $0.1606.
(The technical analysis of this story was written with the help of an AI tool.)
Cryptocurrency metrics FAQs
The developer or creator of each cryptocurrency decides on the total number of tokens that can be minted or issued. Only a certain number of these assets can be minted by mining, staking or other mechanisms. This is defined by the algorithm of the underlying blockchain technology. On the other hand, circulating supply can also be decreased via actions such as burning tokens, or mistakenly sending assets to addresses of other incompatible blockchains.
Market capitalization is the result of multiplying the circulating supply of a certain asset by the asset’s current market value.
Trading volume refers to the total number of tokens for a specific asset that has been transacted or exchanged between buyers and sellers within set trading hours, for example, 24 hours. It is used to gauge market sentiment, this metric combines all volumes on centralized exchanges and decentralized exchanges. Increasing trading volume often denotes the demand for a certain asset as more people are buying and selling the cryptocurrency.
Funding rates are a concept designed to encourage traders to take positions and ensure perpetual contract prices match spot markets. It defines a mechanism by exchanges to ensure that future prices and index prices periodic payments regularly converge. When the funding rate is positive, the price of the perpetual contract is higher than the mark price. This means traders who are bullish and have opened long positions pay traders who are in short positions. On the other hand, a negative funding rate means perpetual prices are below the mark price, and hence traders with short positions pay traders who have opened long positions.

超过一百万用户依赖 FXStreet 获取实时市场数据、图表工具、专家洞见和外汇新闻。其全面的经济日历和教育网络研讨会帮助交易者保持信息领先、做出审慎决策。FXStreet 拥有约 60 人的团队,分布在巴塞罗那总部及全球各地区。
阅读更多


