
XRP hovers near $2.00 as ETF inflows advance
作者 John Isige
发布日期: 15 Dec 2025 | 修改日期: 15 Dec 2025


热门文章

Ripple (XRP) is holding ground slightly below $2.00 at the time of writing on Monday amid a generally bearish outlook across the broader cryptocurrency market.
- XRP holds ground, eyeing support at $2.00 as the crypto market widely recovers on Monday.
- XRP ETFs record 20 consecutive days of inflows, underscoring growing institutional appetite.
- Retail demand rises marginally, with the Open Interest averaging $3.72 billion.
Ripple (XRP) is holding ground slightly below $2.00 at the time of writing on Monday amid a generally bearish outlook across the broader cryptocurrency market. Steady institutional demand and a marginal increase in retail demand could boost momentum in the coming days, with XRP expected to edge up above the $2.00 pivotal level.
XRP ETFs extend inflows
US-listed XRP spot Exchange Traded Funds (ETFs) extended their 20-day inflow streak on Friday, with approximately $20 million deposited. Franklin Templeton’s XRPZ ETF led with $8.7 million in inflows, followed by Bitwise’s XRP with nearly $8 million and Canary Capital’s XRPC with $3.6 million.
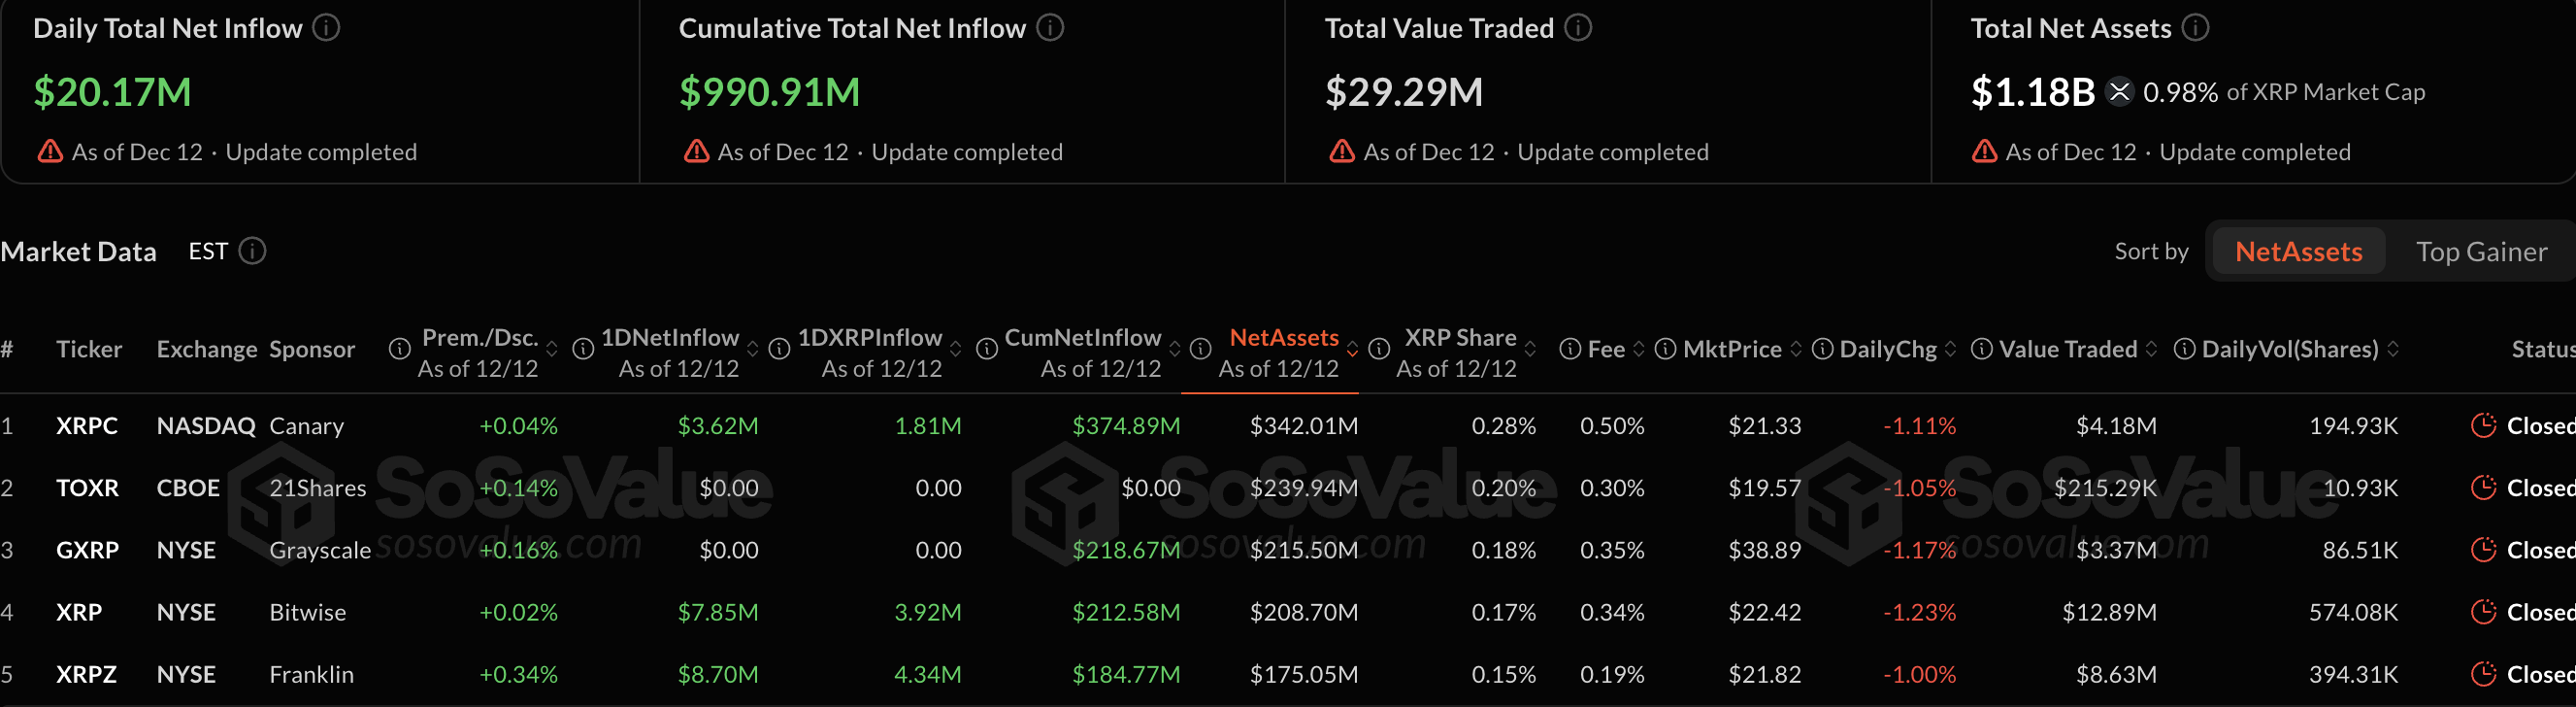
The cumulative inflow volume stands at $991 million, while net assets average $1.18 billion. A break above the $1 billion milestone in total inflows could boost interest in XRP-related investment products.

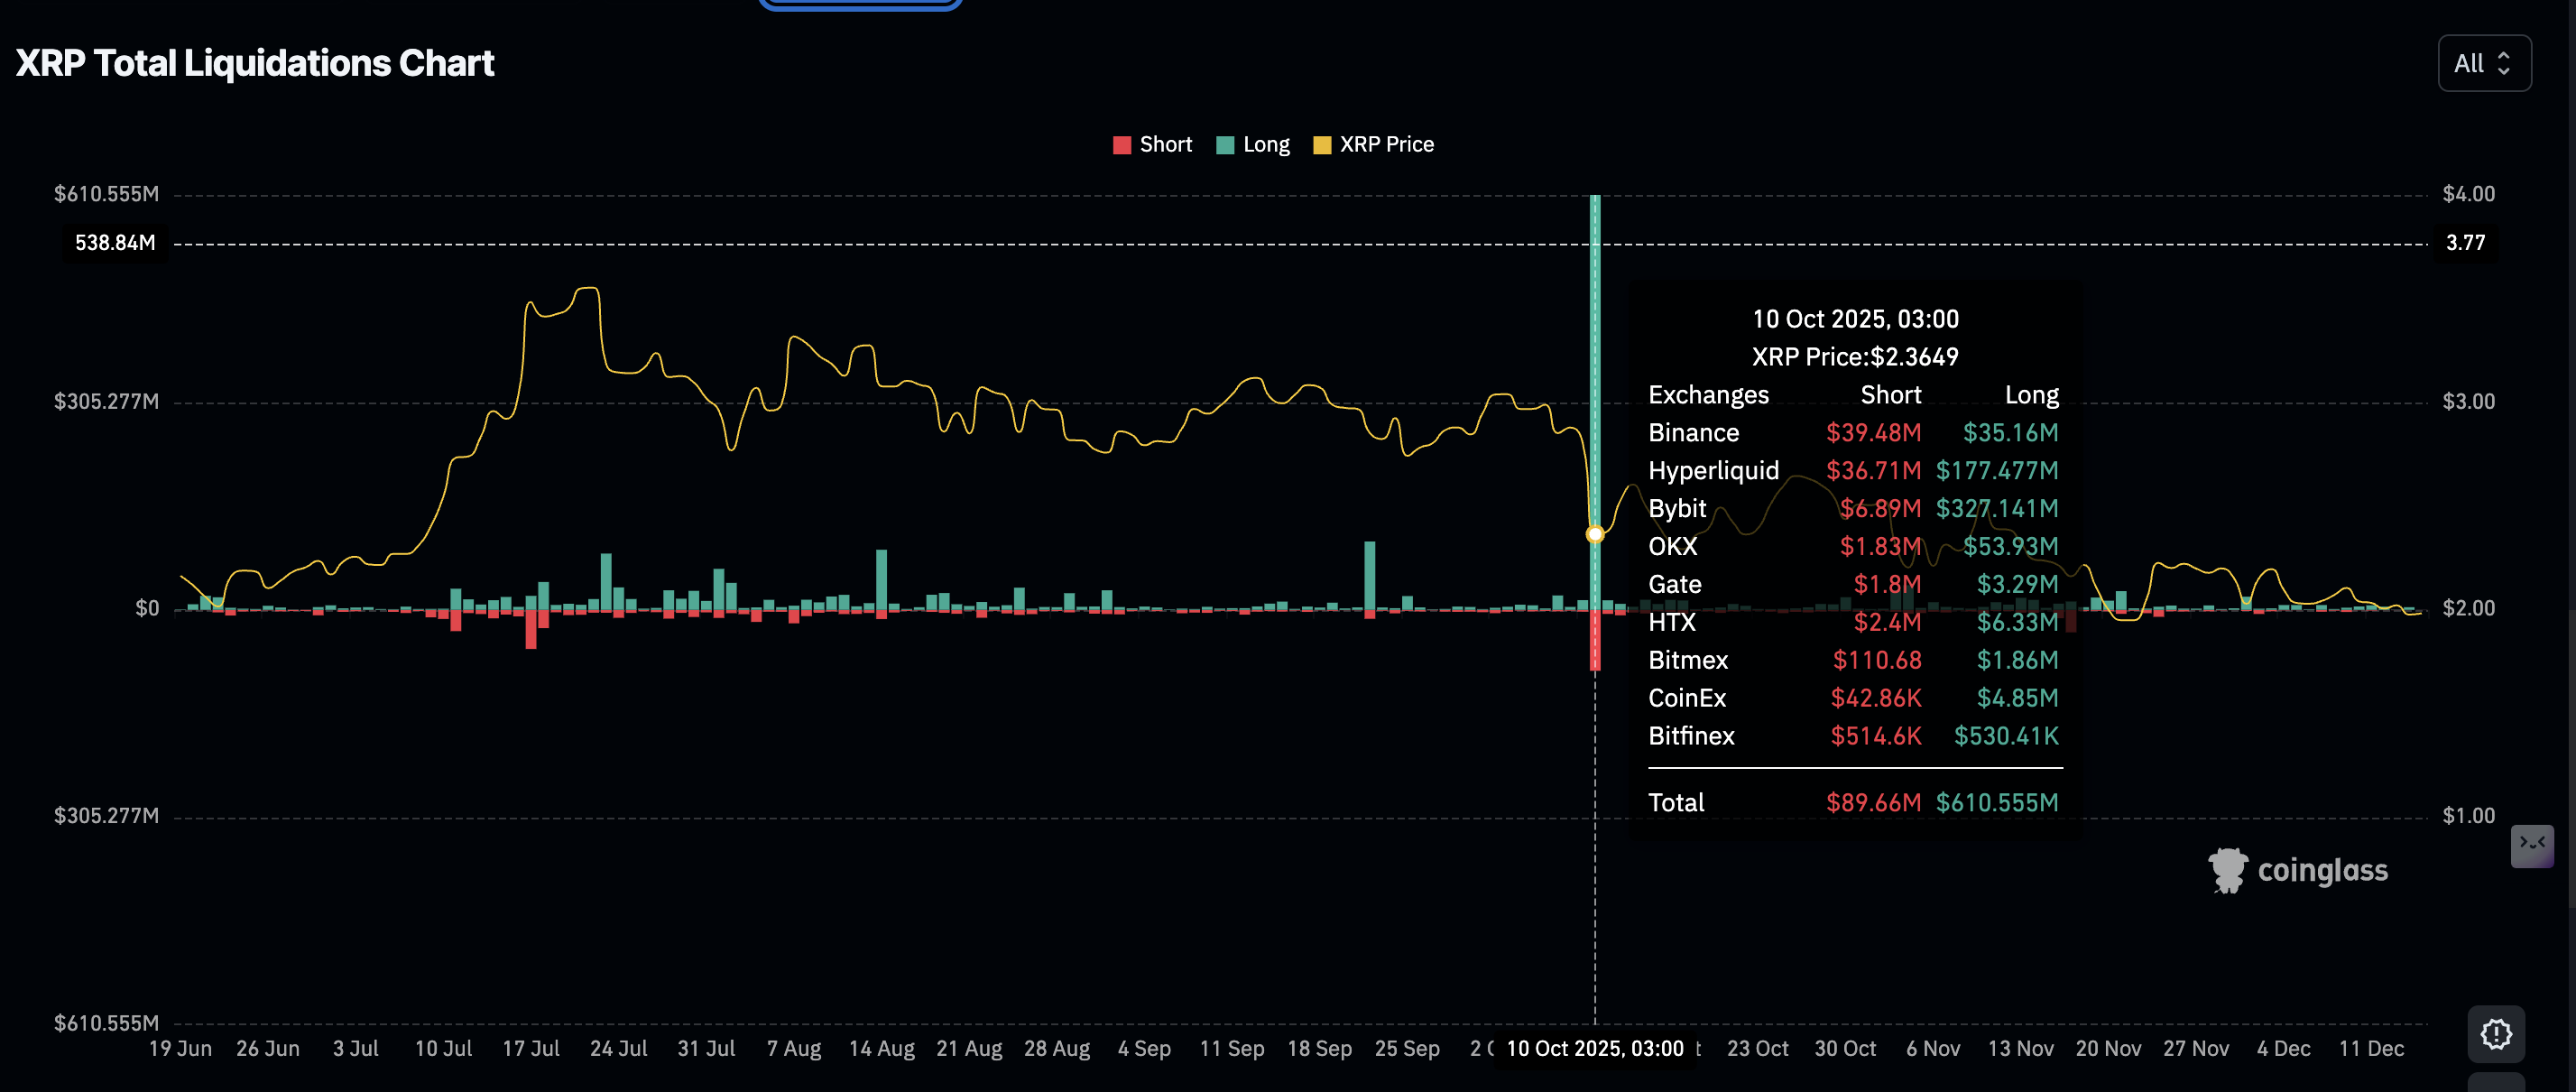
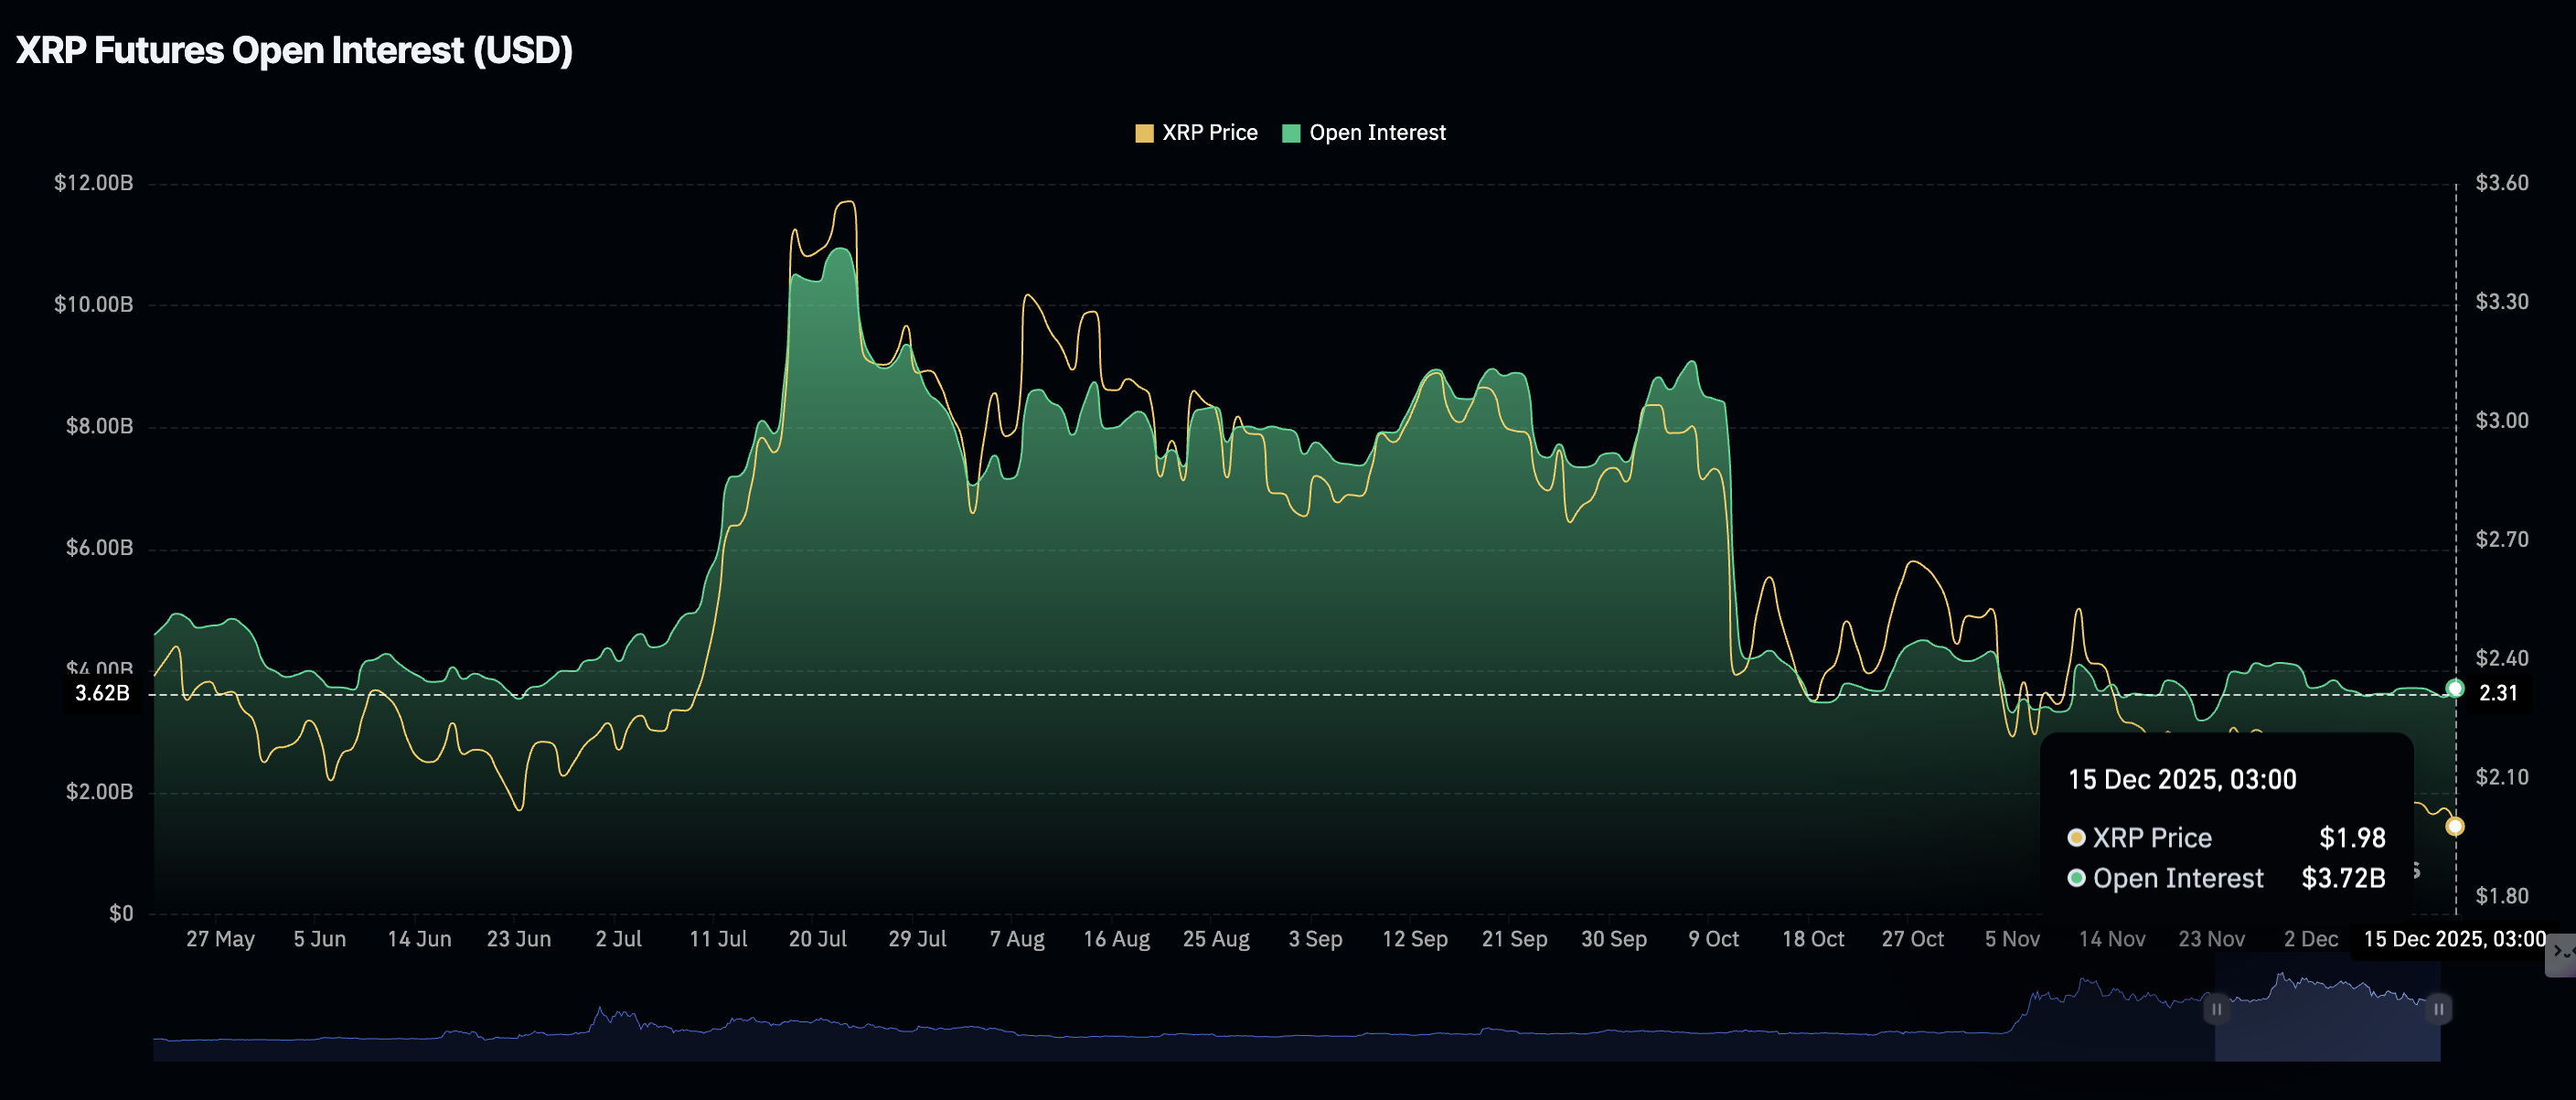
Despite XRP futures Open Interest (OI) rising marginally to $3.71 billion on Monday, from $3.57 billion the previous day, retail demand has not recovered to levels seen before the October 10 deleveraging event. The widespread crash liquidated over $19 billion in crypto assets, wiping out $610 million in XRP long positions and approximately $91 million in shorts.
Retail interest in XRP remains significantly low despite the futures OI, compared to the $10.94 billion peak on July 22, after XRP hit a new record high of $3.66 on July 18. A sustained recovery in OI is required to support price advance beyond the $2.00 key level.
Technical outlook: Can XRP extend short-term recovery?
XRP is hovering at $1.98 and below the down-trending 50-day Exponential Moving Average (EMA), the 100-day EMA and 200-day EMA, keeping the bias generally bearish. The Moving Average Convergence Divergence (MACD) line (blue) on the daily chart sits below the signal line (red), backing the bearish thesis. Moreover, histogram bars have turned marginally negative under the mean line, which suggests fading upside momentum.
The Relative Strength Index (RSI) on the same chart holds at 40 in the bearish region, indicating rebounds may fail to gain momentum in the short-term.
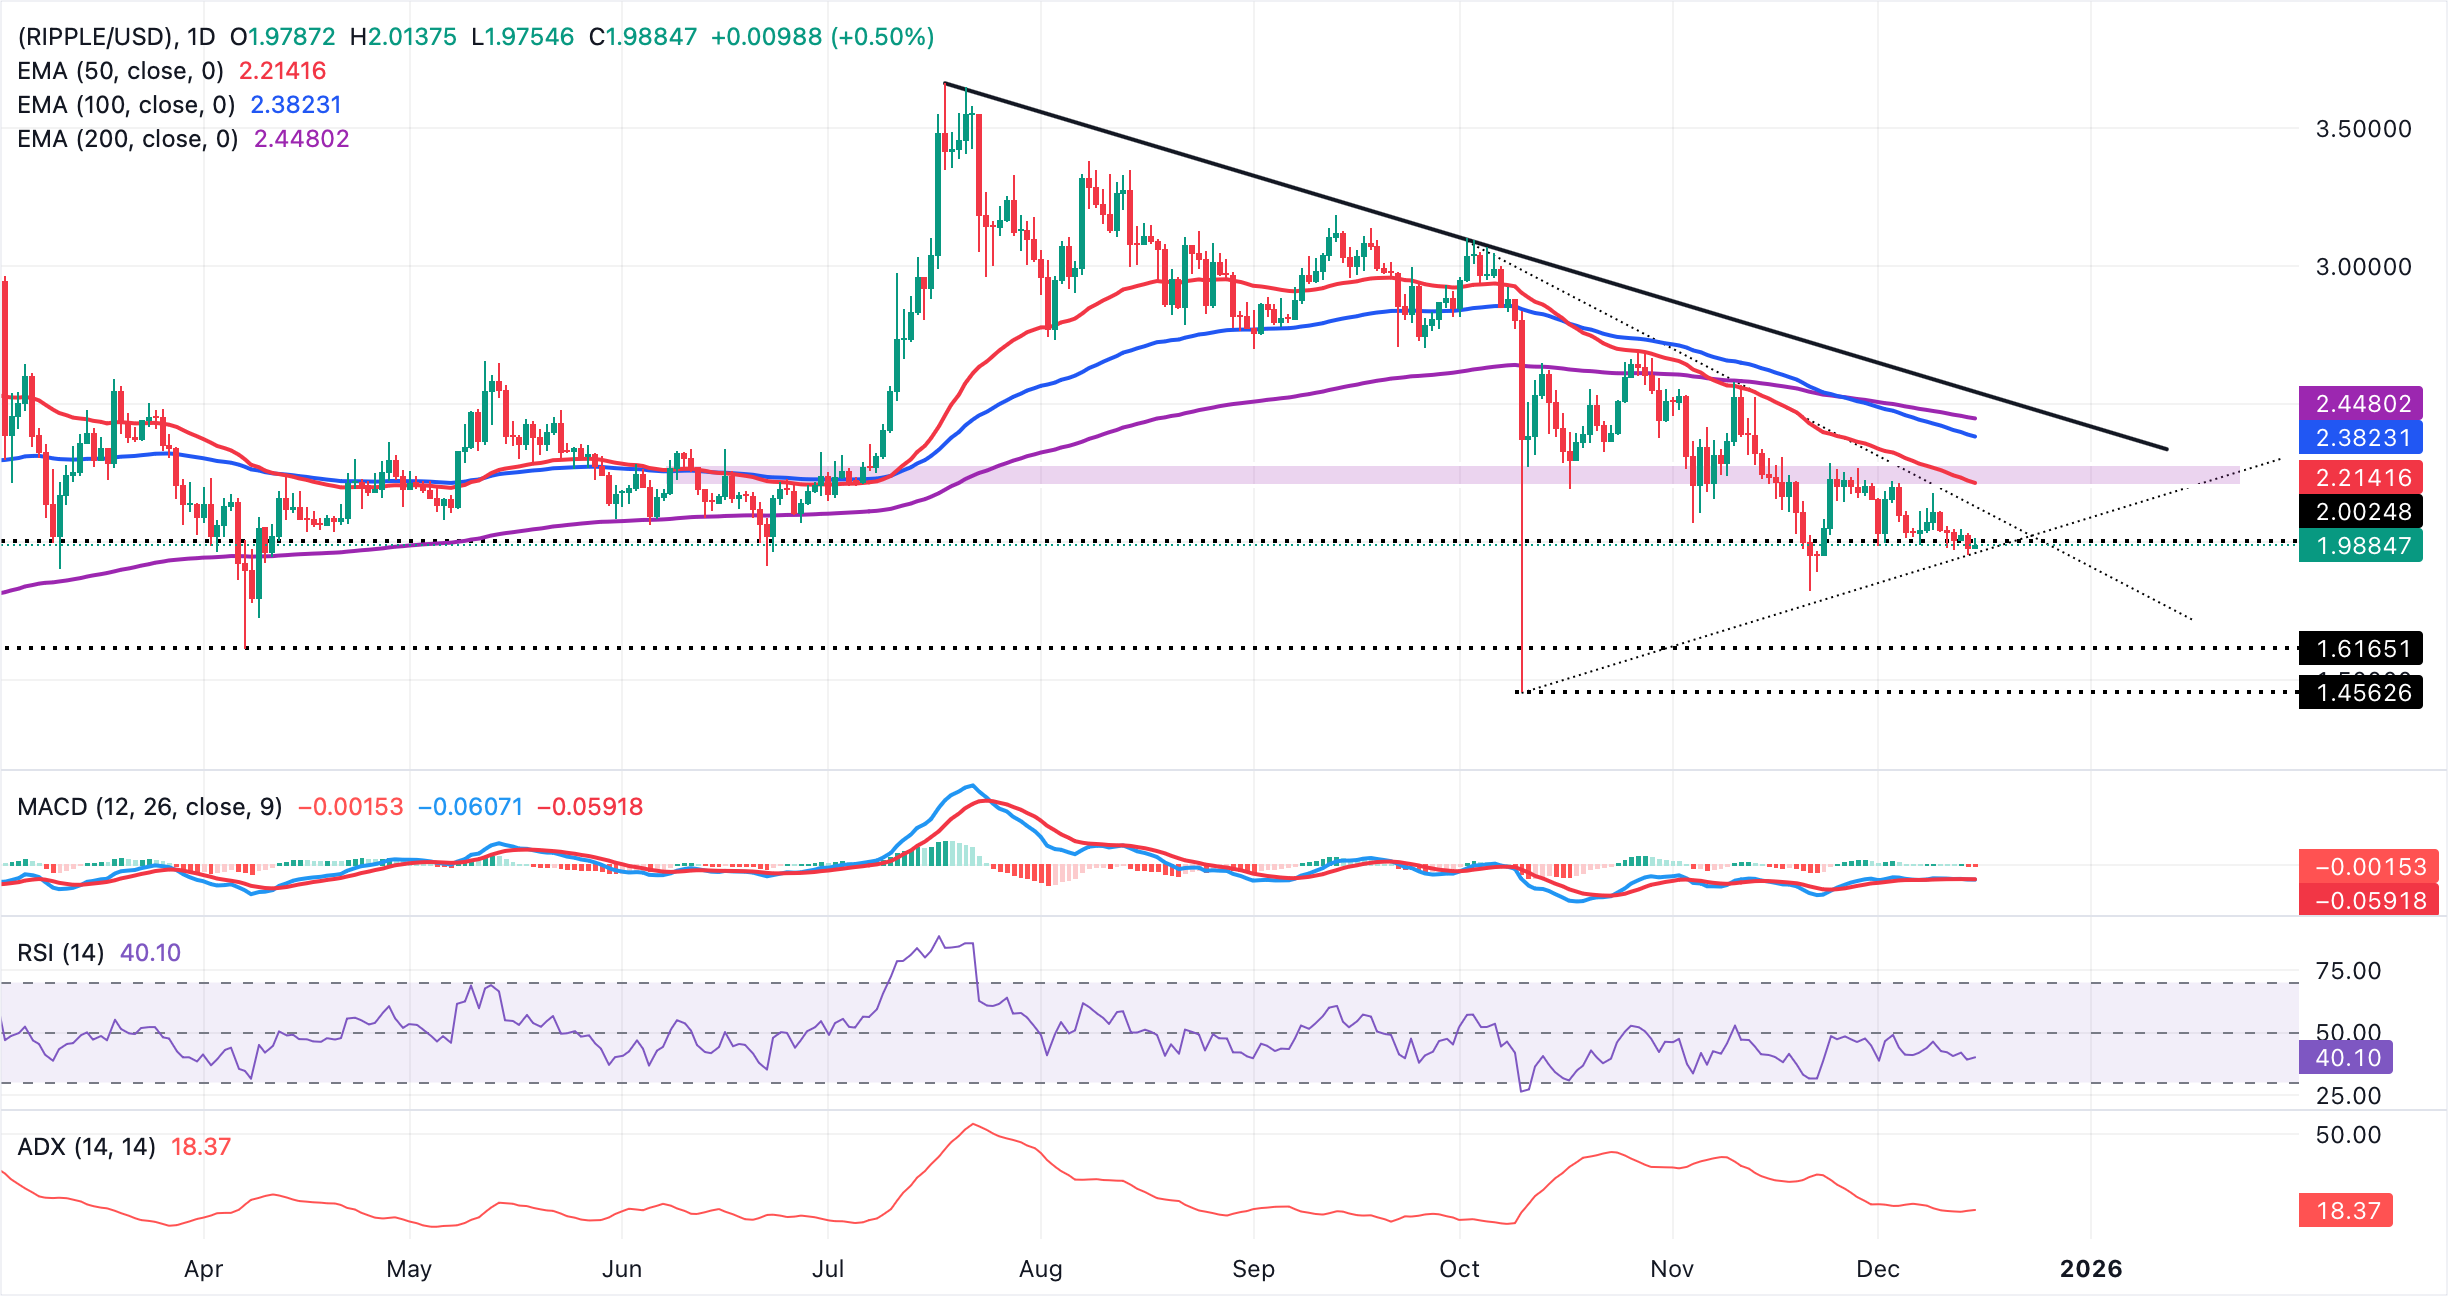
A descending trendline from the record high of $3.66 limits XRP's upside, with resistance seen near $2.54. An accelerated descending trendline from $3.09 restricts gains below $2.12. Meanwhile, the rising trendline from $1.45 underpins a developing bullish bias, offering support near $1.96.
A close above the 50-day Exponential Moving Average (EMA) at $2.21 could ease bearish pressure and pave the way for an upswing toward the next trendline cap at $2.54. Still, a close below $2.00 would reassert sellers and increase the chances of the decline extending to November's low of $1.82.
Cryptocurrency metrics FAQs
The developer or creator of each cryptocurrency decides on the total number of tokens that can be minted or issued. Only a certain number of these assets can be minted by mining, staking or other mechanisms. This is defined by the algorithm of the underlying blockchain technology. On the other hand, circulating supply can also be decreased via actions such as burning tokens, or mistakenly sending assets to addresses of other incompatible blockchains.
Market capitalization is the result of multiplying the circulating supply of a certain asset by the asset’s current market value.
Trading volume refers to the total number of tokens for a specific asset that has been transacted or exchanged between buyers and sellers within set trading hours, for example, 24 hours. It is used to gauge market sentiment, this metric combines all volumes on centralized exchanges and decentralized exchanges. Increasing trading volume often denotes the demand for a certain asset as more people are buying and selling the cryptocurrency.
Funding rates are a concept designed to encourage traders to take positions and ensure perpetual contract prices match spot markets. It defines a mechanism by exchanges to ensure that future prices and index prices periodic payments regularly converge. When the funding rate is positive, the price of the perpetual contract is higher than the mark price. This means traders who are bullish and have opened long positions pay traders who are in short positions. On the other hand, a negative funding rate means perpetual prices are below the mark price, and hence traders with short positions pay traders who have opened long positions.
(The technical analysis of this story was written with the help of an AI tool)

超过一百万用户依赖 FXStreet 获取实时市场数据、图表工具、专家洞见和外汇新闻。其全面的经济日历和教育网络研讨会帮助交易者保持信息领先、做出审慎决策。FXStreet 拥有约 60 人的团队,分布在巴塞罗那总部及全球各地区。
阅读更多


