
XRP trades below major EMAs as ETF inflows, futures Open Interest stabilize
作者 John Isige
发布日期: 10 Feb 2026 | 修改日期: 10 Feb 2026


热门文章

Ripple (XRP) trades under pressure, with immediate support at $1.40 holding at the time of writing on Tuesday. A recovery attempt from last week’s sell-off to $1.12 stalled at $1.54 on Friday, leading to limited price action between the current support and the resistance.
- XRP pushes toward $1.40 immediate support, trading well below the 50-, 100-, and 200-day EMAs.
- XRP posts steady inflows into spot ETFs, signalling a potential shift toward risk-on sentiment.
- The XRP derivatives market remains weak, but futures Open Interest stabilizes at $2.5 billion.
Ripple (XRP) trades under pressure, with immediate support at $1.40 holding at the time of writing on Tuesday. A recovery attempt from last week’s sell-off to $1.12 stalled at $1.54 on Friday, leading to limited price action between the current support and the resistance.
Despite support at $1.52, XRP is down over 1.5% intraday. On the upside, institutional investors continue to lean into risk while the retail market exhibits potential stability.
XRP ETFs post modest inflows
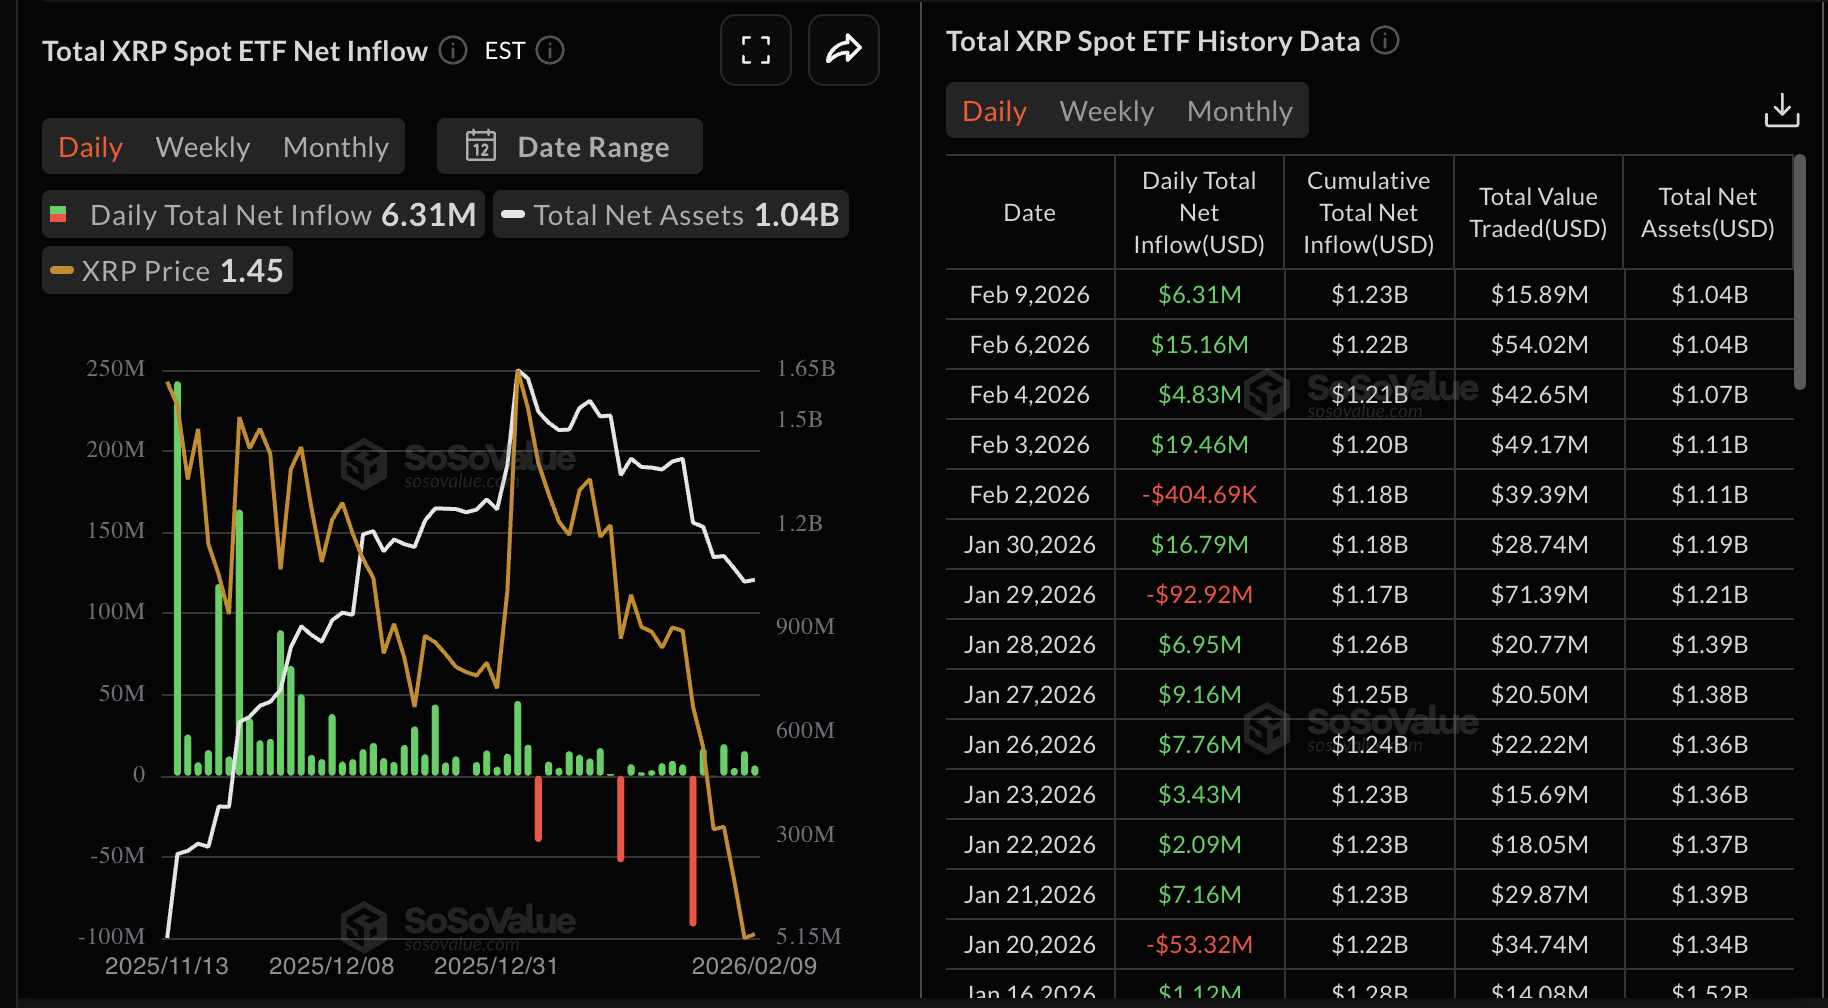
Inflows into US-listed XRP spot ETFs totaled $6.3 million on Monday, bringing the cumulative inflow to $1.23 billion, and net assets under management to $1.04 billion. Institutional investors have continued to lean into XRP ETFs, marking four consecutive days of inflows.
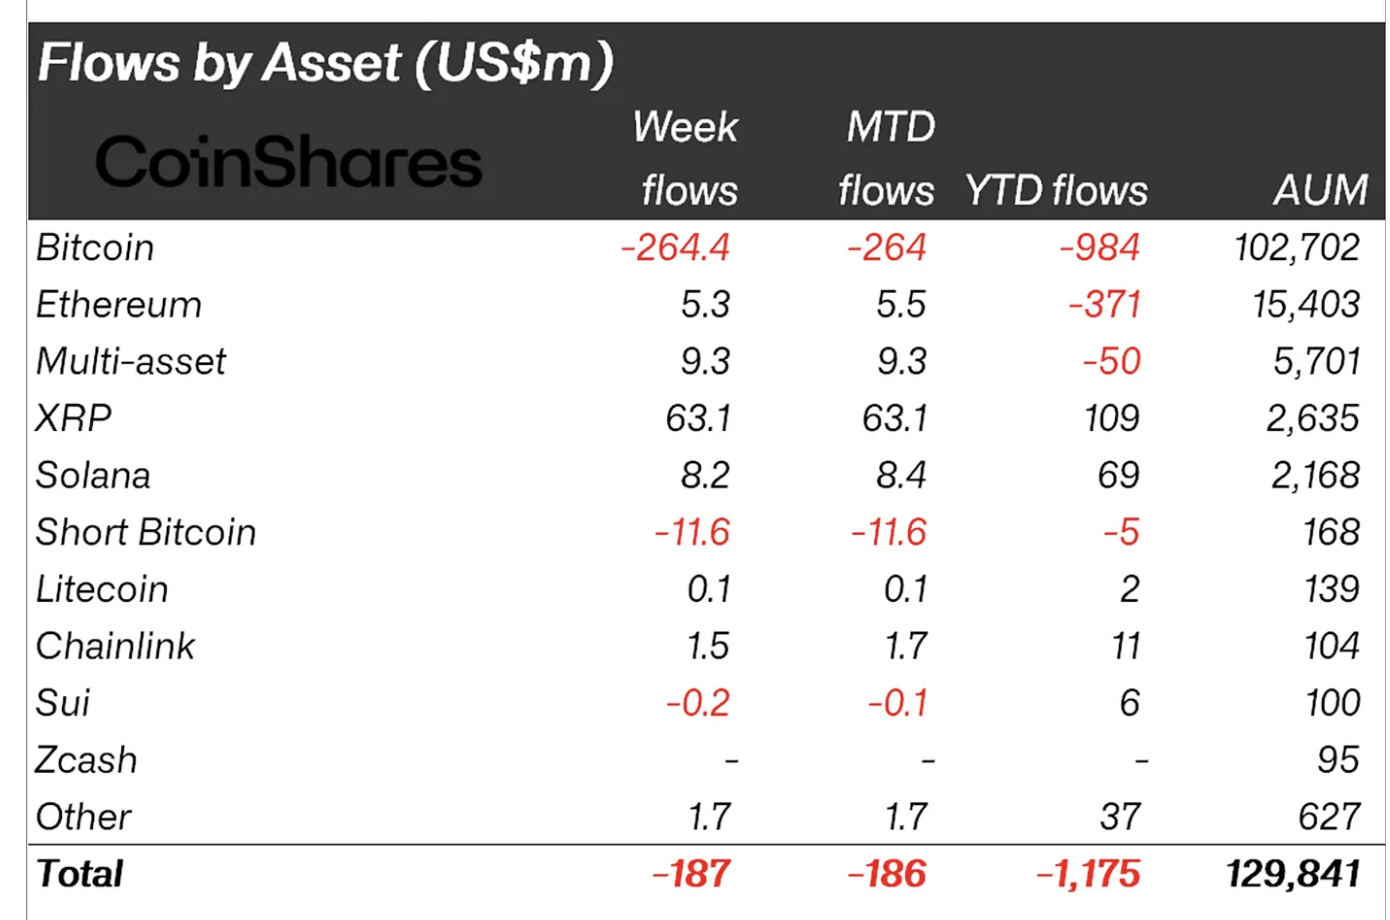
lat week, XRP ETFs accumulated $39 million in total inflows through Friday. As reported, total inflows into XRP-related investment products averaged $63.1 million last week. The cumulative assets under management stand at $2.6 billion as of Friday, according to CoinShares.
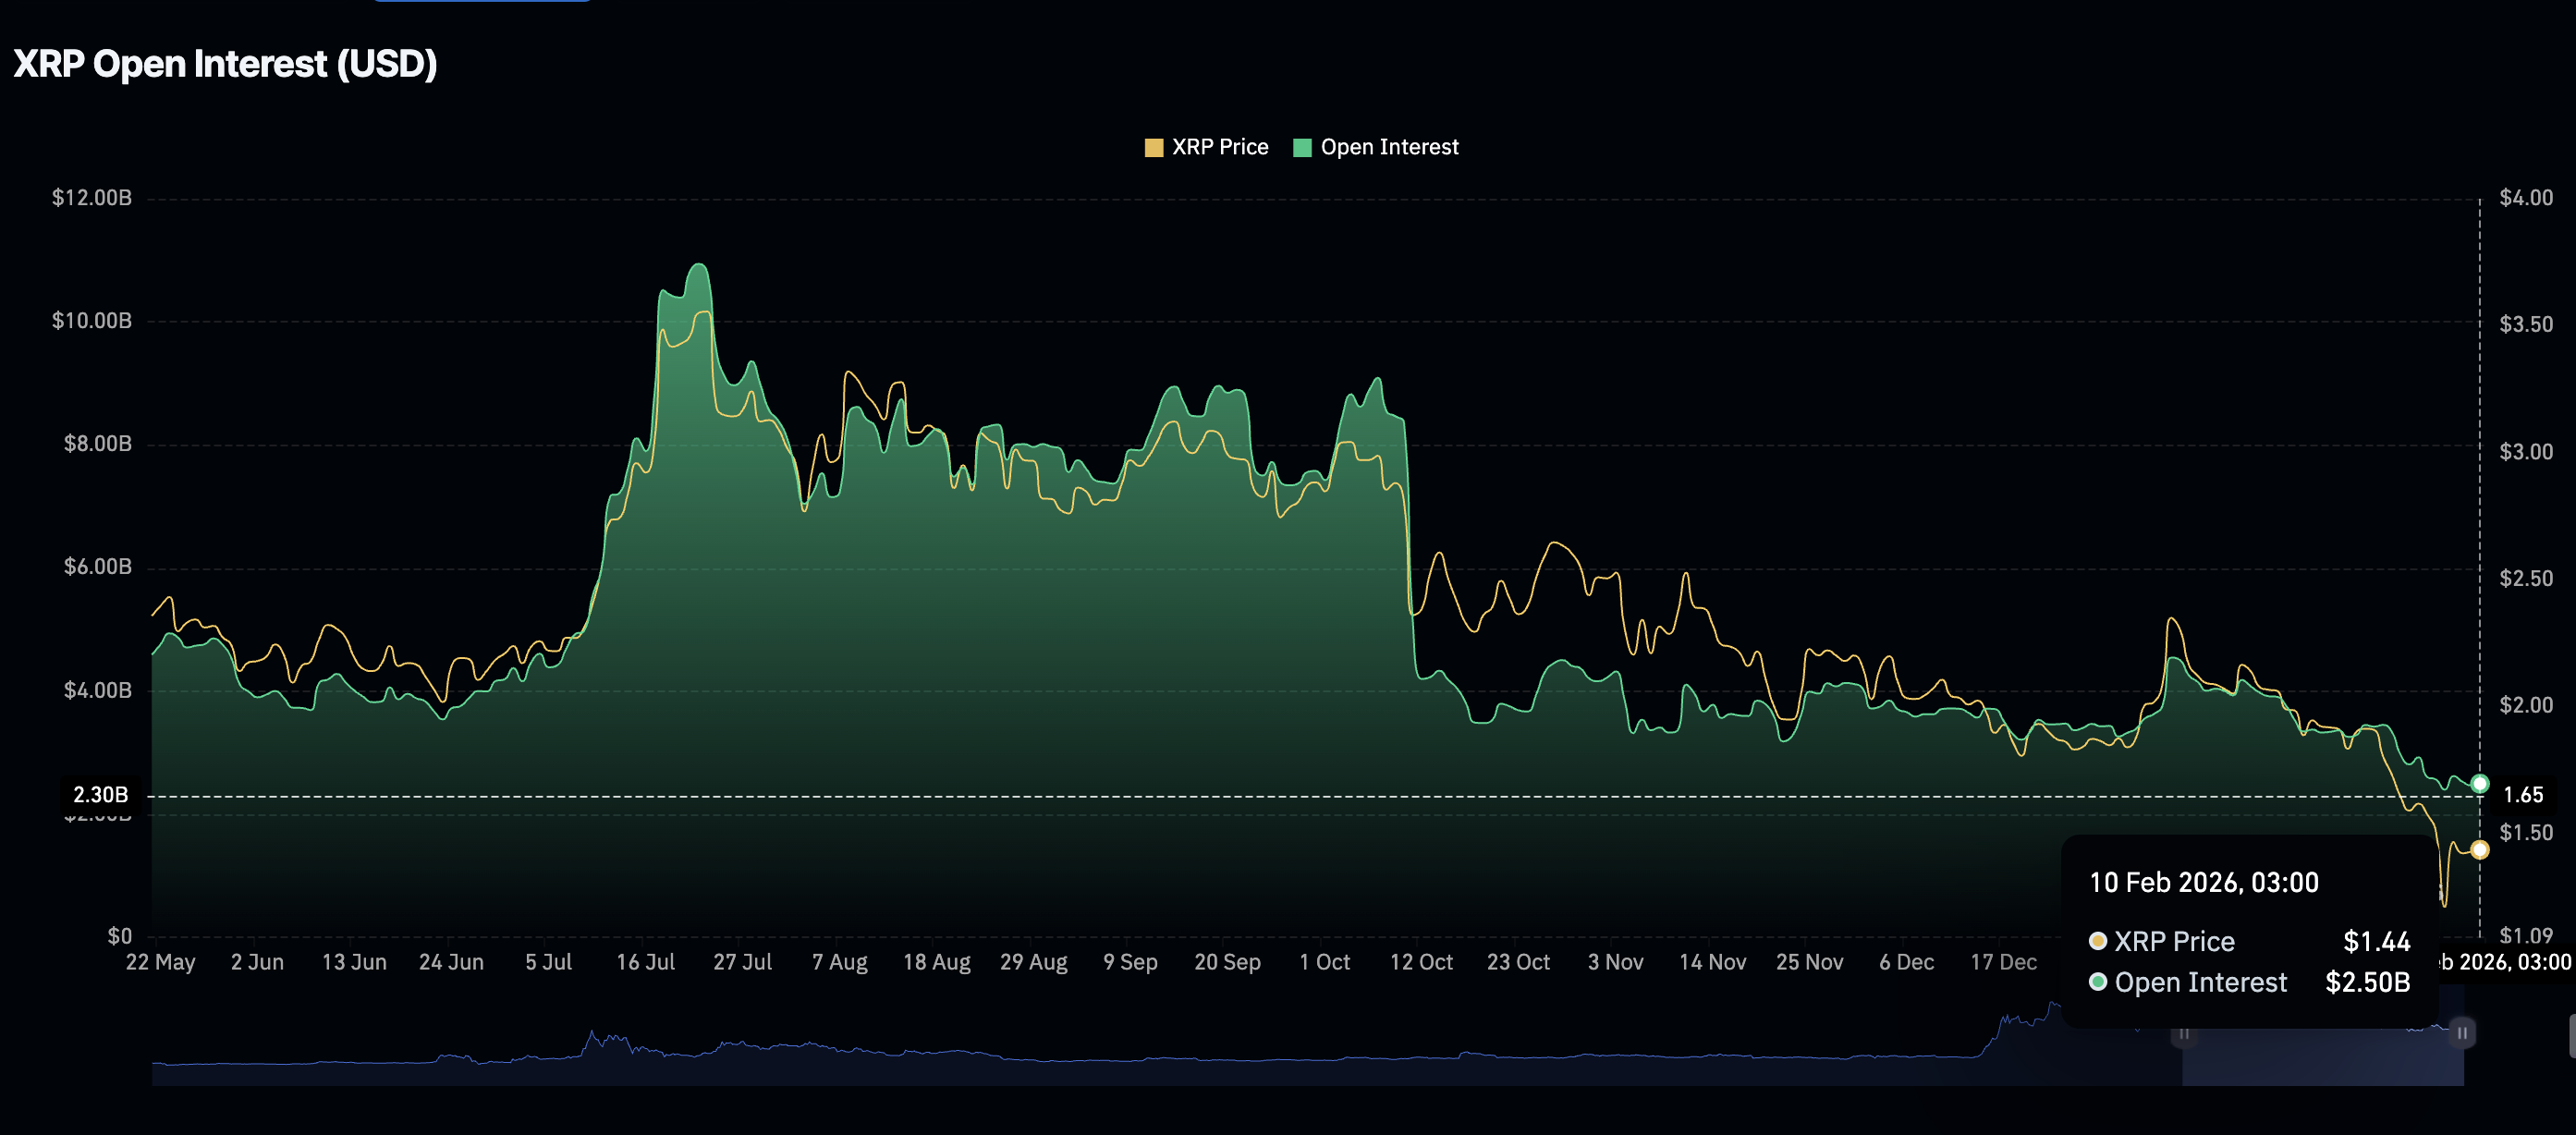
Meanwhile, the XRP derivatives market remains weak, as reflected in futures Open Interest (OI), which stabilised at $2.50 billion on Tuesday, up from $2.47 billion the previous day. Stability in the derivatives market suggests that traders are holding onto their open positions, while a steady increase would support a bullish outlook in XRP as investors lean into risk.
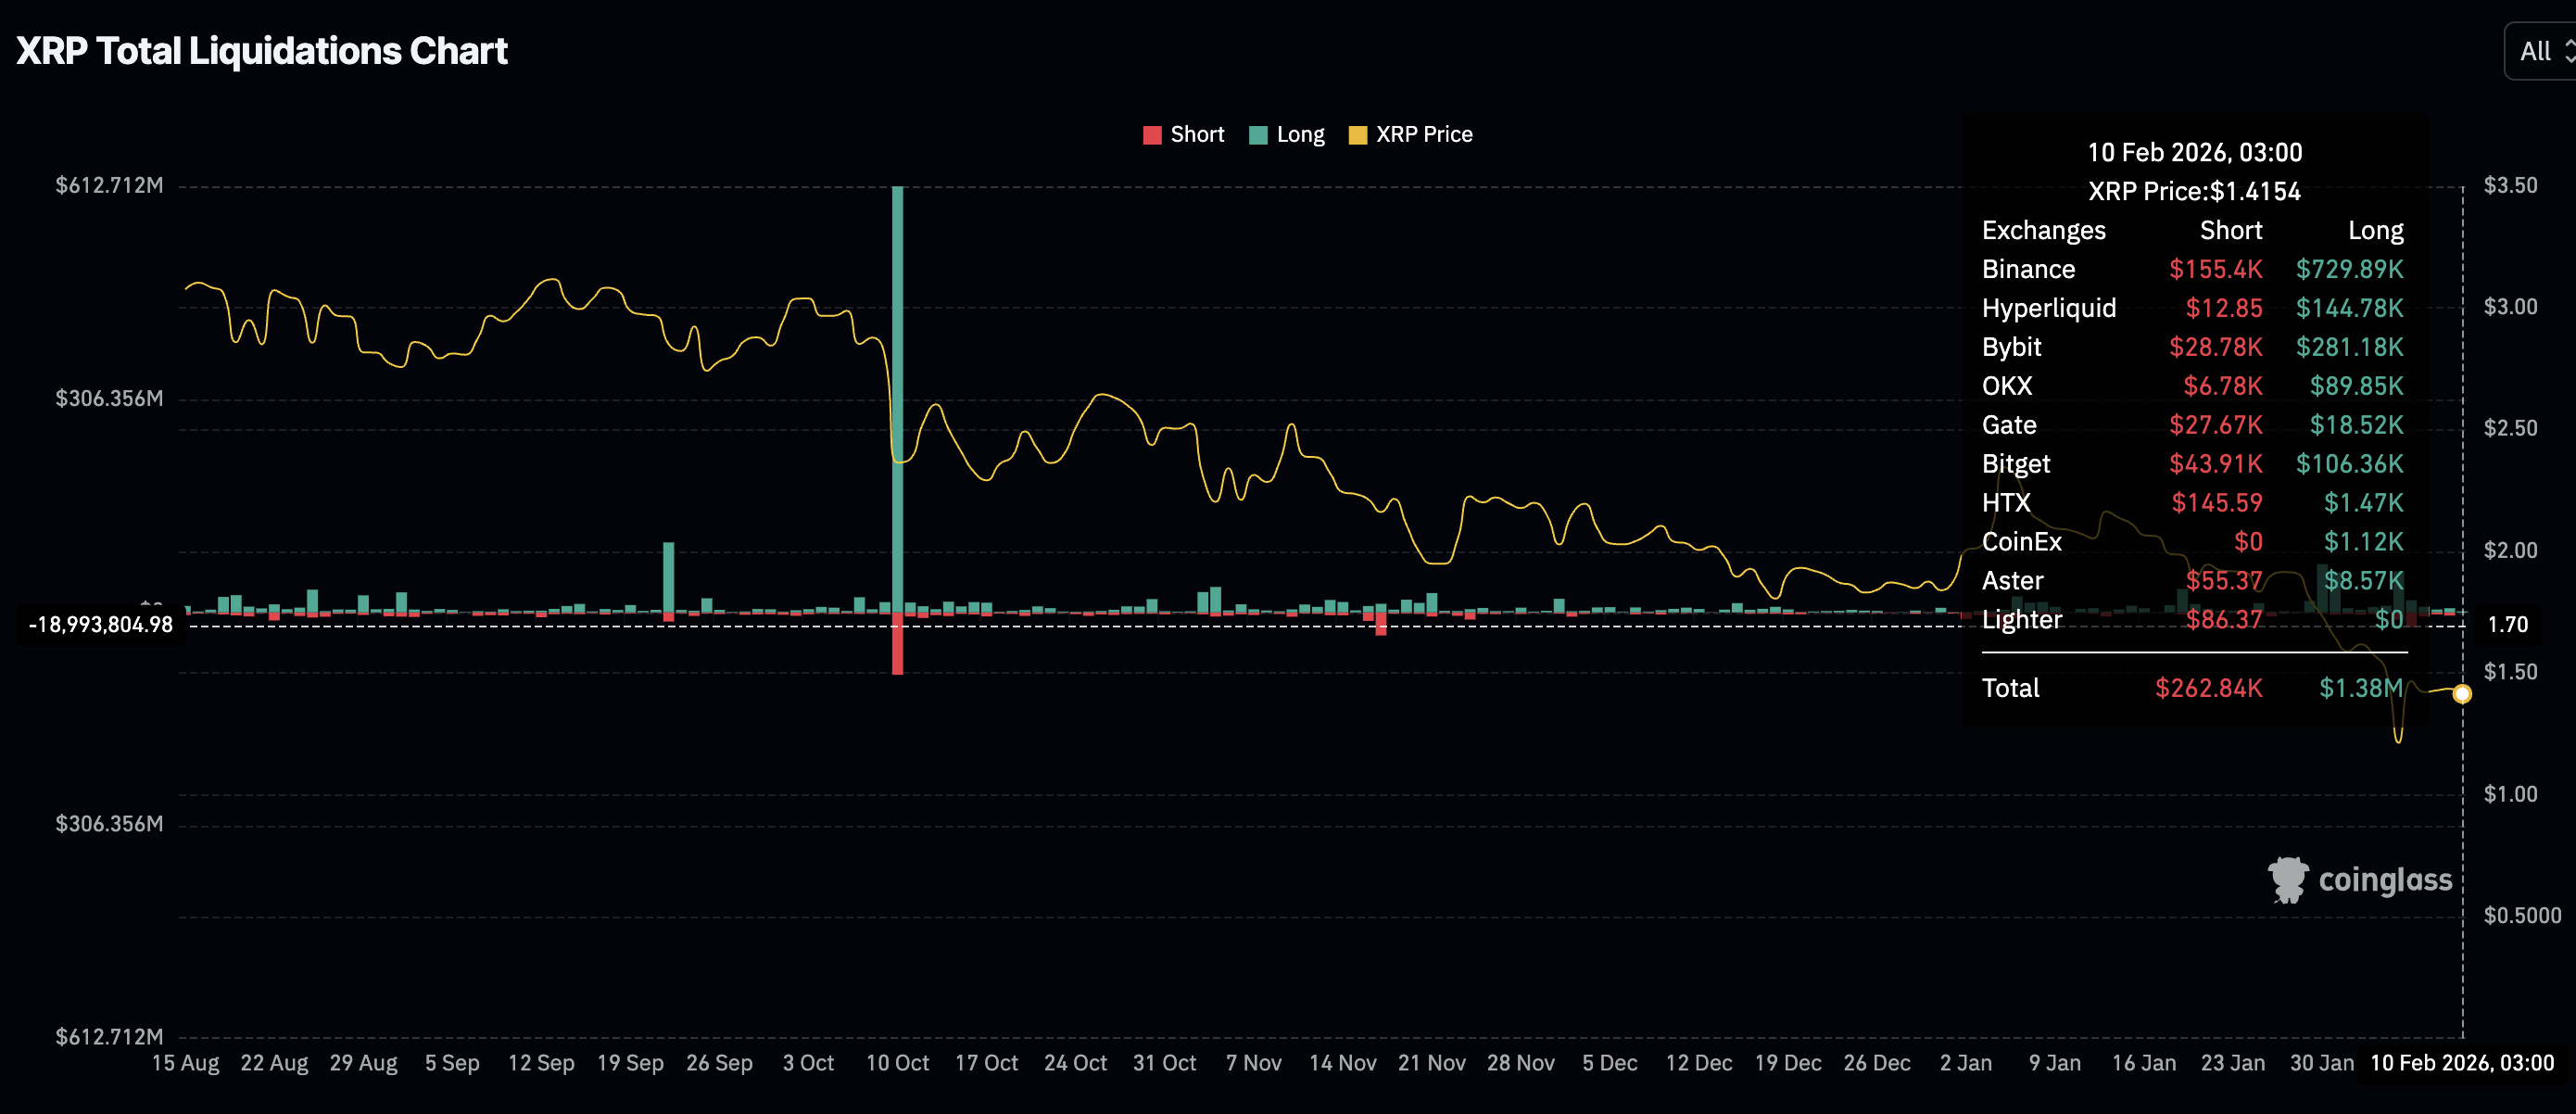
Traders are facing fewer liquidations of leveraged positions, as only $1.38 million in long positions and approximately $263,000 in shorts have been wiped out on Tuesday. For context, $59 million in long positions and $11 million in shorts were liquidated on Thursday as headwinds intensified across the crypto market. Fewer liquidations extend a breather for investors who may want to increase exposure at lower price levels, anticipating short-term rebounds.
Technical outlook: Assessing XRP’s short-term market structure
XRP is trading above $1.40 support, but holds below the 50-day Exponential Moving Average (EMA) at $1.81, the 100-day EMA at $2.00 and the 200-day EMA at $2.18. The downward-slopping moving averages align with the overall bearish trend that continues to cap rebounds.
At the same time, the Moving Average Convergence Divergence (MACD) stays below the signal line on the daily chart, prompting investors to reconsider seeking exposure. Meanwhile, the red histogram bars are contracting, suggesting that bearish momentum may be slowly easing. The Relative Strength Index (RSI) at 34 on the daily chart reflects subdued impulse without reaching oversold conditions.
For XRP to sustain recovery toward Friday's high at $1.54 and the 50-day EMA at $1.81, the RSI should steadily rise toward the midline.
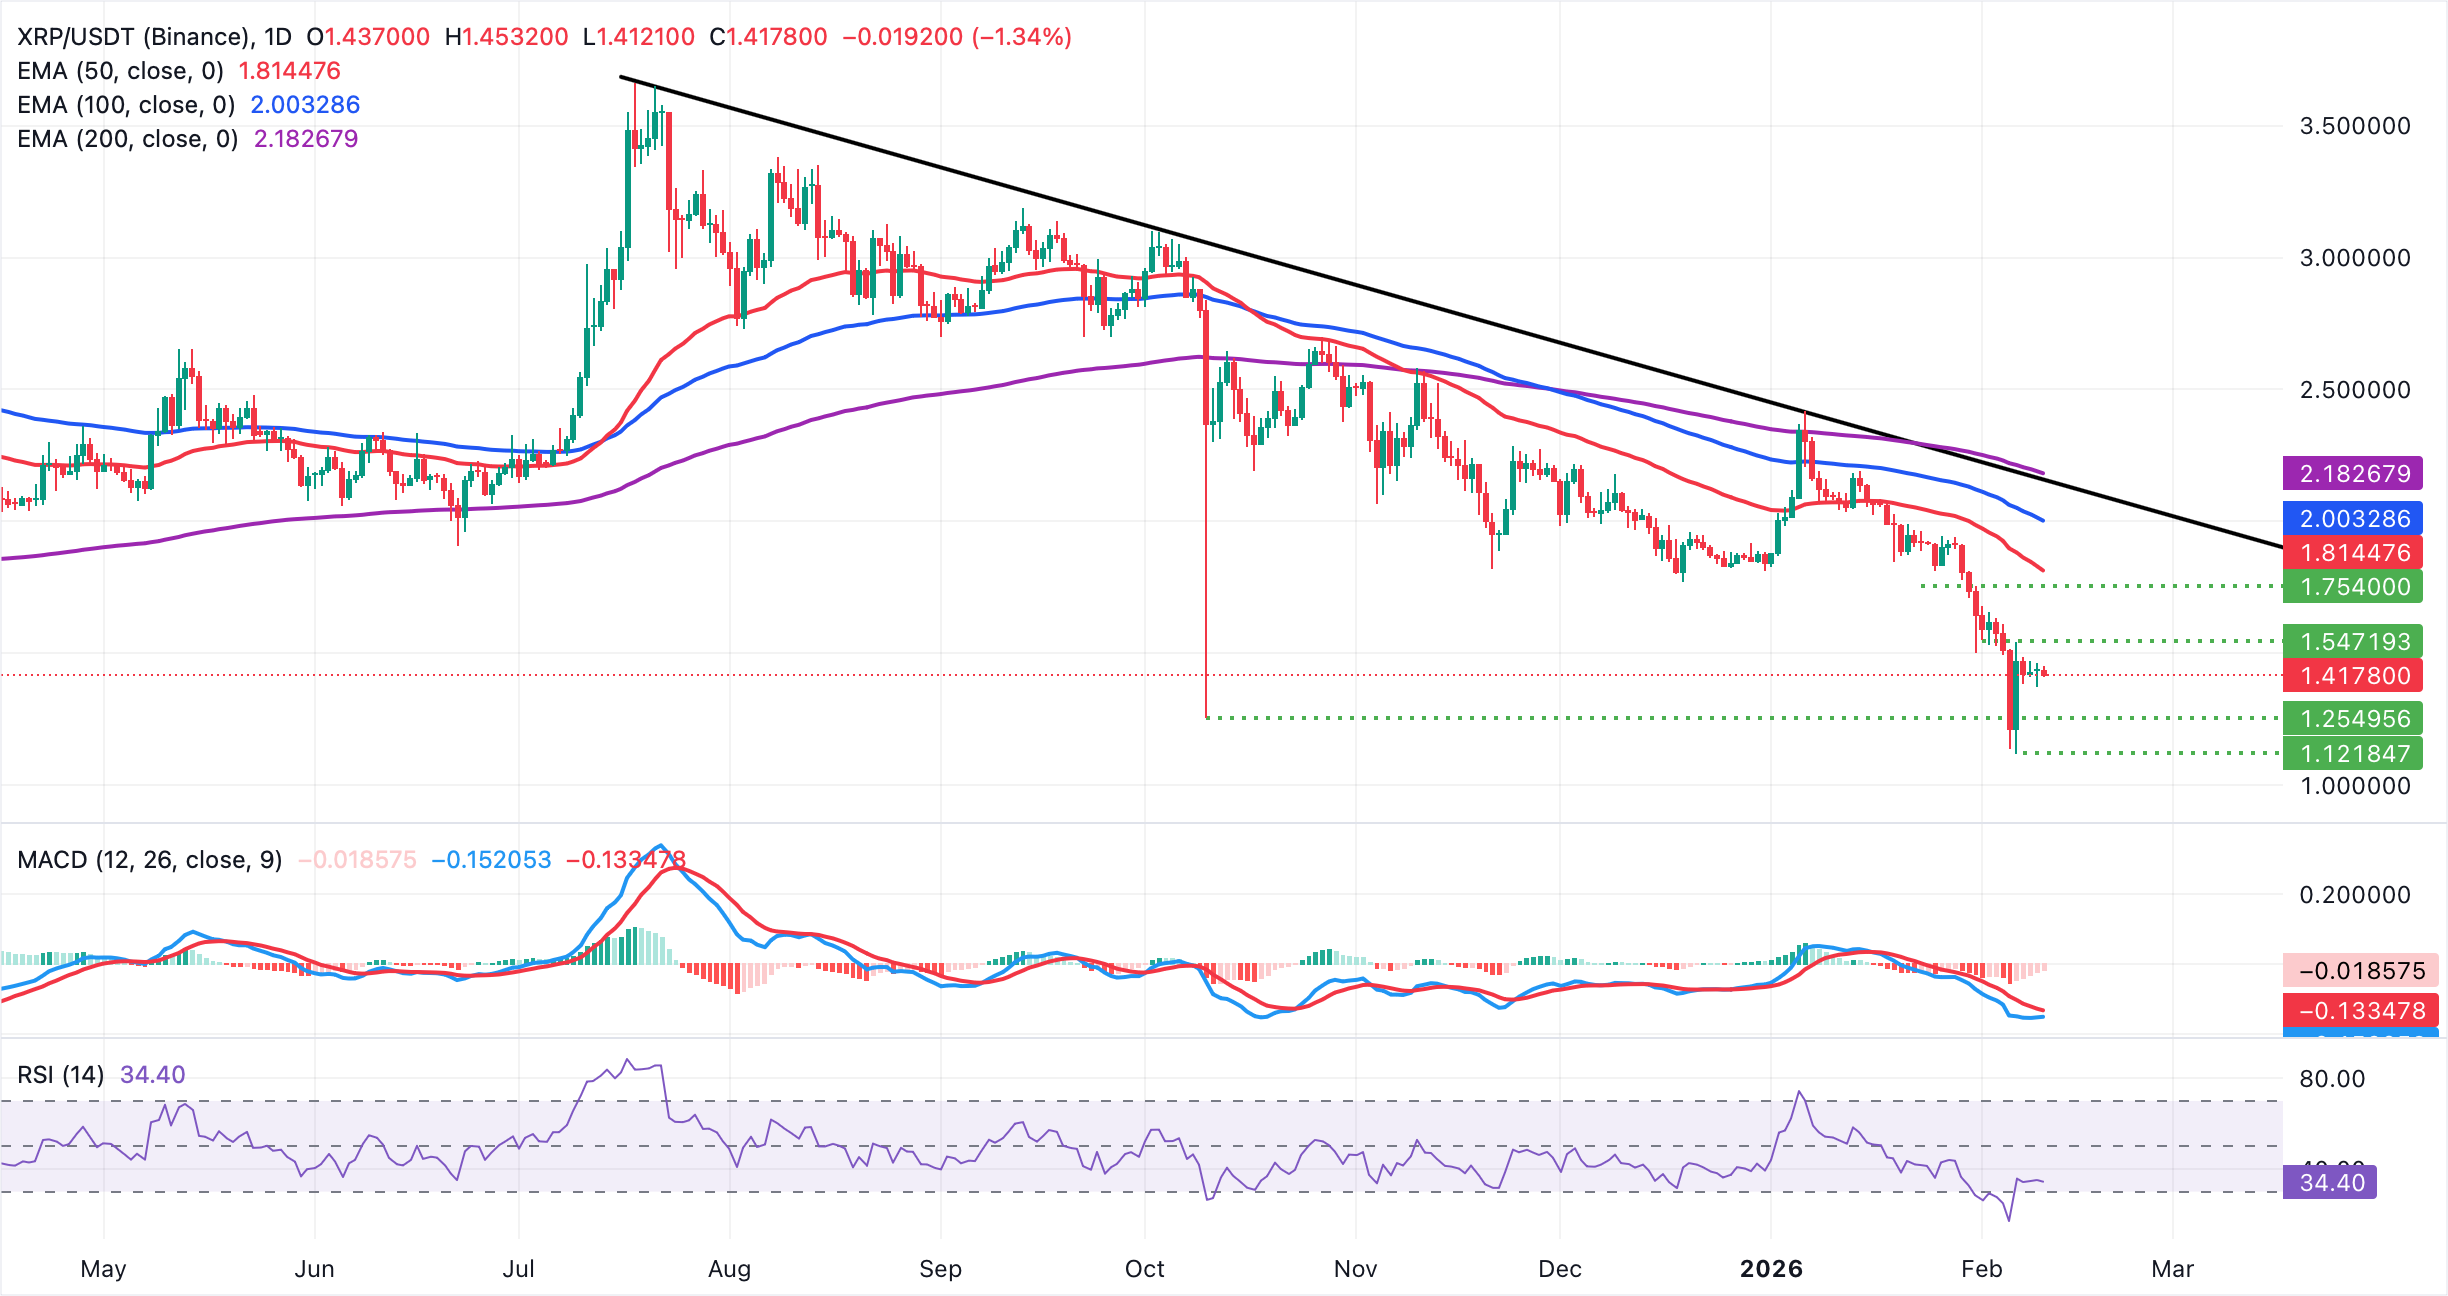
Still, the descending trend line from $3.66 limits recoveries, with resistance at $2.15. As long as the price remains under these technical boundaries, the path of least resistance would stay lower, with targets at $1.25 (October 10 low) and Friday's low at $1.12.
Cryptocurrency metrics FAQs
The developer or creator of each cryptocurrency decides on the total number of tokens that can be minted or issued. Only a certain number of these assets can be minted by mining, staking or other mechanisms. This is defined by the algorithm of the underlying blockchain technology. On the other hand, circulating supply can also be decreased via actions such as burning tokens, or mistakenly sending assets to addresses of other incompatible blockchains.
Market capitalization is the result of multiplying the circulating supply of a certain asset by the asset’s current market value.
Trading volume refers to the total number of tokens for a specific asset that has been transacted or exchanged between buyers and sellers within set trading hours, for example, 24 hours. It is used to gauge market sentiment, this metric combines all volumes on centralized exchanges and decentralized exchanges. Increasing trading volume often denotes the demand for a certain asset as more people are buying and selling the cryptocurrency.
Funding rates are a concept designed to encourage traders to take positions and ensure perpetual contract prices match spot markets. It defines a mechanism by exchanges to ensure that future prices and index prices periodic payments regularly converge. When the funding rate is positive, the price of the perpetual contract is higher than the mark price. This means traders who are bullish and have opened long positions pay traders who are in short positions. On the other hand, a negative funding rate means perpetual prices are below the mark price, and hence traders with short positions pay traders who have opened long positions.
(The technical analysis of this story was written with the help of an AI tool.)

超过一百万用户依赖 FXStreet 获取实时市场数据、图表工具、专家洞见和外汇新闻。其全面的经济日历和教育网络研讨会帮助交易者保持信息领先、做出审慎决策。FXStreet 拥有约 60 人的团队,分布在巴塞罗那总部及全球各地区。
阅读更多


