
Ripple Price Forecast: XRP slumps toward $1.00 despite network growth and ETF demand
作者 John Isige
更新: 30 Jun 2026


热门文章

Ripple (XRP) is holding above the key $1.00 psychological support level at the time of writing on Tuesday, even as the market endures a protracted downturn that began in mid-June.
- XRP ticks lower but holds above the psychological $1.00 on Tuesday.
- The XRP Ledger sees notable network growth, with newly created addresses spiking near 5,000, hinting at dip-buying.
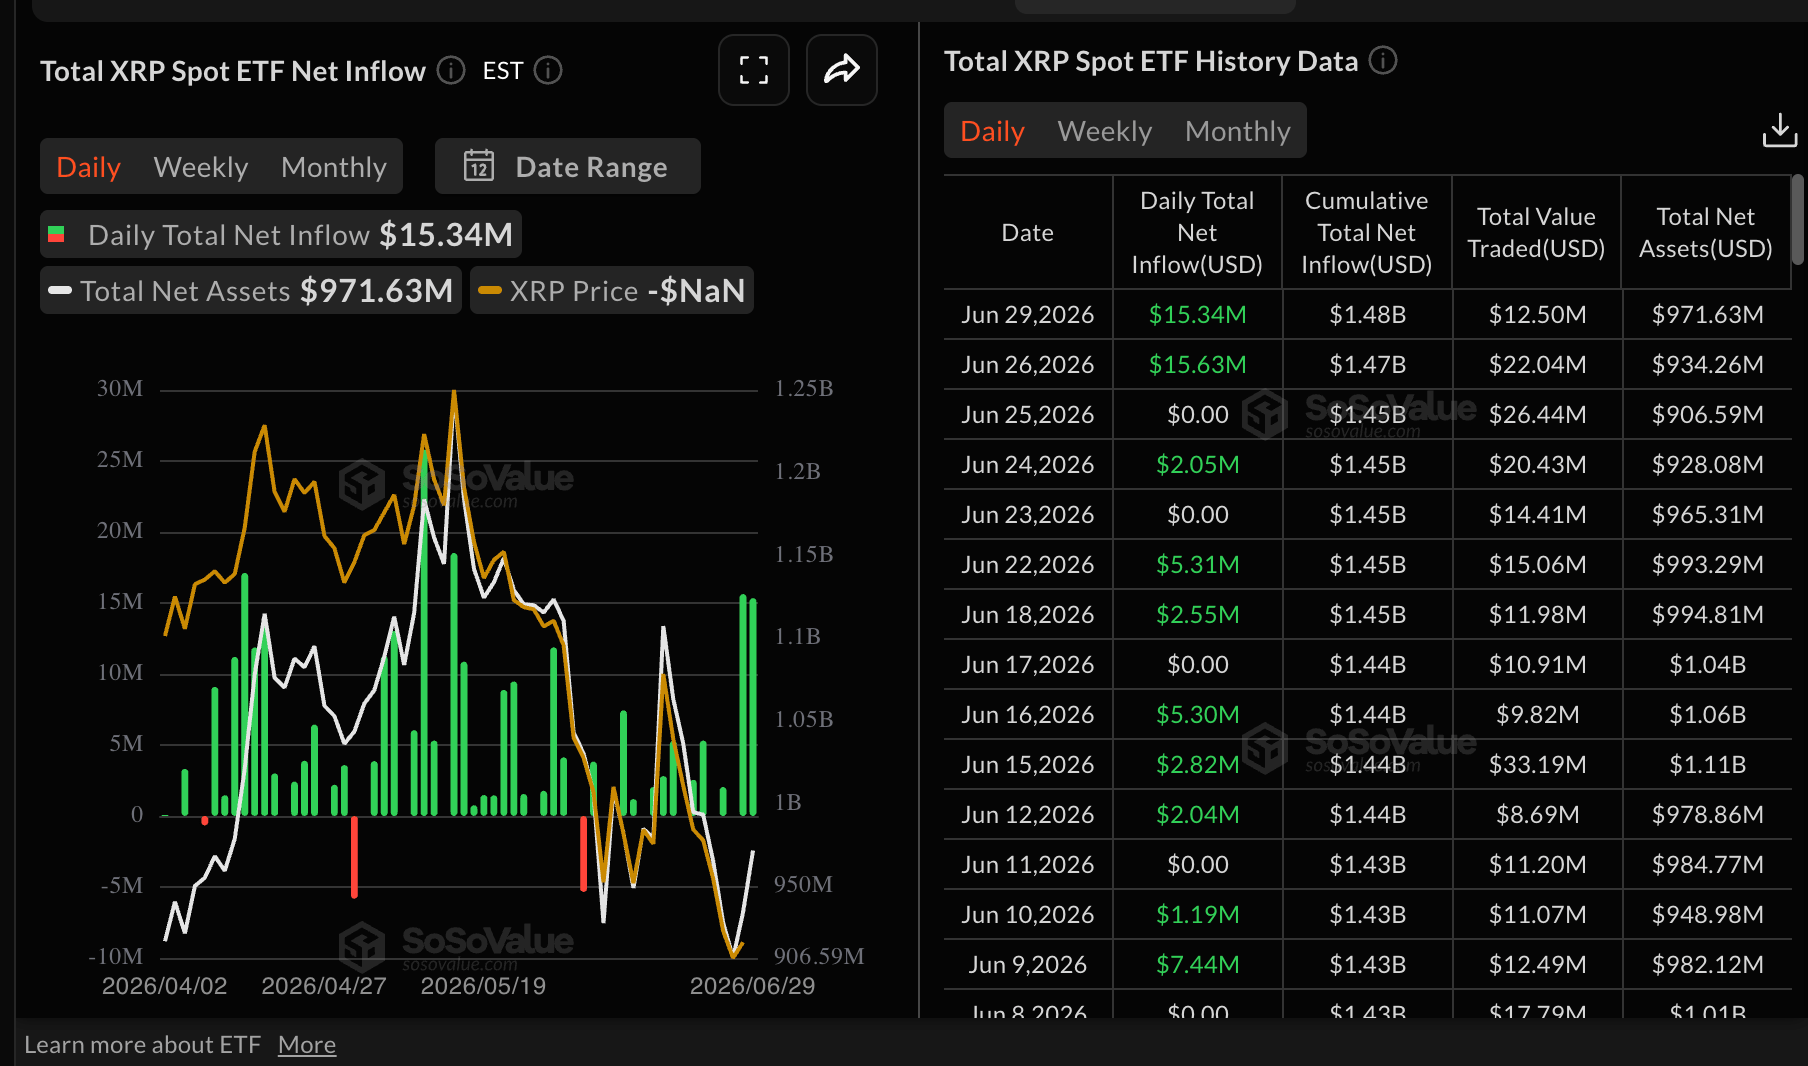
- US-listed XRP ETFs extended bullish streak with inflows of $15 million on Monday but failed to lift price outlook.
Ripple (XRP) is holding above the key $1.00 psychological support level at the time of writing on Tuesday, even as the market endures a protracted downturn that began in mid-June.
The drawdown underscores the prevailing risk-off mood across the crypto space. However, XRP is seeing renewed momentum, highlighted by a sharp uptick in on-chain activity and consistent institutional inflows.
XRP network activity rises
The XRP Ledger (XRPL) is witnessing a notable surge in network activity, with daily new wallet creations approaching 5,000, a level not seen in the past three months, according to Santiment data. This uptick suggests that despite sustained price pressure near the $1.00 mark, investor engagement remains resilient, with participants capitalizing on this key psychological support.
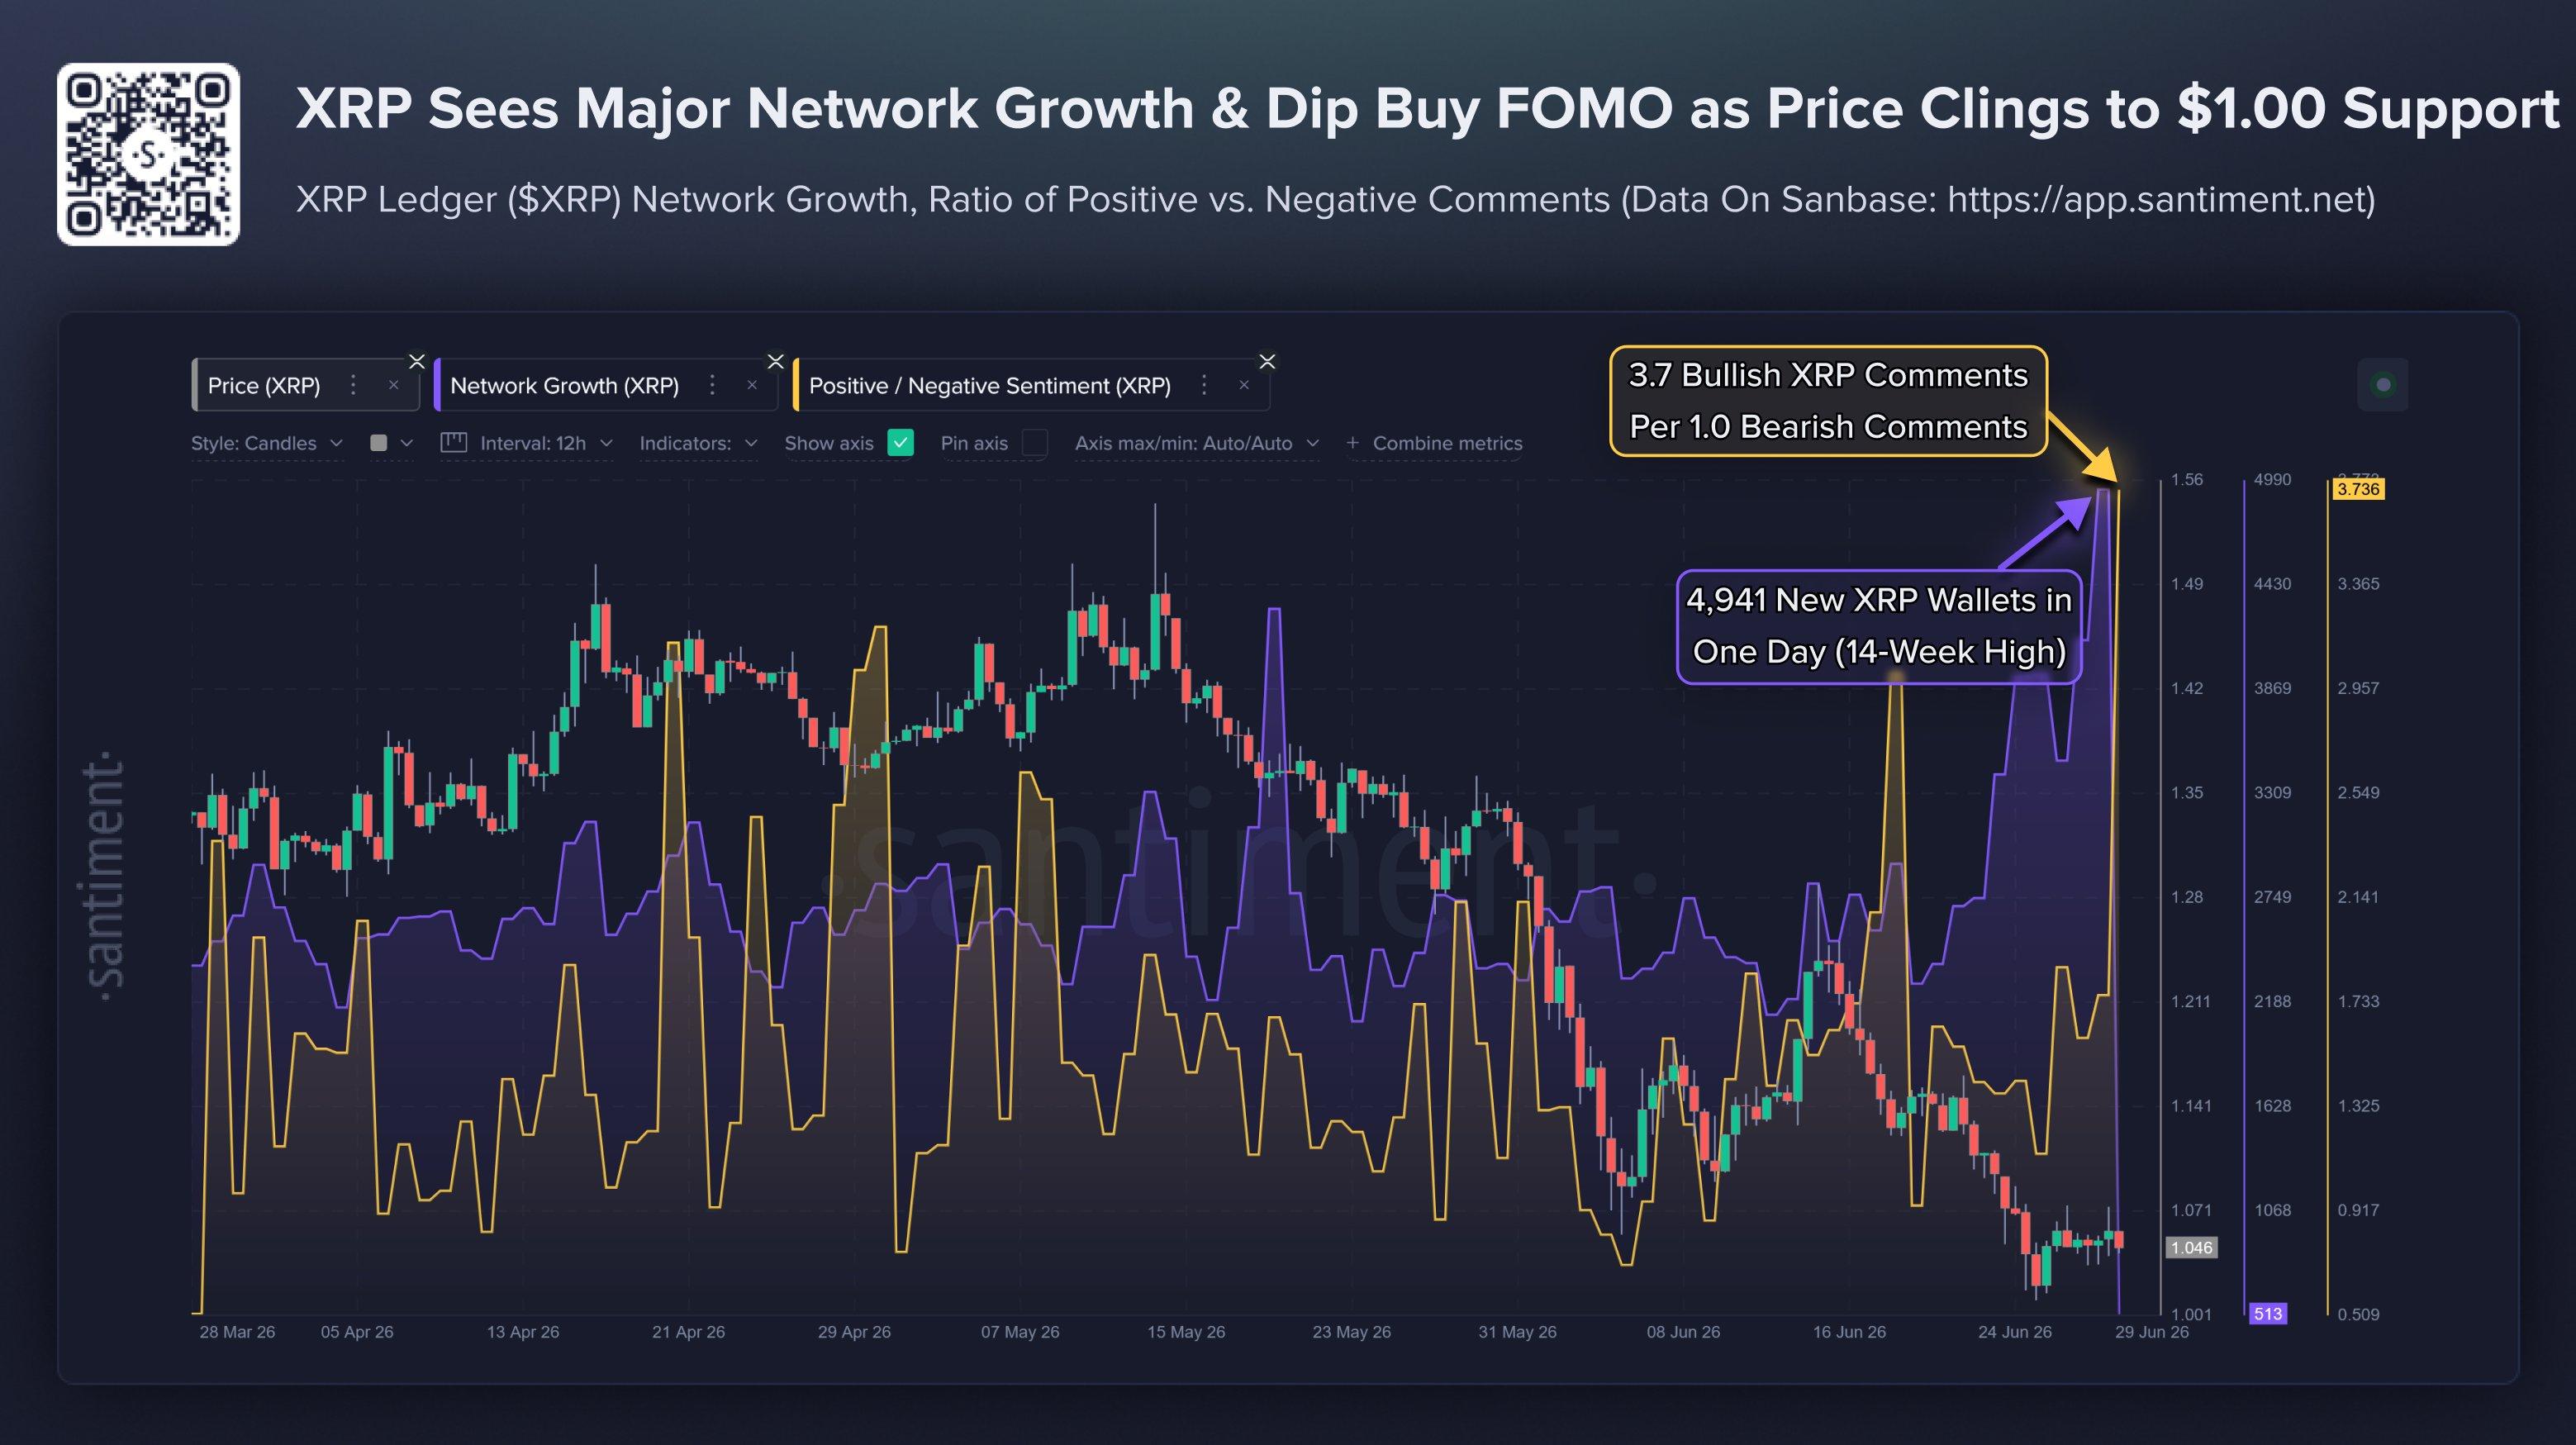
Market sentiment is also turning increasingly positive around the $1.00 level, with bullish commentary now outnumbering bearish remarks by 3.7 to 1, underscoring the level’s appeal as a dip-buying opportunity.
“Part of this optimism comes from XRP’s familiar rebound history, ongoing ETF and institutional narratives, and the idea that larger holders have continued building exposure even during ugly price action,” Santiment analysts stated.
XRP spot Exchange-Traded Funds (ETFs), on the other hand, continue to post inflows defying the current bearish outlook in the crypto market. Inflows into US-listed ETFs steadied above $15 million on Monday, bringing cumulative deposits to $1.48 billion and net assets under management to $972 million.
The sustained uptake of XRP ETFs shows that institutions see a bullish picture and are willing to increase exposure even as prices falter near the psychological support level of $1.00.
Price analysis: XRP sustains bearish outlook
XRP trades at $1.04, keeping a clear bearish near-term tone as it sits well below the 50-day, 100-day and 200-day Exponential Moving Averages (EMAs) at $1.20, $1.31 and $1.52 respectively. The Bollinger Bands show spot trading beneath the middle band at $1.12 and relatively close to the lower band support at $1.00, hinting at persistent downside pressure.
At the same time, momentum indicators reinforce this capped structure, with the Moving Average Convergence Divergence (MACD) histogram slightly negative on the daily chart and the Relative Strength Index (RSI) hovering near 32, suggesting weak demand with a modestly oversold bias rather than a decisive reversal.
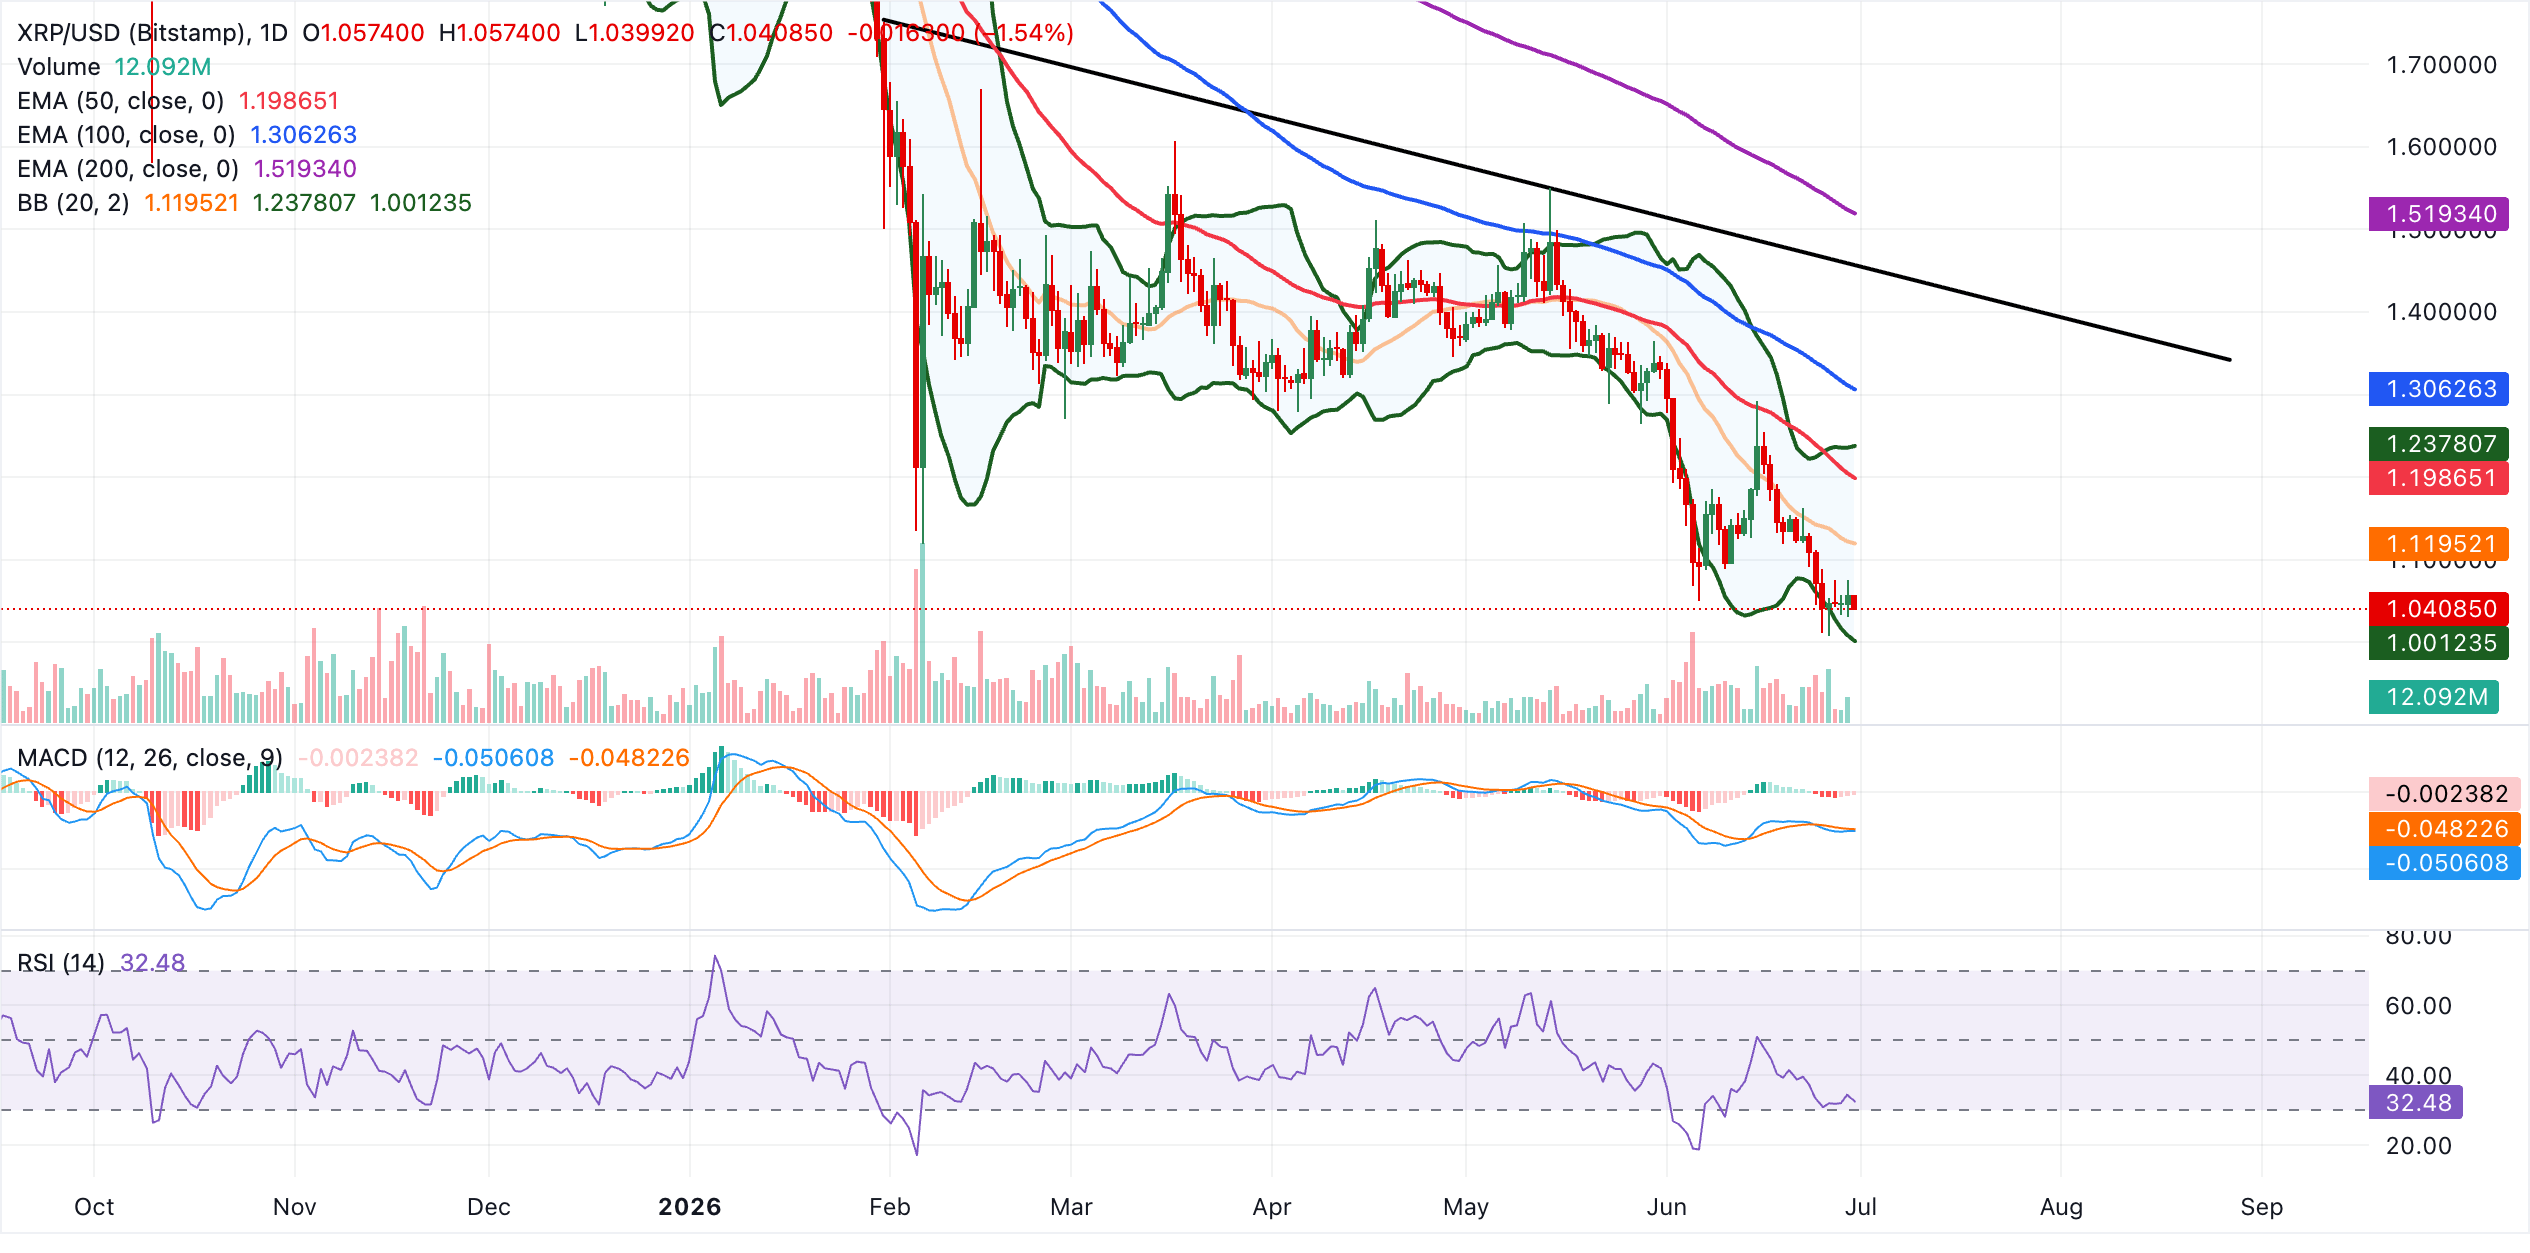
On the topside, initial resistance emerges at the Bollinger middle band near $1.12, followed by clustered EMA resistance from the 50-day at $1.12 and the upper Bollinger band around $1.24, before a more substantial barrier at the 100-day EMA at $1.31 and the broader bearish cap imposed by the 200-day EMA at $1.52.
Looking down, the immediate focus is the pivot around the current trading area near $1.04. A daily close below this level would open the way toward the Bollinger lower band support at $1.00, where buyers could attempt to stabilize price before any meaningful recovery attempt toward the overhead moving averages.
(The technical analysis of this story was written with the help of an AI tool.)
Cryptocurrency metrics FAQs
The developer or creator of each cryptocurrency decides on the total number of tokens that can be minted or issued. Only a certain number of these assets can be minted by mining, staking or other mechanisms. This is defined by the algorithm of the underlying blockchain technology. On the other hand, circulating supply can also be decreased via actions such as burning tokens, or mistakenly sending assets to addresses of other incompatible blockchains.
Market capitalization is the result of multiplying the circulating supply of a certain asset by the asset’s current market value.
Trading volume refers to the total number of tokens for a specific asset that has been transacted or exchanged between buyers and sellers within set trading hours, for example, 24 hours. It is used to gauge market sentiment, this metric combines all volumes on centralized exchanges and decentralized exchanges. Increasing trading volume often denotes the demand for a certain asset as more people are buying and selling the cryptocurrency.
Funding rates are a concept designed to encourage traders to take positions and ensure perpetual contract prices match spot markets. It defines a mechanism by exchanges to ensure that future prices and index prices periodic payments regularly converge. When the funding rate is positive, the price of the perpetual contract is higher than the mark price. This means traders who are bullish and have opened long positions pay traders who are in short positions. On the other hand, a negative funding rate means perpetual prices are below the mark price, and hence traders with short positions pay traders who have opened long positions.

超过一百万用户依赖 FXStreet 获取实时市场数据、图表工具、专家洞见和外汇新闻。其全面的经济日历和教育网络研讨会帮助交易者保持信息领先、做出审慎决策。FXStreet 拥有约 60 人的团队,分布在巴塞罗那总部及全球各地区。
阅读更多


