
Ripple Price Forecast: XRP technical weakness persists as selling intensifies toward $1.00
作者 John Isige
更新: 10 Jun 2026


热门文章

Ripple (XRP) grinds lower, trading around $1.10 at the time of writing on Wednesday. The sticky bearish outlook mirrors the broader crypto market, with major coins such as Bitcoin (BTC) and Ethereum (ETH) facing weak demand as investors de-risk.
- XRP slips, targets $1.00 key support area amid extreme fear in the crypto market.
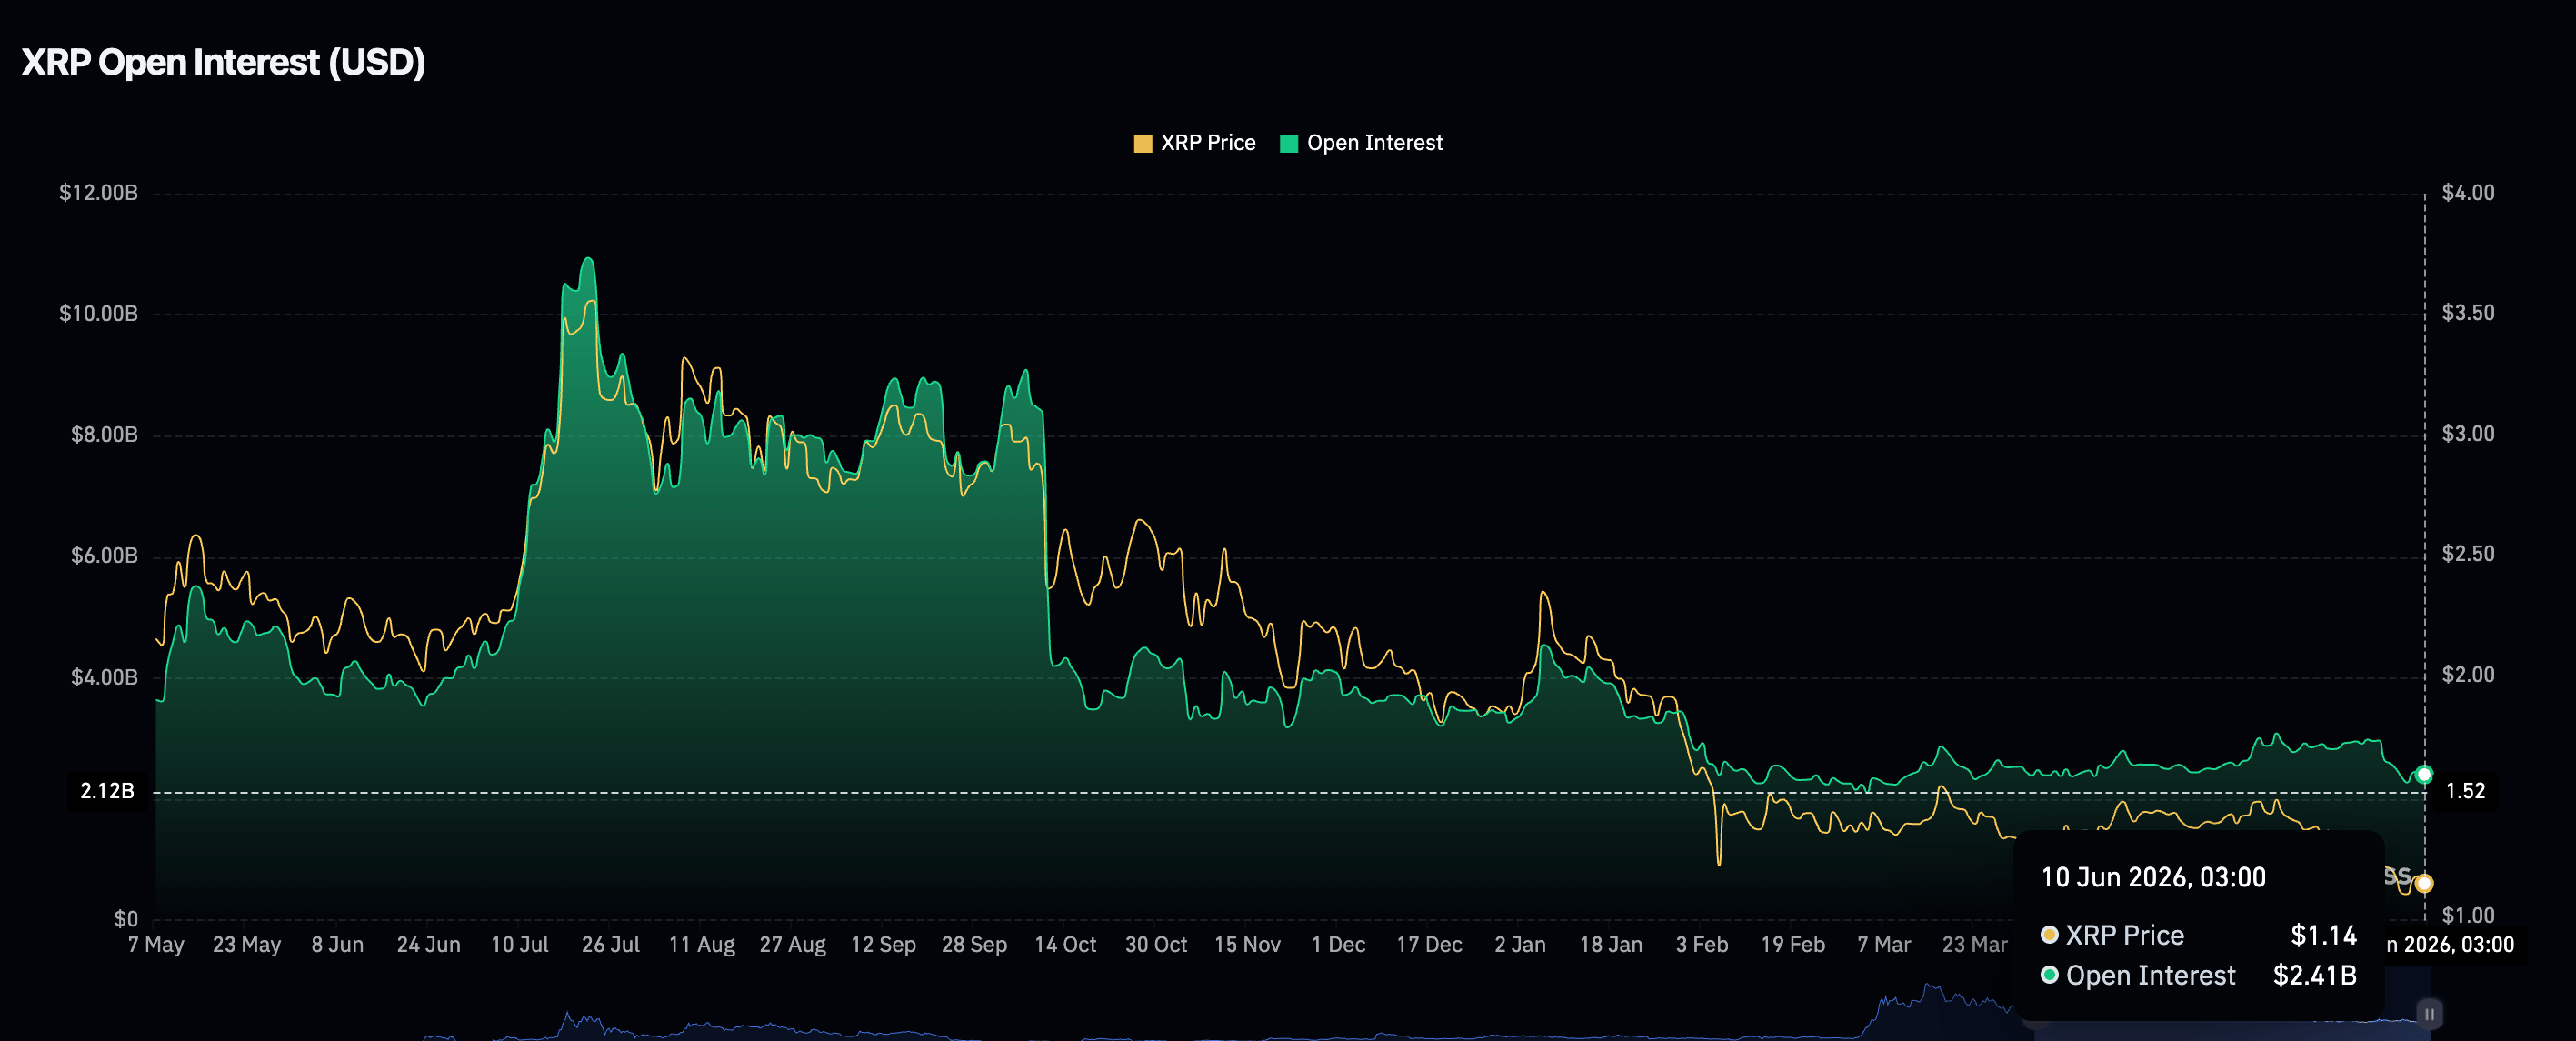
- The XRP derivatives market continues to deteriorate, with Open Interest in perpetual futures slipping to $2.41 billion.
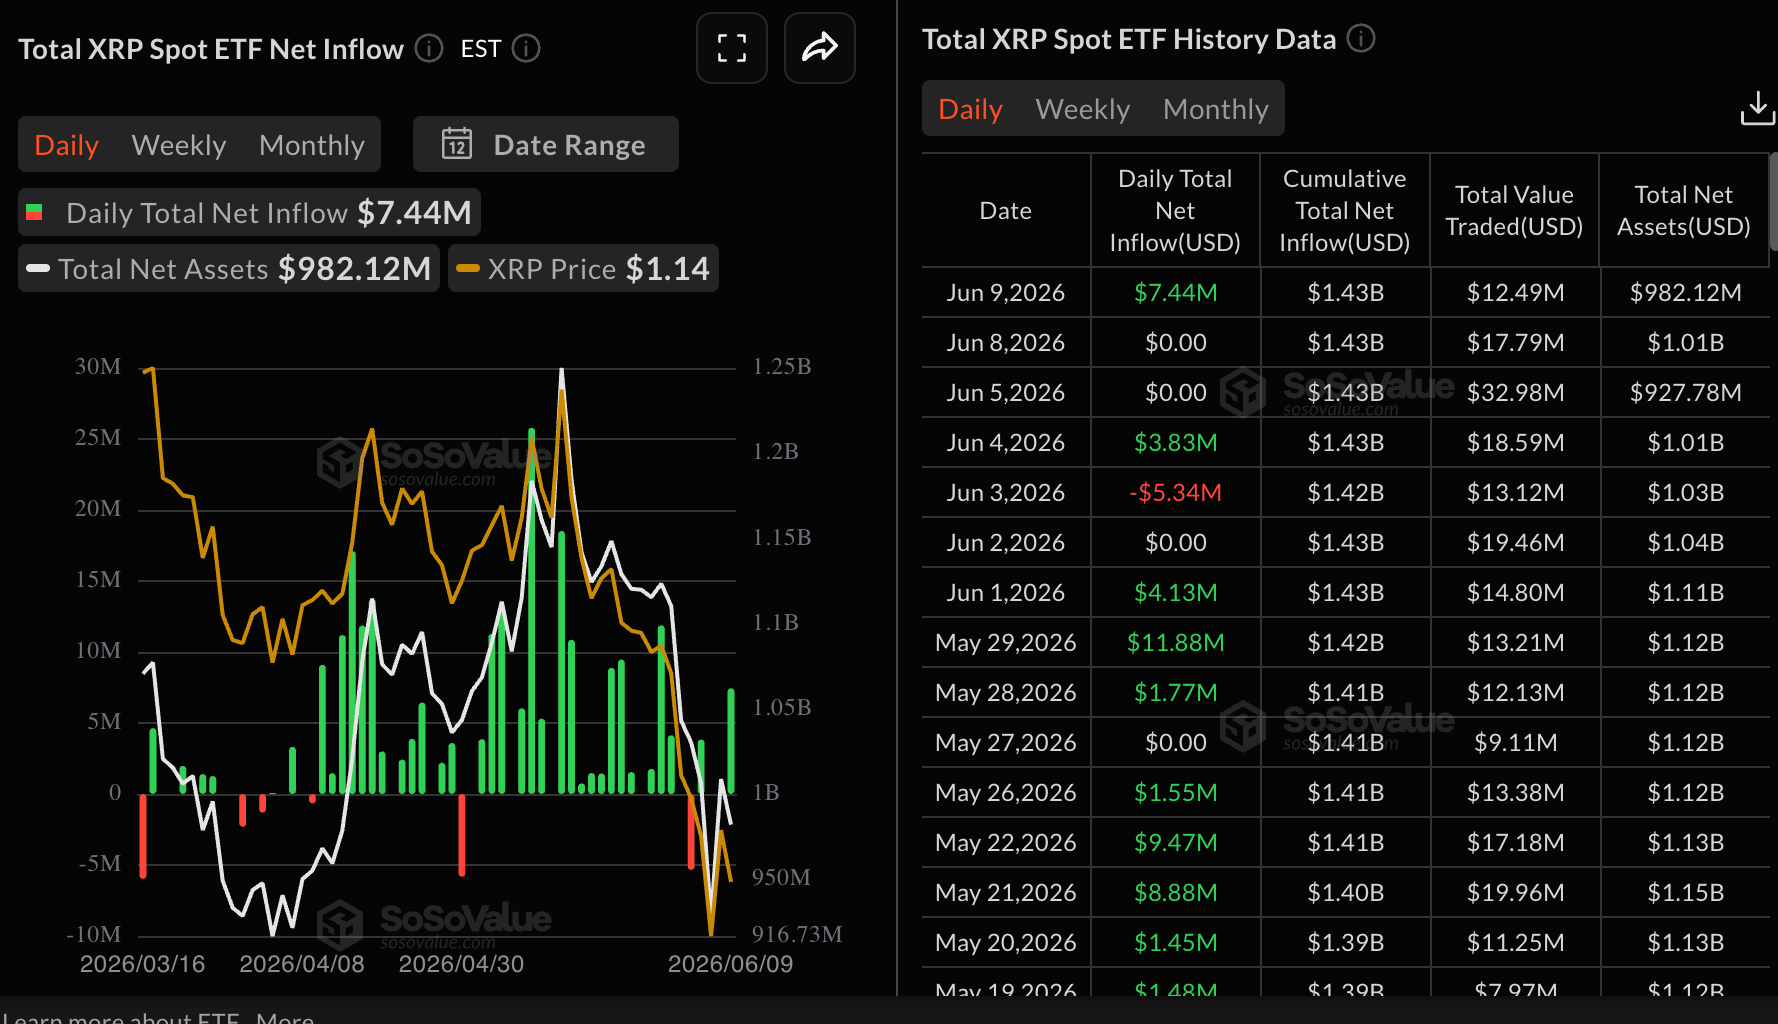
- XRP ETFs attracted $7.44 million in inflows on Tuesday but failed to lift the outlook as weak momentum indicators prevailed.
Ripple (XRP) grinds lower, trading around $1.10 at the time of writing on Wednesday. The sticky bearish outlook mirrors the broader crypto market, with major coins such as Bitcoin (BTC) and Ethereum (ETH) facing weak demand as investors de-risk.
Risk-off sentiment keeps suppressing XRP retail demand
Retail appetite for XRP derivatives has significantly deteriorated, with futures Open Interest (OI) averaging at $2.41 billion on Tuesday, compared to $4.14 billion one year ago and a record high of $10.94 billion in July.
The drop in demand, keeping the OI subdued, suggests that investors lack confidence in XRP’s ability to sustain the uptrend. Until retail interest returns and sustains a consistent uptrend, XRP may struggle to maintain its uptrend.
Meanwhile, XRP spot ETFs edged higher on Tuesday, attracting inflows of $7.44 million following muted activity on Friday and Monday. Cumulative inflows are steady at $1.43 billion, while net assets average $982 million. Despite the inflows, declines remain dominant, with XRP targeting support at $1.10.
Analysis analysis: XRP sell-off depends
XRP trades at $1.10, extending a bearish near‑term bias as price holds well below the key Exponential Moving Averages (EMAs). The 50-day EMA at $1.31, the 100-day EMA at $1.40 and the 200-day EMA at $1.62 all sit overhead, suggesting rallies are likely to face selling interest, while the SuperTrend line at $1.26 also reinforces the topside cap.
Momentum remains heavy, with the Relative Strength Index (RSI) hovering in oversold territory near 29 on the daily chart and the Moving Average Convergence Divergence (MACD) histogram printing negative values, which hints that downside pressure persists even if short-covering bounces emerge.
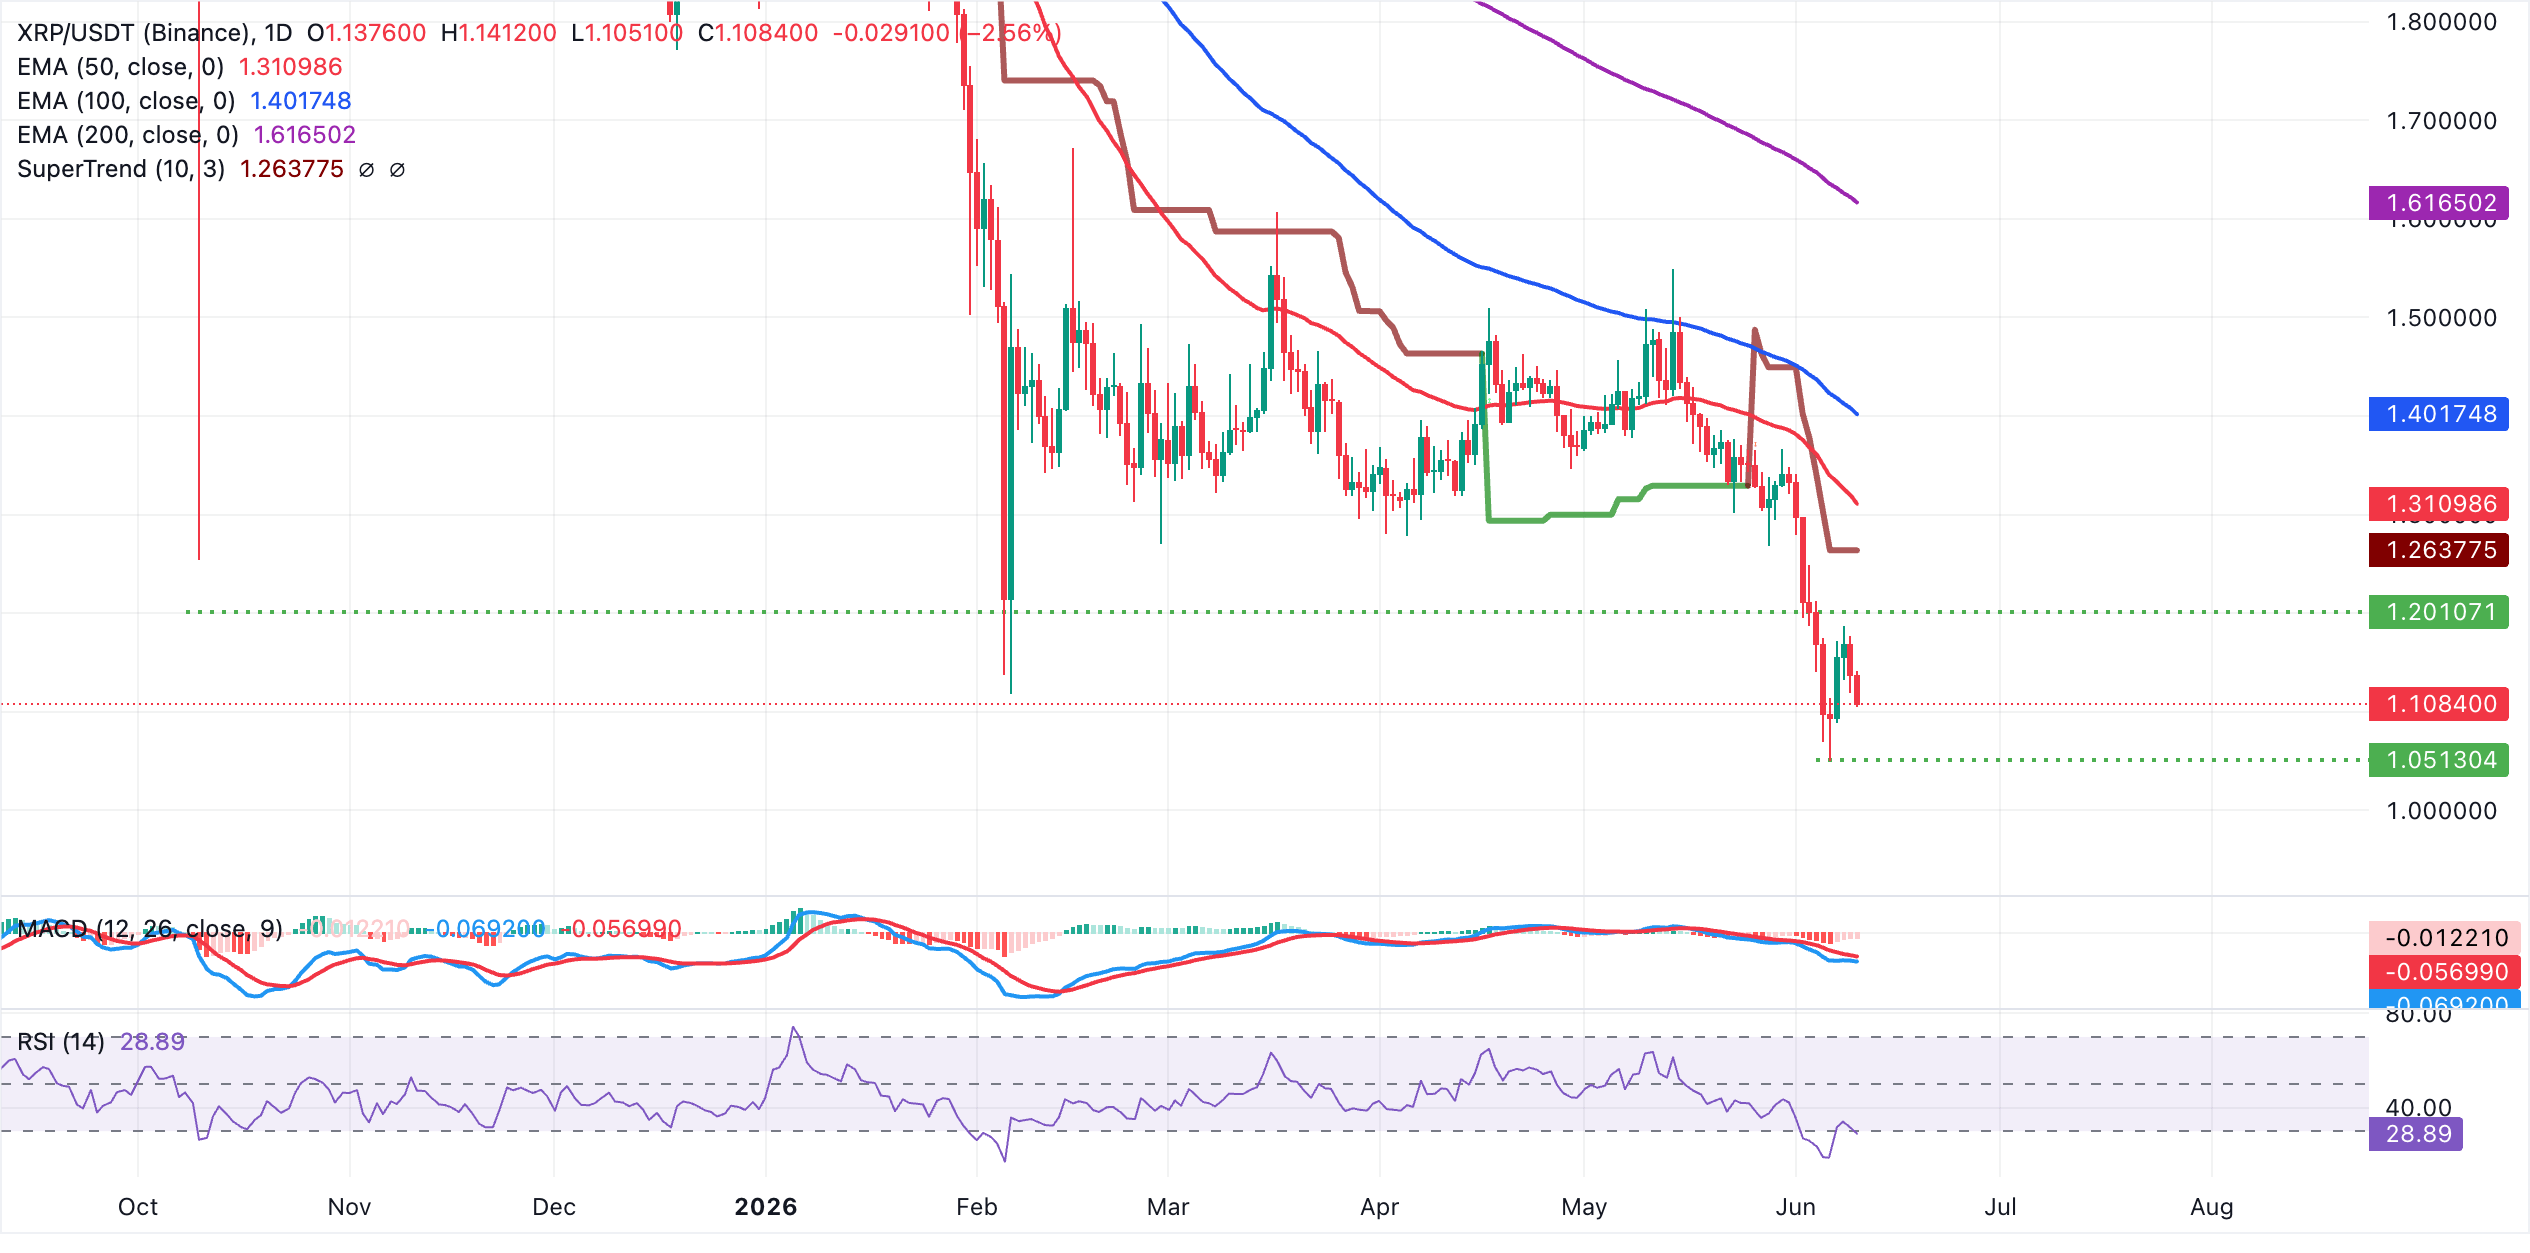
On the topside, initial resistance is seen at the SuperTrend barrier around $1.26, ahead of a more substantial cluster formed by the 50-day EMA at $1.31 and the 100-day EMA at $1.40. Beyond these, the 200-day EMA at $1.62 marks a major hurdle that would need to be reclaimed to alleviate the broader bearish structure. As long as XRP trades below this cluster of moving averages, rallies are likely to be viewed as corrective.
Respecting that the prevailing configuration of moving averages keeps the pair vulnerable to further downside until at least the SuperTrend and shorter EMAs are decisively cleared.
(The technical analysis of this story was written with the help of an AI tool.)
Open Interest, funding rate FAQs
Higher Open Interest is associated with higher liquidity and new capital inflow to the market. This is considered the equivalent of increase in efficiency and the ongoing trend continues. When Open Interest decreases, it is considered a sign of liquidation in the market, investors are leaving and the overall demand for an asset is on a decline, fueling a bearish sentiment among investors.
Funding fees bridge the difference between spot prices and prices of futures contracts of an asset by increasing liquidation risks faced by traders. A consistently high and positive funding rate implies there is a bullish sentiment among market participants and there is an expectation of a price hike. A consistently negative funding rate for an asset implies a bearish sentiment, indicating that traders expect the cryptocurrency’s price to fall and a bearish trend reversal is likely to occur.

超过一百万用户依赖 FXStreet 获取实时市场数据、图表工具、专家洞见和外汇新闻。其全面的经济日历和教育网络研讨会帮助交易者保持信息领先、做出审慎决策。FXStreet 拥有约 60 人的团队,分布在巴塞罗那总部及全球各地区。
阅读更多


