
Sell-off in Silver continues: Is price heading towards $60?
作者 Sagar Dua
更新: 8 Jun 2026


热门文章

Silver price (XAG/USD) extends its decline to near $66.50 during the late Asian trading session on Monday, the lowest level seen in over two months.
- Silver price slides almost 2% to near $66.50 as trades raise hawkish Fed bets.
- Surprisingly upbeat US NFP data has boosted bets supporting interest rate hikes by the Fed.
- Oil prices have risen due to renewed hostilities in the Middle East.
Silver price (XAG/USD) extends its decline to near $66.50 during the late Asian trading session on Monday, the lowest level seen in over two months. The white metal faces intense selling pressure as accelerated hawkish Federal Reserve (Fed) bets due to the compounding effect of surprisingly upbeat United States (US) Nonfarm Payrolls (NFP) data for May, and already high inflationary pressures have boosted US Treasury yields.
The CME FedWatch tool shows that the possibility of the Fed delivering at least one interest rate hike this year has increased to 73.8% from 45.2% seen a week ago.
The scenario of rising yields on interest-bearing assets diminishes the appeal of non-yielding assets, such as Silver.
In the early European trade, 10-year US-Treasury Yields post almost a fresh two-week high at 4.57%.
On Friday, the US NFP report showed that the economy created 172K fresh jobs, significantly higher than 85K estimates. Meanwhile, the April reading was also revised higher to 179K from 115K.
Meanwhile, the US inflation is already high due to elevated energy prices in the wake of the energy supply crisis. Fears of US inflation accelerating further have escalated due to fears of a resumption of all-out war in the Middle East, following the exchange of attacks between Israel and Iran over the weekend.
To get the current status of US inflation, investors will focus on the US Consumer Price Index (CPI) data for May, which will be released on Wednesday. The US headline CPI is estimated to arrive higher at 4.2% Year-on-Year (YoY) from 3.8% in April.
Silver technical analysis
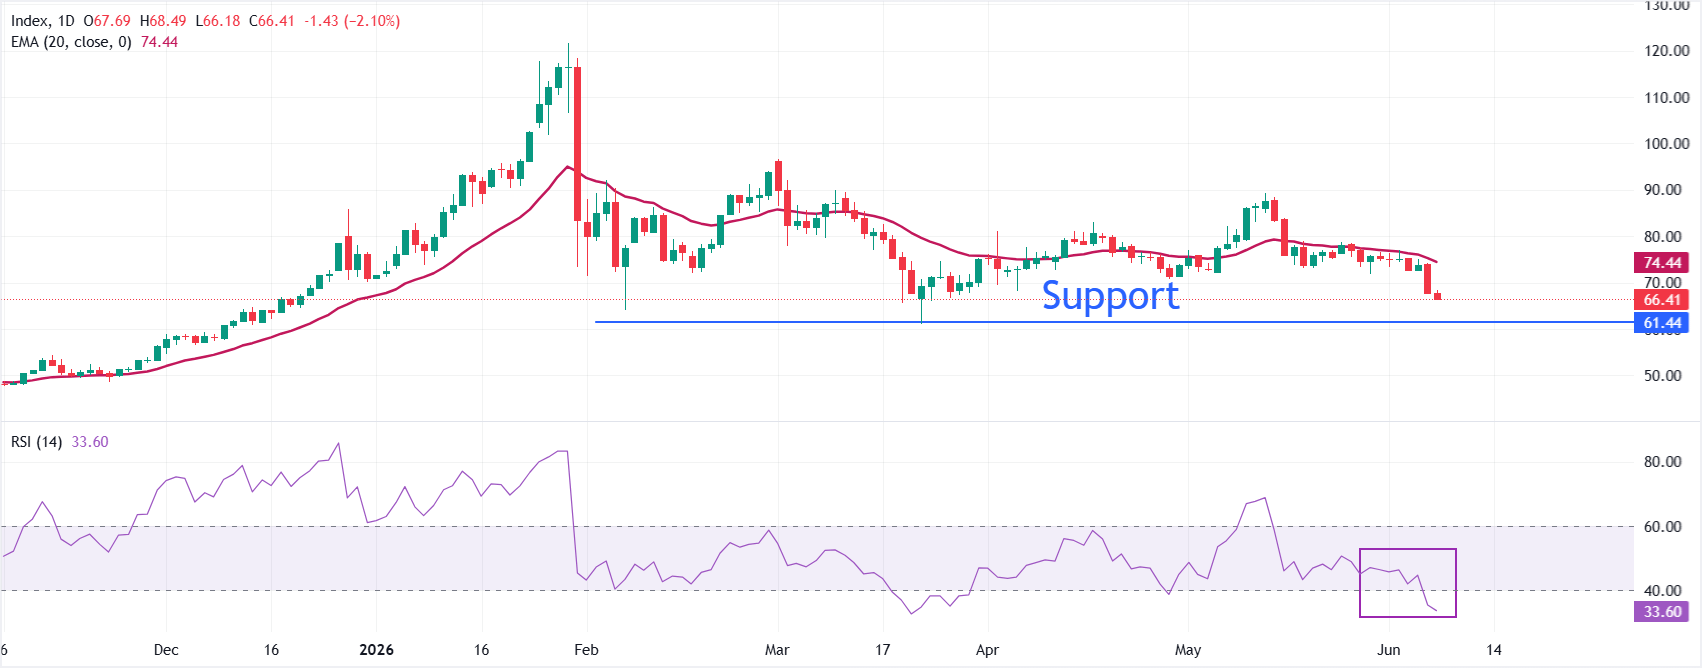
XAG/USD trades lower at around $66.50 at press time. The pair holds well below the 20-day exponential moving average (EMA) at $74.44, keeping the near-term tone bearish as recent declines extend away from dynamic resistance.
The Relative Strength Index (RSI) has slipped to 33.62, hovering just above oversold territory and hinting that while downside pressure persists, selling momentum could be slowing.
On the topside, the 20-day EMA at $74.44 is the first meaningful resistance that bulls would need to reclaim to ease the current bearish bias and open room for a deeper recovery. On the downside, the Silver price is sliding towards its almost six-month low at $61.01; a break below the same would open further downside towards $60.00.
(The technical analysis of this story was written with the help of an AI tool.)
Silver FAQs
Silver is a precious metal highly traded among investors. It has been historically used as a store of value and a medium of exchange. Although less popular than Gold, traders may turn to Silver to diversify their investment portfolio, for its intrinsic value or as a potential hedge during high-inflation periods. Investors can buy physical Silver, in coins or in bars, or trade it through vehicles such as Exchange Traded Funds, which track its price on international markets.
Silver prices can move due to a wide range of factors. Geopolitical instability or fears of a deep recession can make Silver price escalate due to its safe-haven status, although to a lesser extent than Gold's. As a yieldless asset, Silver tends to rise with lower interest rates. Its moves also depend on how the US Dollar (USD) behaves as the asset is priced in dollars (XAG/USD). A strong Dollar tends to keep the price of Silver at bay, whereas a weaker Dollar is likely to propel prices up. Other factors such as investment demand, mining supply – Silver is much more abundant than Gold – and recycling rates can also affect prices.
Silver is widely used in industry, particularly in sectors such as electronics or solar energy, as it has one of the highest electric conductivity of all metals – more than Copper and Gold. A surge in demand can increase prices, while a decline tends to lower them. Dynamics in the US, Chinese and Indian economies can also contribute to price swings: for the US and particularly China, their big industrial sectors use Silver in various processes; in India, consumers’ demand for the precious metal for jewellery also plays a key role in setting prices.
Silver prices tend to follow Gold's moves. When Gold prices rise, Silver typically follows suit, as their status as safe-haven assets is similar. The Gold/Silver ratio, which shows the number of ounces of Silver needed to equal the value of one ounce of Gold, may help to determine the relative valuation between both metals. Some investors may consider a high ratio as an indicator that Silver is undervalued, or Gold is overvalued. On the contrary, a low ratio might suggest that Gold is undervalued relative to Silver.

超过一百万用户依赖 FXStreet 获取实时市场数据、图表工具、专家洞见和外汇新闻。其全面的经济日历和教育网络研讨会帮助交易者保持信息领先、做出审慎决策。FXStreet 拥有约 60 人的团队,分布在巴塞罗那总部及全球各地区。
阅读更多


