
Silver Price Forecast: XAG/USD compresses within triangle chart pattern
作者 Vishal Chaturvedi
发布日期: 19 Feb 2026 | 修改日期: 19 Feb 2026


热门文章

Silver (XAG/USD) trades with a positive tone on Wednesday, snapping a two-day losing streak as dip buyers step in to cushion the downside. At the time of writing, XAG/USD is hovering around $77.50, up over 5.5% on the day.
- XAG/USD snaps a two-day slide with a strong intraday rebound.
- Thin liquidity during the Lunar New Year holiday could amplify short-term price swings.
- Upside momentum improves on the 4-hour chart, but broader bias remains cautious.
Silver (XAG/USD) trades with a positive tone on Wednesday, snapping a two-day losing streak as dip buyers step in to cushion the downside. At the time of writing, XAG/USD is hovering around $77.50, up over 5.5% on the day.
Despite the intraday bounce, the white metal could struggle to build on gains in the near term as traders reassess the evolving macro backdrop and technical landscape. Investors remain cautious about chasing prices aggressively higher, with speculative interest cooling after the sharp correction from record highs near $121.66 set in late January.
At the same time, signs of progress in US-Iran talks could weigh on safe-haven demand, but Silver’s dual role as both an industrial and investment metal remains supportive, while a persistent physical supply deficit helps to keep the broader outlook supported on dips.
Trading volumes are expected to remain thin, with China and several other Asian markets closed for the Lunar New Year holiday. The closure of the Shanghai Futures Exchange (SHFE), one of the largest venues for physical silver trading and delivery, may reduce liquidity during Asian hours, with trading activity likely to normalize when markets reopen next Tuesday.
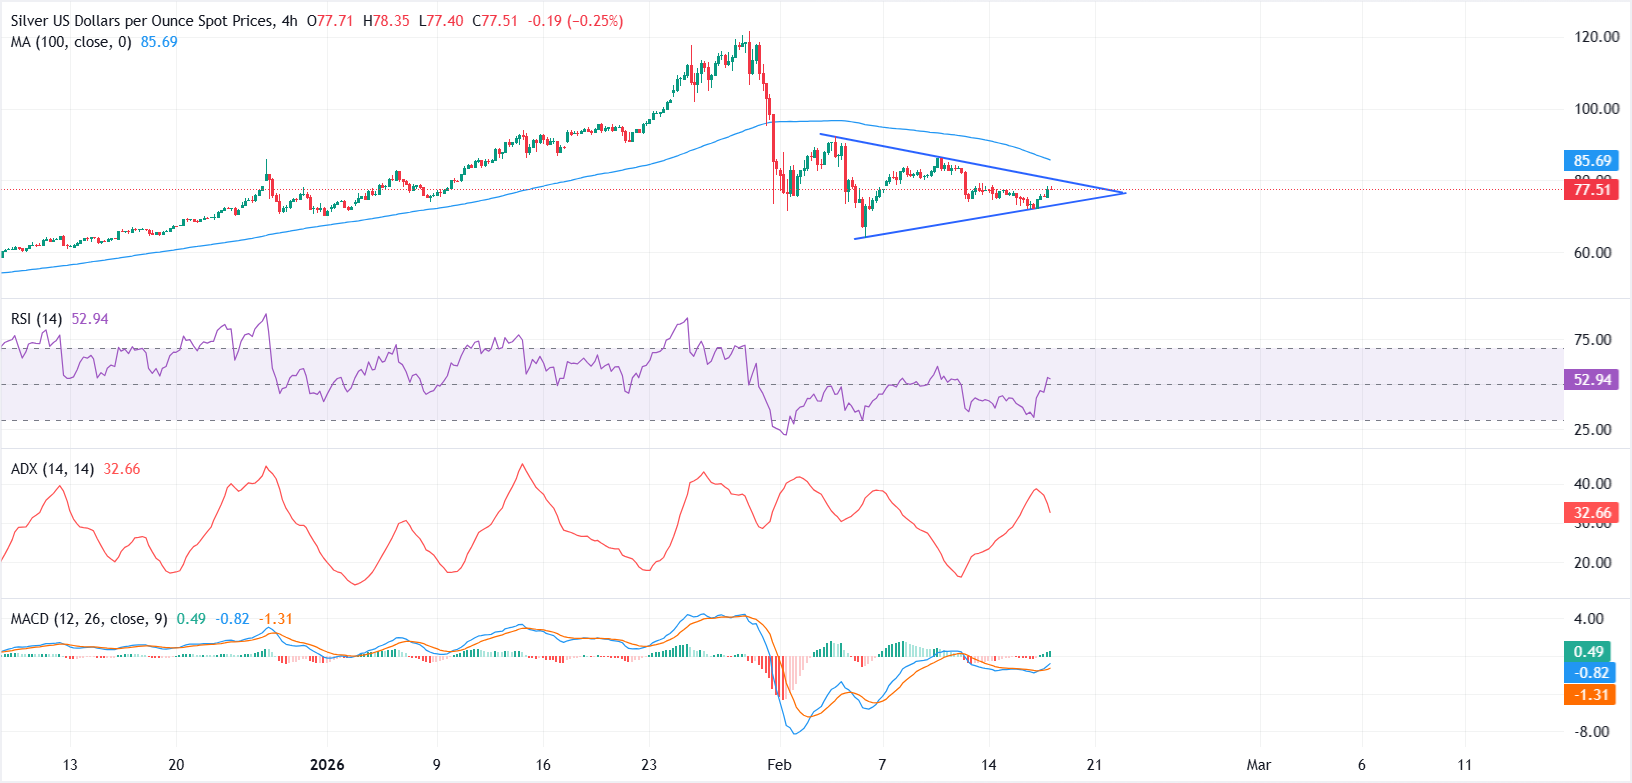
From a technical perspective, the 4-hour chart is starting to turn constructive. XAG/USD is forming a triangle pattern, with price action compressing and volatility narrowing, increasing the risk of a breakout in either direction.
Momentum indicators are beginning to tilt in favor of the bulls. The Moving Average Convergence Divergence (MACD) has crossed into positive territory and remains above its signal line, pointing to improving upside momentum.
Meanwhile, the Relative Strength Index (RSI) is holding near 55, firming above the neutral 50 mark and suggesting strengthening buying pressure.
On the upside, immediate resistance stands near the upper boundary of the triangle around the $80.00 psychological mark. A break above this level could pave the way toward the 100-period SMA at $85.69. However, the near-term bias remains tilted to the downside unless price clears that moving average decisively.
On the downside, a break below the lower boundary of the triangle could expose the recent correction low near $64.00, which may act as the next key support level.
Silver FAQs
Silver is a precious metal highly traded among investors. It has been historically used as a store of value and a medium of exchange. Although less popular than Gold, traders may turn to Silver to diversify their investment portfolio, for its intrinsic value or as a potential hedge during high-inflation periods. Investors can buy physical Silver, in coins or in bars, or trade it through vehicles such as Exchange Traded Funds, which track its price on international markets.
Silver prices can move due to a wide range of factors. Geopolitical instability or fears of a deep recession can make Silver price escalate due to its safe-haven status, although to a lesser extent than Gold's. As a yieldless asset, Silver tends to rise with lower interest rates. Its moves also depend on how the US Dollar (USD) behaves as the asset is priced in dollars (XAG/USD). A strong Dollar tends to keep the price of Silver at bay, whereas a weaker Dollar is likely to propel prices up. Other factors such as investment demand, mining supply – Silver is much more abundant than Gold – and recycling rates can also affect prices.
Silver is widely used in industry, particularly in sectors such as electronics or solar energy, as it has one of the highest electric conductivity of all metals – more than Copper and Gold. A surge in demand can increase prices, while a decline tends to lower them. Dynamics in the US, Chinese and Indian economies can also contribute to price swings: for the US and particularly China, their big industrial sectors use Silver in various processes; in India, consumers’ demand for the precious metal for jewellery also plays a key role in setting prices.
Silver prices tend to follow Gold's moves. When Gold prices rise, Silver typically follows suit, as their status as safe-haven assets is similar. The Gold/Silver ratio, which shows the number of ounces of Silver needed to equal the value of one ounce of Gold, may help to determine the relative valuation between both metals. Some investors may consider a high ratio as an indicator that Silver is undervalued, or Gold is overvalued. On the contrary, a low ratio might suggest that Gold is undervalued relative to Silver.

超过一百万用户依赖 FXStreet 获取实时市场数据、图表工具、专家洞见和外汇新闻。其全面的经济日历和教育网络研讨会帮助交易者保持信息领先、做出审慎决策。FXStreet 拥有约 60 人的团队,分布在巴塞罗那总部及全球各地区。
阅读更多


