
Silver Price Forecast: XAG/USD floats near $70 capped by 100-day SMA
作者 Christian Borjon Valencia
更新: 30 Mar 2026


热门文章
Silver price consolidates around the $70.00 mark for the third straight trading day, range-bound between $67.50 and $71.50, as buyers and sellers remain unable to push prices outside the range.
- Silver trades sideways between $67.50 and $71.50 for third day.
- RSI remains below 50, keeping short-term bias tilted bearish.
- Break below $60 exposes 200-day SMA and deeper downside levels.
Silver price consolidates around the $70.00 mark for the third straight trading day, range-bound between $67.50 and $71.50, as buyers and sellers remain unable to push prices outside the range.
XAG/USD Price Forecast: Technical Outlook
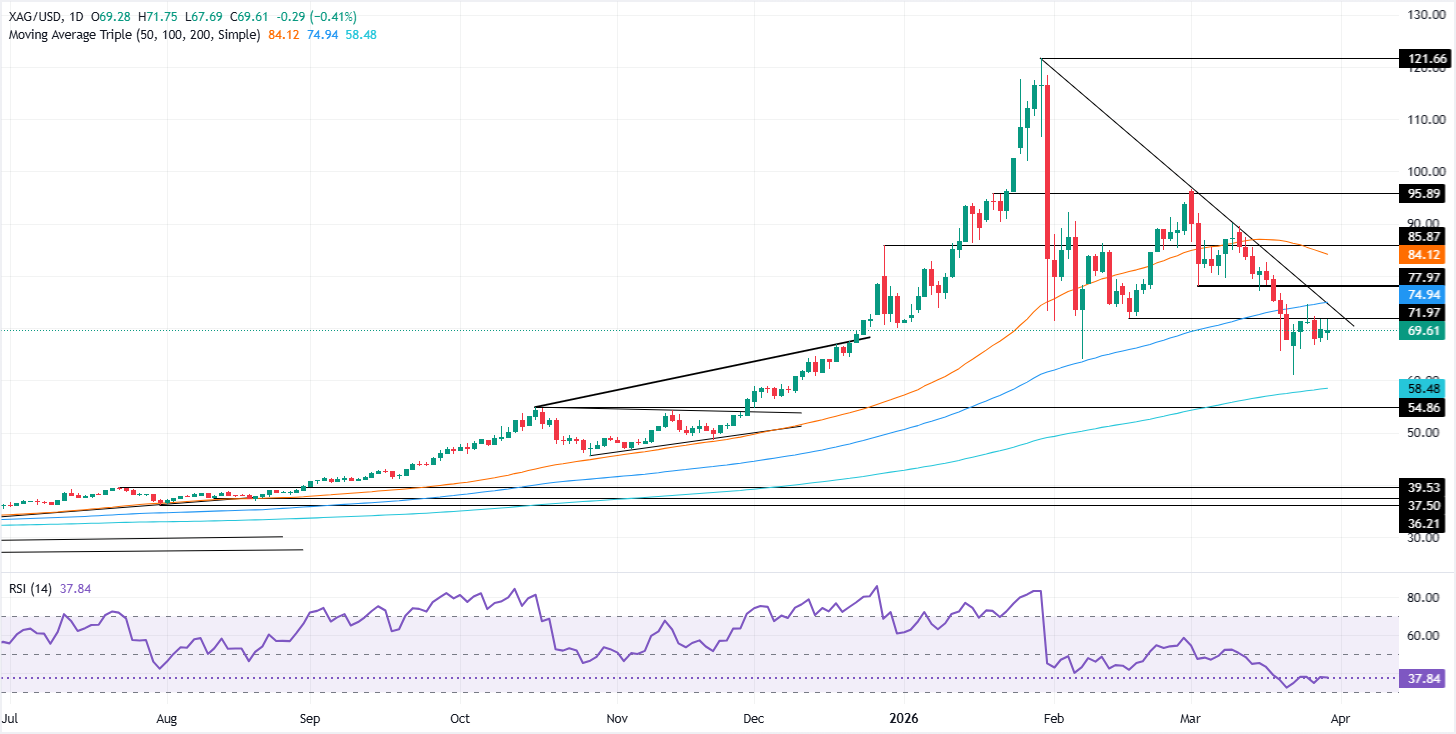
The bias in the short term is slightly bearish, with XAG/USD capped on the upside by the 100-day SMA at $74.11 and on the downside by the March 23 swing low at $61.02.
Silver, since peaking at $96.39 on March 2, has printed a successive series of lower highs and lower lows, but the downtrend stalled as sellers failed to clear the $61.00 mark. Once XAG/USD bounced back towards the $70.00 milestone, it consolidated, suggesting neither buyers nor sellers are in control.
The Relative Strength Index (RSI) is bearish, and as long as it remains below its 50-neutral level, sellers could remain hopeful of driving prices lower.
If XAG/USD tumbles below $60.00, the next area of interest would be the 200-day SMA at $57.85.Once cleared, the next stop would be the $55.00 ahead of the $50.00 milestone.
Conversely, if Silver surpasses $71.50, the next key resistance would be the 100-day SMA at $74.11. A breach of the latter will expose the 20-day SMA at $77.05, ahead of the $80.00 milestone.
XAG/USD Price Chart – Daily
Silver FAQs
Silver is a precious metal highly traded among investors. It has been historically used as a store of value and a medium of exchange. Although less popular than Gold, traders may turn to Silver to diversify their investment portfolio, for its intrinsic value or as a potential hedge during high-inflation periods. Investors can buy physical Silver, in coins or in bars, or trade it through vehicles such as Exchange Traded Funds, which track its price on international markets.
Silver prices can move due to a wide range of factors. Geopolitical instability or fears of a deep recession can make Silver price escalate due to its safe-haven status, although to a lesser extent than Gold's. As a yieldless asset, Silver tends to rise with lower interest rates. Its moves also depend on how the US Dollar (USD) behaves as the asset is priced in dollars (XAG/USD). A strong Dollar tends to keep the price of Silver at bay, whereas a weaker Dollar is likely to propel prices up. Other factors such as investment demand, mining supply – Silver is much more abundant than Gold – and recycling rates can also affect prices.
Silver is widely used in industry, particularly in sectors such as electronics or solar energy, as it has one of the highest electric conductivity of all metals – more than Copper and Gold. A surge in demand can increase prices, while a decline tends to lower them. Dynamics in the US, Chinese and Indian economies can also contribute to price swings: for the US and particularly China, their big industrial sectors use Silver in various processes; in India, consumers’ demand for the precious metal for jewellery also plays a key role in setting prices.
Silver prices tend to follow Gold's moves. When Gold prices rise, Silver typically follows suit, as their status as safe-haven assets is similar. The Gold/Silver ratio, which shows the number of ounces of Silver needed to equal the value of one ounce of Gold, may help to determine the relative valuation between both metals. Some investors may consider a high ratio as an indicator that Silver is undervalued, or Gold is overvalued. On the contrary, a low ratio might suggest that Gold is undervalued relative to Silver.

超过一百万用户依赖 FXStreet 获取实时市场数据、图表工具、专家洞见和外汇新闻。其全面的经济日历和教育网络研讨会帮助交易者保持信息领先、做出审慎决策。FXStreet 拥有约 60 人的团队,分布在巴塞罗那总部及全球各地区。
阅读更多


