
Silver Price Forecast: XAG/USD struggles to regain momentum below 50-day SMA
作者 Vishal Chaturvedi
更新: 2 Jun 2026


热门文章

Silver (XAG/USD) pulls back from intraday highs on Tuesday as the US Dollar (USD) rebounds amid lingering uncertainty over whether the United States and Iran can reach a deal to end the three-month-old war.
- Silver pulls back from intraday highs on Tuesday as the US Dollar rebounds.
- Rising Oil-driven inflation concerns continue to support hawkish Fed expectations.
- XAG/USD remains on the defensive below its 50- and 100-day SMAs.
Silver (XAG/USD) pulls back from intraday highs on Tuesday as the US Dollar (USD) rebounds amid lingering uncertainty over whether the United States and Iran can reach a deal to end the three-month-old war. At the time of writing, XAG/USD trades around $75 after touching a daily high near $77 earlier in the session.
Price action remains largely driven by geopolitical headlines and the Federal Reserve’s (Fed) interest rate outlook. Iran’s semi-official Fars News Agency reported that exchanges between Tehran and Washington have been paused for at least a few days over the proposed MoU.
Rising Oil-driven inflation concerns continue to support hawkish Federal Reserve (Fed) expectations, limiting upside in Silver. Higher interest rates tend to reduce the appeal of non-yielding assets.
Although the worst of the conflict appears to be over, the fragile ceasefire announced earlier in April continues to hold. Still, slow progress toward a peace deal that would reopen the Strait of Hormuz keeps markets cautious and leaves Silver largely trapped within a two-week range.
Technical Analysis:
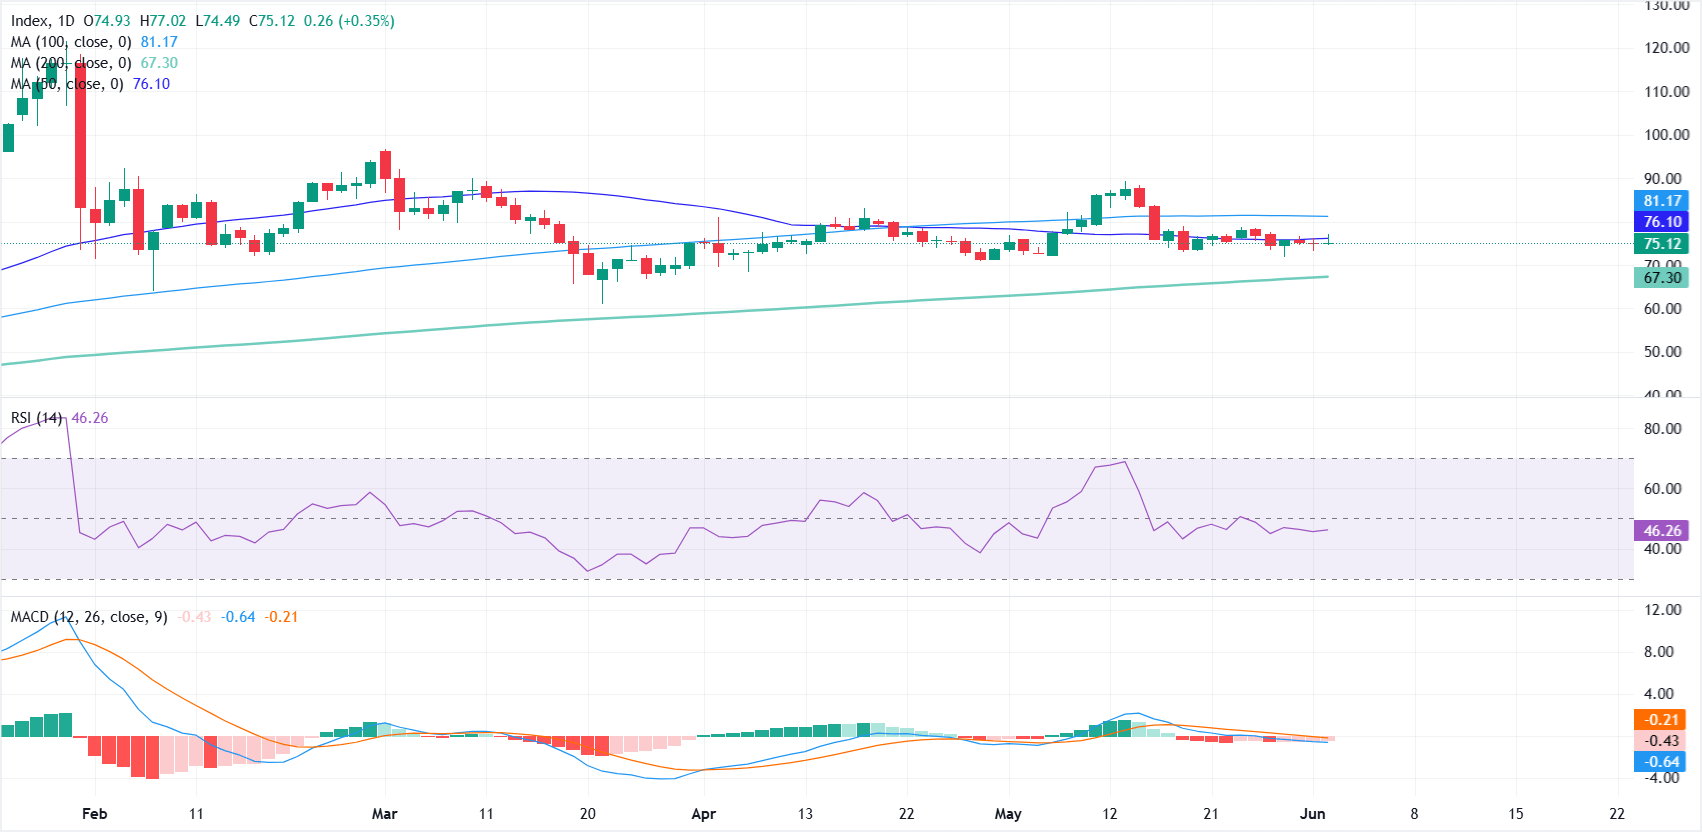
On the daily chart, XAG/USD maintains a bearish near-term bias, holding below the 50- and 100-day Simple Moving Averages (SMAs).
The Relative Strength Index (RSI) at 46 hovers in neutral territory and the Moving Average Convergence Divergence (MACD) indicator remains in negative territory, together suggesting subdued upside momentum and reinforcing the idea that rallies are likely to face supply into nearby moving-average resistance.
On the topside, immediate resistance is seen at the 50-day SMA around $76.10, with a break there exposing the next hurdle at the 100-day SMA near $81.17.
On the downside, the first meaningful structural support does not emerge until the 200-day SMA at $67.30, where longer-term buyers could look to defend the broader bullish cycle if the current pullback extends.
(The technical analysis of this story was written with the help of an AI tool.)
US Dollar Price Today
The table below shows the percentage change of US Dollar (USD) against listed major currencies today. US Dollar was the strongest against the Japanese Yen.
| USD | EUR | GBP | JPY | CAD | AUD | NZD | CHF | |
|---|---|---|---|---|---|---|---|---|
| USD | 0.04% | -0.07% | 0.16% | -0.05% | -0.27% | 0.16% | 0.15% | |
| EUR | -0.04% | -0.11% | 0.13% | -0.11% | -0.30% | 0.12% | 0.10% | |
| GBP | 0.07% | 0.11% | 0.22% | -0.00% | -0.16% | 0.24% | 0.18% | |
| JPY | -0.16% | -0.13% | -0.22% | -0.21% | -0.41% | -0.01% | -0.04% | |
| CAD | 0.05% | 0.11% | 0.00% | 0.21% | -0.20% | 0.21% | 0.16% | |
| AUD | 0.27% | 0.30% | 0.16% | 0.41% | 0.20% | 0.40% | 0.35% | |
| NZD | -0.16% | -0.12% | -0.24% | 0.00% | -0.21% | -0.40% | -0.06% | |
| CHF | -0.15% | -0.10% | -0.18% | 0.04% | -0.16% | -0.35% | 0.06% |
The heat map shows percentage changes of major currencies against each other. The base currency is picked from the left column, while the quote currency is picked from the top row. For example, if you pick the US Dollar from the left column and move along the horizontal line to the Japanese Yen, the percentage change displayed in the box will represent USD (base)/JPY (quote).

超过一百万用户依赖 FXStreet 获取实时市场数据、图表工具、专家洞见和外汇新闻。其全面的经济日历和教育网络研讨会帮助交易者保持信息领先、做出审慎决策。FXStreet 拥有约 60 人的团队,分布在巴塞罗那总部及全球各地区。
阅读更多


