
Silver Price Forecast: XAG/USD wobbles around $75 in countdown to US-Iran talks
作者 Sagar Dua
更新: 10 Apr 2026


热门文章

Silver price (XAG/USD) trades in a tight range around $75.00 during the European trading session on Friday.
- Silver price consolidates around $75.00 as investors await the outcome of US-Iran talks.
- Investors also await the release of the US CPI data for March.
- Traders might raise dovish Fed bets if Iran agrees to permanent Hormuz reopening.
Silver price (XAG/USD) trades in a tight range around $75.00 during the European trading session on Friday. The white metal consolidates as investors await the United States (US) Consumer Price Index (CPI) data for March and the outcome of negotiations between the United States (US) and Iran on a permanent ceasefire in the Middle East, which are scheduled in Pakistan over the weekend.
According to estimates, the US headline CPI grew strongly by 3.3% Year-on-Year (YoY) against the previous reading of 2.4%. The core CPI – which strips off volatile food and energy items – rose at a faster pace of 2.7% against 2.5% in February.
There is no guarantee of the US inflation data influencing market expectations for the Federal Reserve’s (Fed) monetary policy outlook, even as figures turn out to be stronger-than-projected, as the data would be counted a one-off, if Iran agrees to no interference on the Strait of Hormuz permanently after negotiations with Washington.
However, the 10-point peace proposal delivered by Iran for a permanent ceasefire and the Hormuz reopening requires Tehran’s authorial recognition on the passage.
Meanwhile, a negative outcome of US-Iran talks would prompt global inflation expectations further and force traders to raise hawkish Fed bets for upcoming policy meetings.
Theoretically, hawkish Fed expectations bode poorly for non-yielding assets, such as Silver.
Silver technical analysis
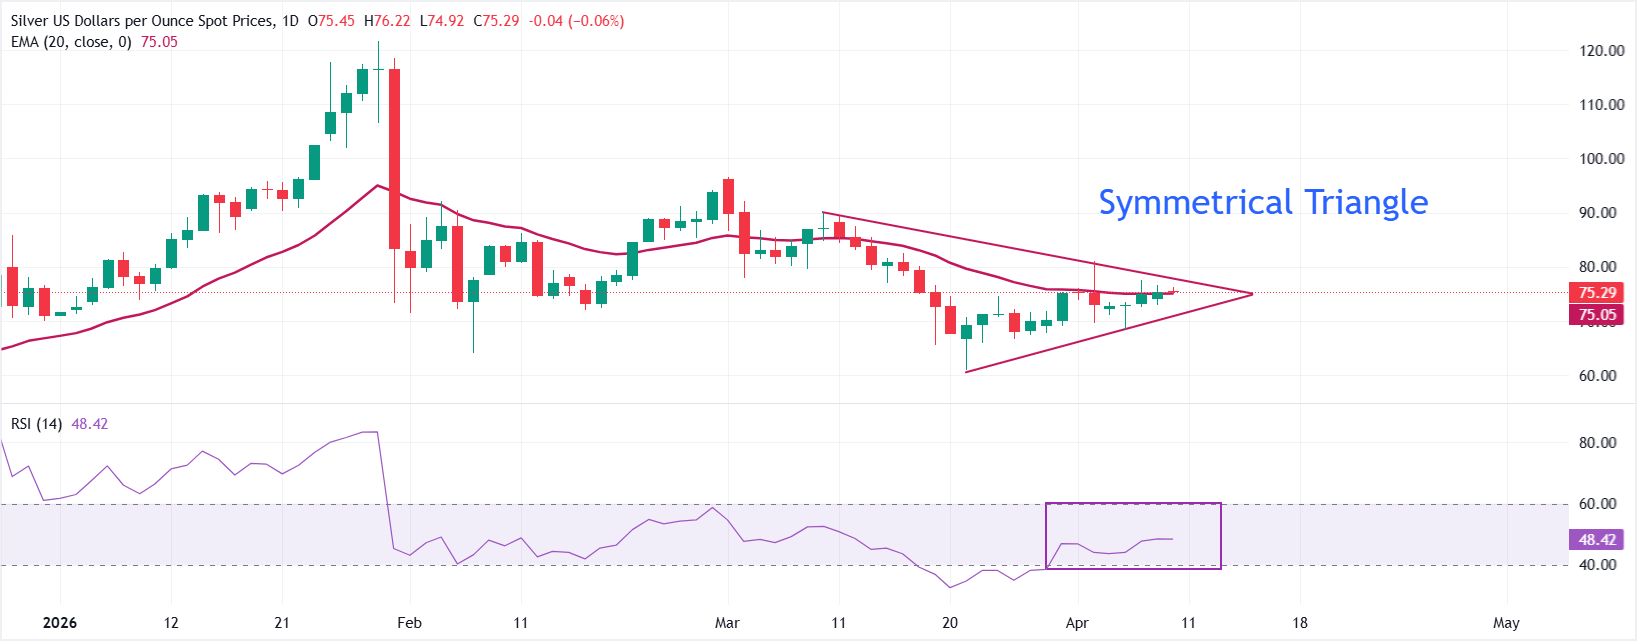
XAG/USD trades flat around $75.00 at the press time, with a broadly neutral near-term bias, as the price is close to the 20-day exponential moving average (EMA) at $75.06. The formation of a Symmetrical Triangle formation on a daily timeframe suggests consolidation rather than a clear directional push, while the Relative Strength Index (14) inside the 40.00-60.00 zone hints at balanced momentum after prior corrective pressure.
On the topside, initial resistance is defined by the descending trend line near $77.00, and a daily close above this barrier would be needed to reopen room toward higher levels. On the downside, immediate support is seen at the rising border of the triangle pattern around $71.37; a break beneath that latter zone would weaken the broader constructive structure and expose deeper retracement towards $70.00, followed by the March 26 low of $66.71.
(The technical analysis of this story was written with the help of an AI tool.)
Silver FAQs
Silver is a precious metal highly traded among investors. It has been historically used as a store of value and a medium of exchange. Although less popular than Gold, traders may turn to Silver to diversify their investment portfolio, for its intrinsic value or as a potential hedge during high-inflation periods. Investors can buy physical Silver, in coins or in bars, or trade it through vehicles such as Exchange Traded Funds, which track its price on international markets.
Silver prices can move due to a wide range of factors. Geopolitical instability or fears of a deep recession can make Silver price escalate due to its safe-haven status, although to a lesser extent than Gold's. As a yieldless asset, Silver tends to rise with lower interest rates. Its moves also depend on how the US Dollar (USD) behaves as the asset is priced in dollars (XAG/USD). A strong Dollar tends to keep the price of Silver at bay, whereas a weaker Dollar is likely to propel prices up. Other factors such as investment demand, mining supply – Silver is much more abundant than Gold – and recycling rates can also affect prices.
Silver is widely used in industry, particularly in sectors such as electronics or solar energy, as it has one of the highest electric conductivity of all metals – more than Copper and Gold. A surge in demand can increase prices, while a decline tends to lower them. Dynamics in the US, Chinese and Indian economies can also contribute to price swings: for the US and particularly China, their big industrial sectors use Silver in various processes; in India, consumers’ demand for the precious metal for jewellery also plays a key role in setting prices.
Silver prices tend to follow Gold's moves. When Gold prices rise, Silver typically follows suit, as their status as safe-haven assets is similar. The Gold/Silver ratio, which shows the number of ounces of Silver needed to equal the value of one ounce of Gold, may help to determine the relative valuation between both metals. Some investors may consider a high ratio as an indicator that Silver is undervalued, or Gold is overvalued. On the contrary, a low ratio might suggest that Gold is undervalued relative to Silver.

超过一百万用户依赖 FXStreet 获取实时市场数据、图表工具、专家洞见和外汇新闻。其全面的经济日历和教育网络研讨会帮助交易者保持信息领先、做出审慎决策。FXStreet 拥有约 60 人的团队,分布在巴塞罗那总部及全球各地区。
阅读更多


