
Solana Price Forecast: SOL consolidates as spot ETF inflows near $1 billion signal institutional dip-buying
作者 Manish Chhetri
发布日期: 15 Dec 2025 | 修改日期: 15 Dec 2025


热门文章

Solana (SOL) price hovers above $131 at the time of writing on Monday, nearing the upper boundary of a falling wedge pattern, awaiting a decisive breakout.
- Solana price is nearing the upper trendline of a falling wedge pattern on Monday, breakout suggests a rally ahead.
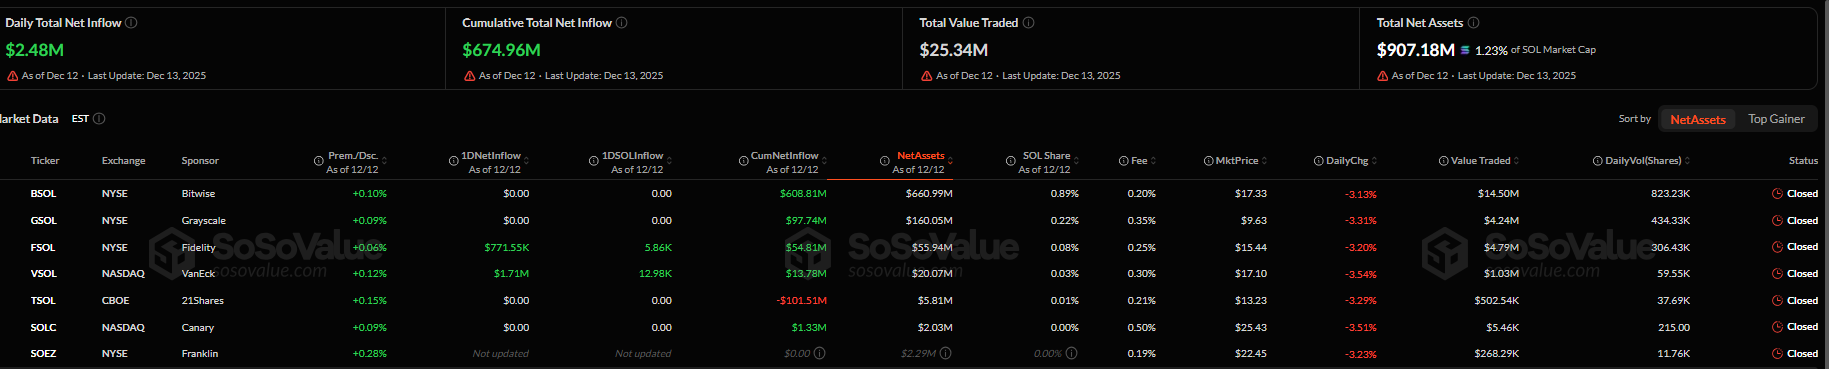
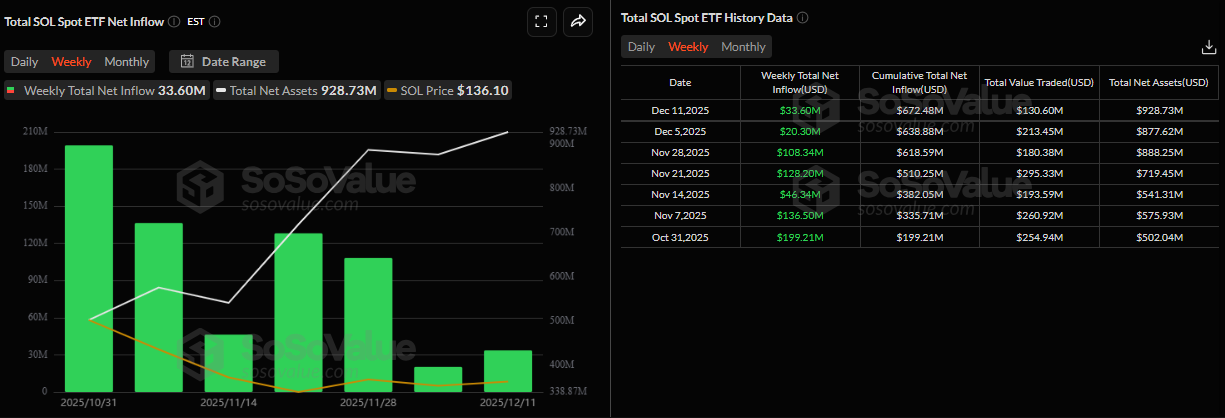
- US-listed spot Solana ETFs have recorded weekly net inflows since October 31, bringing total AUM to nearly $1 billion.
- The technical outlook favors an upside breakout, with a target above $160.
Solana (SOL) price hovers above $131 at the time of writing on Monday, nearing the upper boundary of a falling wedge pattern, awaiting a decisive breakout. On the institutional side, demand for spot Solana Exchange-Traded Funds (ETFs) remained firm, pushing total assets under management (AUM) to nearly $1 billion since launch. Moreover, the technical outlook suggests a potential upside breakout, with bulls aiming for levels above $160.
Institutional investors keep accumulating SOL
The institutional demand for SOL continues to grow since its launch on October 28. SoSoValue data shows that spot Solana ETFs have recorded positive net inflows every week since their launch, with total net assets reaching $907.18 million on Monday. This persistent ETF inflow, despite recent price consolidation, suggests institutions are buying dips rather than exiting positions, signaling a bullish outlook for SOL.
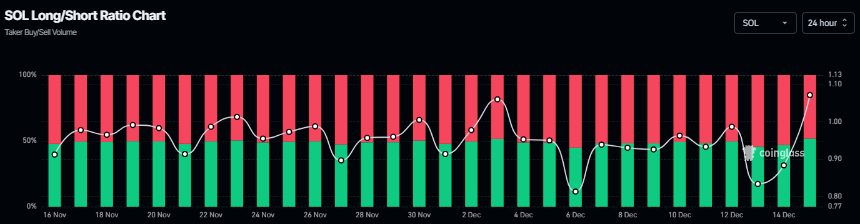
On the derivatives side, CoinGlass’s long-to-short ratio for SOL reads 1.07, the highest level in over a month. The ratio above one suggests bullish sentiment in the market, as traders are betting on the asset price to rally.
Solana Price Forecast: SOL on the verge of a breakout
Solana’s price has been trading within a falling wedge pattern (formed by connecting multiple highs and lows with two trendlines since early October). At the time of writing on Monday, SOL nears the upper trendline boundary of this pattern.
If SOL breaks above the pattern, it could extend the rally toward the next daily resistance at $160.
The Relative Strength Index (RSI) on the daily chart reads 42, pointing upward toward the neutral level of 50, indicating fading bearish momentum. For the bullish momentum to be sustained, the RSI must move above the neutral level.
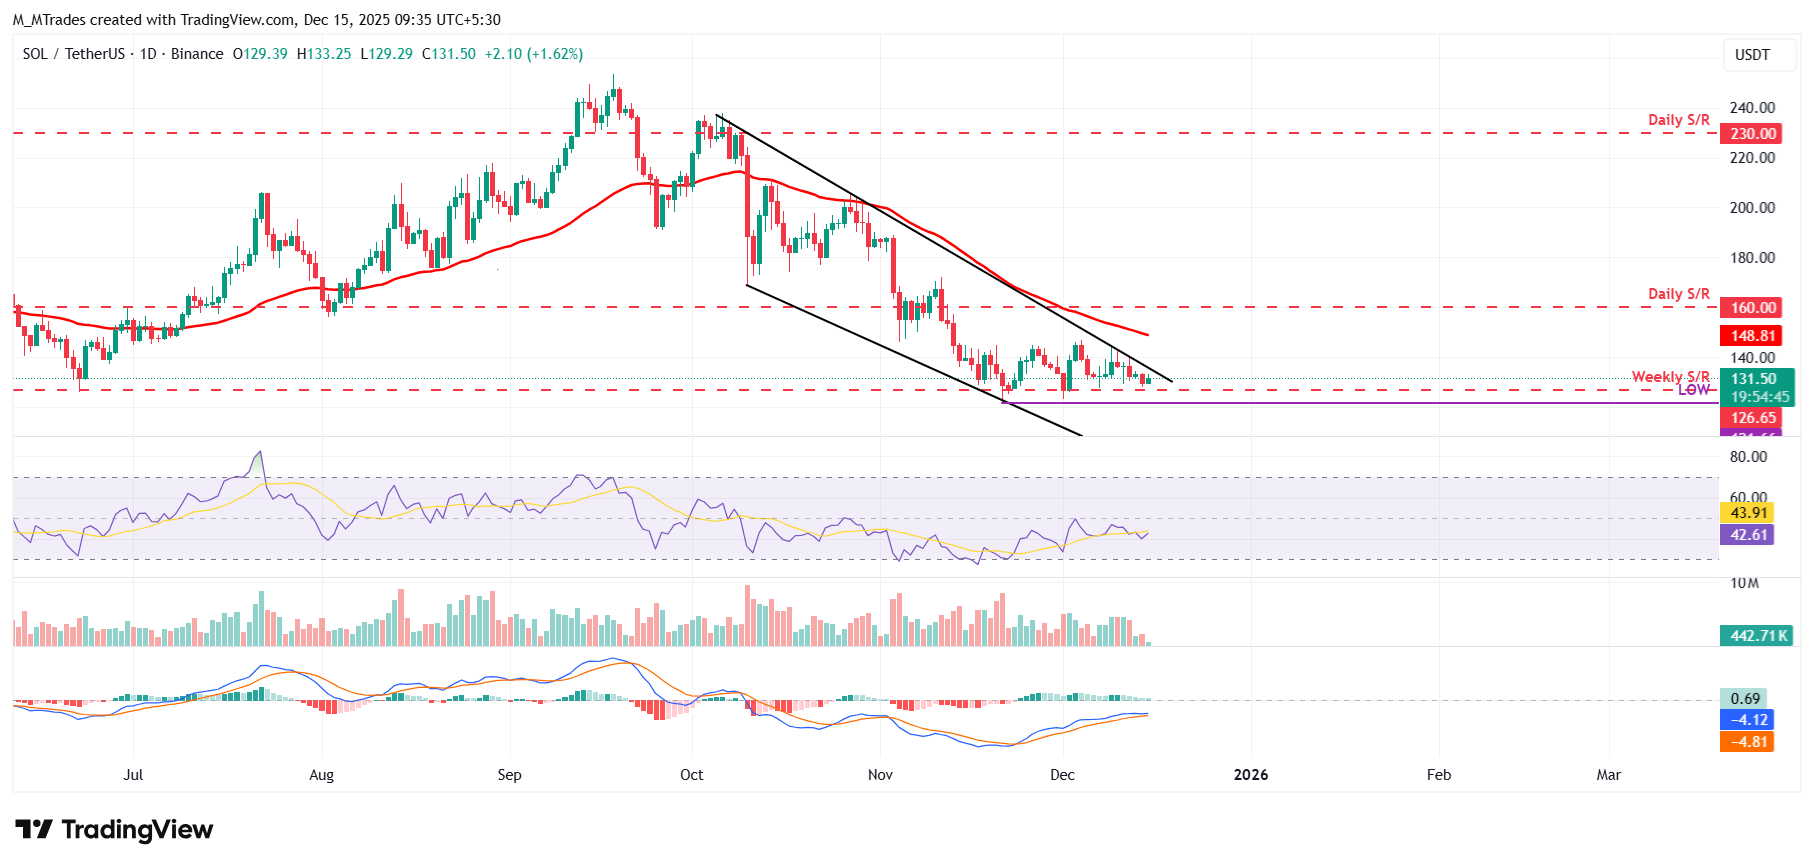
However, if SOL faces a correction, it could extend the decline toward the November 21 low of $121.66.

超过一百万用户依赖 FXStreet 获取实时市场数据、图表工具、专家洞见和外汇新闻。其全面的经济日历和教育网络研讨会帮助交易者保持信息领先、做出审慎决策。FXStreet 拥有约 60 人的团队,分布在巴塞罗那总部及全球各地区。
阅读更多


