

Solana Price Forecast: SOL extends correction amid fresh US-Iran tensions
- Solana extends its correction on Thursday, sliding closer toward the key $80 level.
- Risk sentiment weakens after Iran’s IRGC reportedly targeted a US airbase following a Bandar Abbas strike, escalating fresh Middle East tensions.
- Weakening derivatives metrics alongside strengthening bearish momentum indicators suggest a deeper correction.
Solana (SOL) extends its losses trading toward the $80 mark as of writing on Thursday. The price correction is further supported by the fresh US-Iran tensions weighing on risk sentiment. Weakening derivatives metrics and bearish momentum indicators suggest further correction for SOL in the near term.
Fresh Middle East tensions dampen risk appetite
Risk sentiment weakens on Thursday as the news came in that Iran's Revolutionary Guards have targeted a US airbase after what they described as an early morning US attack near Bandar Abbas airport, reported Reuters.

The report noted that they warned that any repeat of what they called aggression would draw a "more decisive" response and said responsibility for the consequences lay with the "aggressor".
These fresh tensions in the Middle East have dampened investors' risk appetite, with Bitcoin (BTC) falling below $73,000, Solana sliding toward $80, and the broader crypto market trading lower on Thursday.
Derivatives metrics support a bearish bias
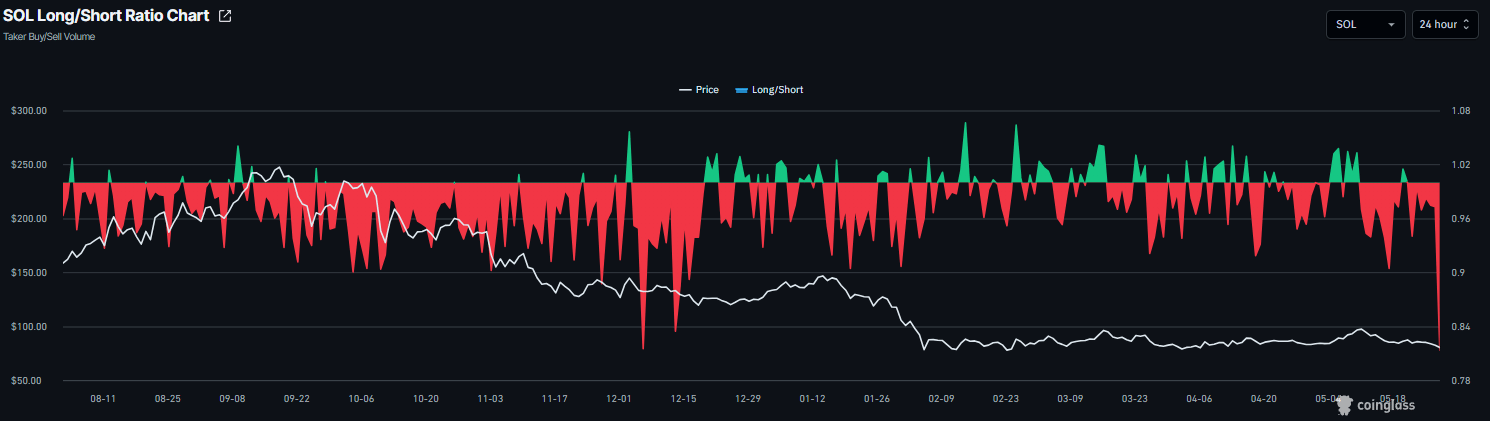
Solana’s derivatives data also supports a negative outlook. CoinGlass’ long-to-short ratio for SOL reads 0.81 on Thursday, the lowest level over a month. The ratio being below one, indicates bearish sentiment, as traders are betting the assets' prices will fall.
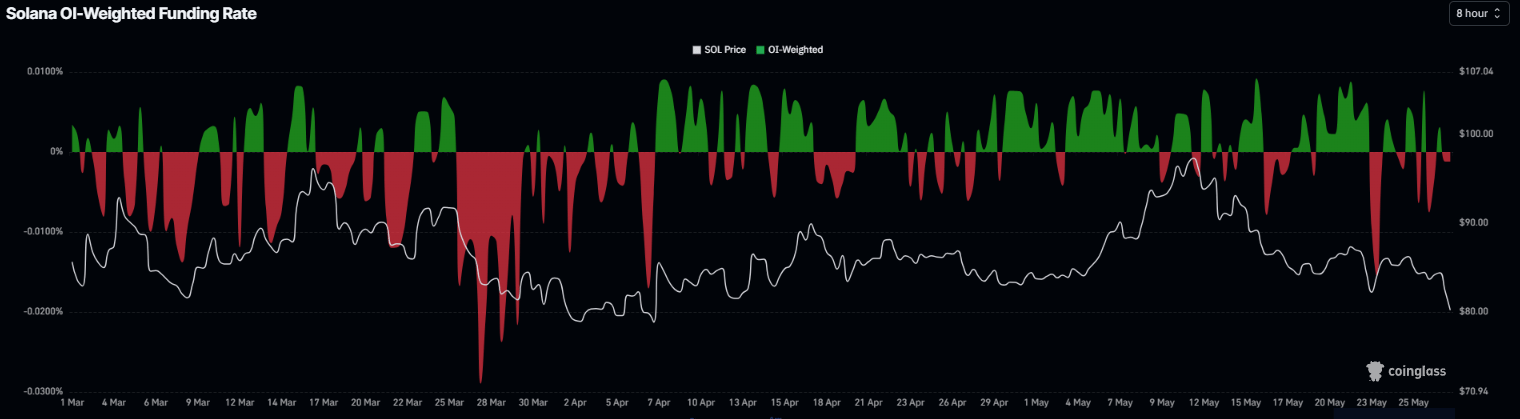
In addition, the funding rates flipped negative, reading -0.0012% on Thursday, indicating that shorts are paying longs and projecting bearish sentiment.
Solana Price Forecast: Bearish momentum indicators
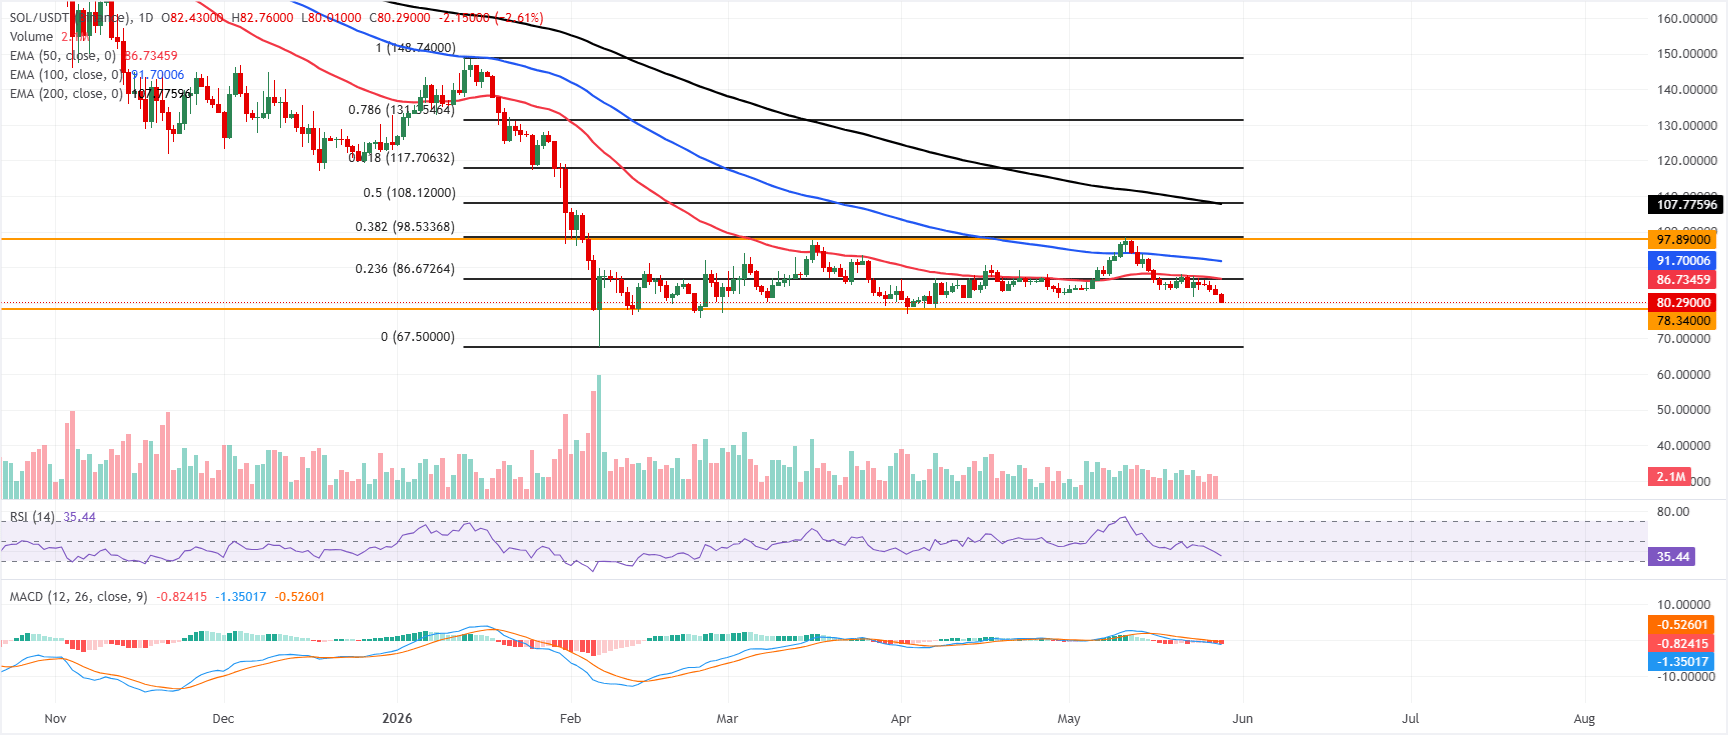
Solana price trades at $80.29, maintaining a bearish near-term bias as it holds below the 50-day, 100-day, and 200-day Exponential Moving Averages (EMAs), which are clustered from roughly $86.73 to $107.77. The Relative Strength Index (RSI) sits near 35, leaning toward oversold territory and suggesting persistent downside pressure, while the Moving Average Convergence Divergence (MACD) remains below its signal line in negative territory with a weak profile, reinforcing the view that bounces are likely to be corrective while SOL trades under this stacked EMA resistance band.
On the topside, initial resistance is seen at the 23.6% Fibonacci retracement at $86.67, closely aligned with the 50-day EMA at $86.73, forming the first significant supply zone, ahead of the 100-day EMA at $91.70. Further up, the horizontal barrier at $97.89 and the 38.2% Fibonacci retracement near $98.53 cap the recovery before the broader bearish structure defined by the 200-day EMA at $107.77 and the 50% retracement at $108.12.
On the downside, immediate support emerges at the horizontal level around $78.34, with a deeper cushion at the Fibonacci anchor near $67.50 if selling resumes and the current floor gives way.
(The technical analysis of this story was written with the help of an AI tool.)














