
Solana Price Forecast: SOL sell-off intensifies as BTC drops to $60,000
作者 Manish Chhetri
发布日期: 6 Feb 2026 | 修改日期: 6 Feb 2026


热门文章

Solana (SOL) price extends its correction, slipping below $70 on Friday after posting losses of over 23% so far this week. The sell-off was fueled by broader weakness in the crypto market, with Bitcoin (BTC) reaching a low of $60,000 on Friday.
- Solana price extends its correction on Friday, reaching a low of $67.50, posting losses over 23% so far this week.
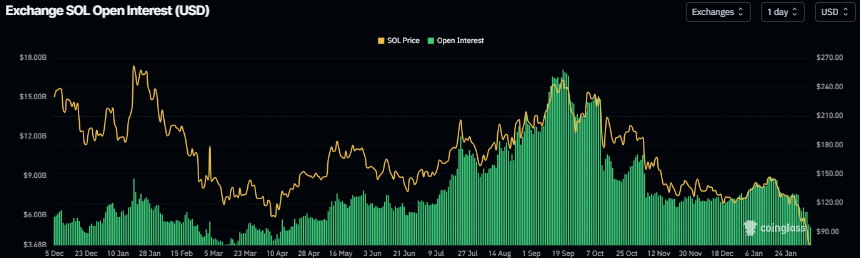
- Derivatives data backs the bearish sentiment as open interest drops to mid-April levels, signaling waning investor participation.
- The technical outlook suggests bears are in control, targeting $60 for SOL.
Solana (SOL) price extends its correction, slipping below $70 on Friday after posting losses of over 23% so far this week. The sell-off was fueled by broader weakness in the crypto market, with Bitcoin (BTC) reaching a low of $60,000 on Friday. The derivatives data shows signs of weakness, with SOL’s Open Interest (OI) dropping to mid-April levels. On the technical side, the outlook is bearish, with bears targeting a deeper correction to $60 for SOL.
Derivatives data shows bearish bias
Solana price started the week on a negative note, extending its fourth consecutive week of losses. SOL has declined more than 43% since mid-January, with nearly 23% of those losses recorded in the current week alone.
Coinglass futures OI for SOL fell to $5 billion on Friday, the lowest level since mid-April 2025, and has been steadily declining from its mid-January 2026 high of nearly $9 billion. This drop in OI reflects waning investor participation and projects a bearish outlook.
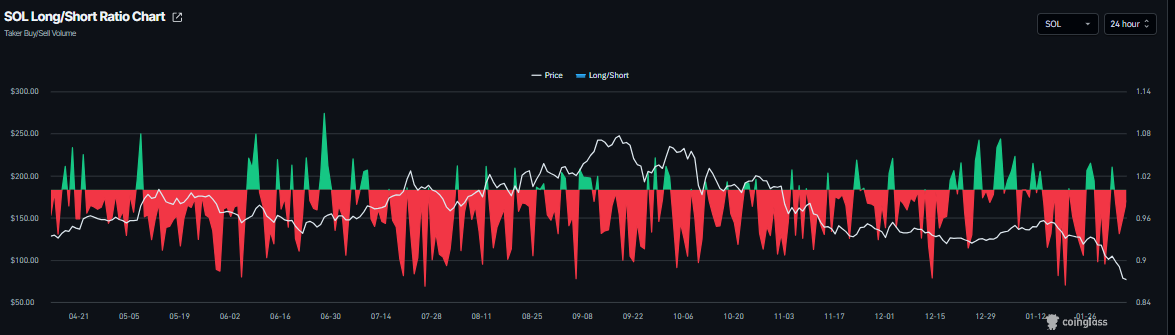
In addition, CoinGlass’s SOL long-to-short ratio stands at 0.96 on Friday. This ratio, below one, reflects bearish sentiment in the markets, as more traders are betting on the asset price to fall.
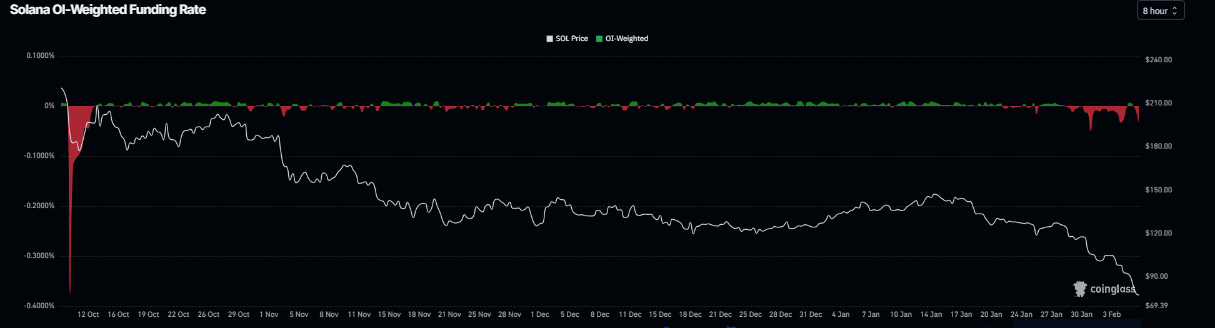
Moreover, Solana’s funding rate data also supports the bearish outlook. The metric has flipped negative on Friday, reading 0.035%, indicating shorts are paying longs and suggesting bearish sentiment toward SOL.
Solana Price Forecast: SOL bears aiming for the $60 mark
Solana price was rejected at the weekly resistance at $126.65 on January 28 and declined by over 21% through Tuesday, closing below the $100 key psychological level. After losing this key level, the sell-off intensified, reaching a low of $67.50 as of Friday.
If Solana continues its downward spiral, it could extend the decline toward the next key psychological level at $60.
The Relative Strength Index (RSI) on the daily chart reads 19, an extreme oversold condition, indicating strong bearish momentum. The Moving Average Convergence Divergence (MACD) also showed a bearish crossover on January 19, which remains intact with rising red histogram bars below the neutral level, further supporting the negative outlook.
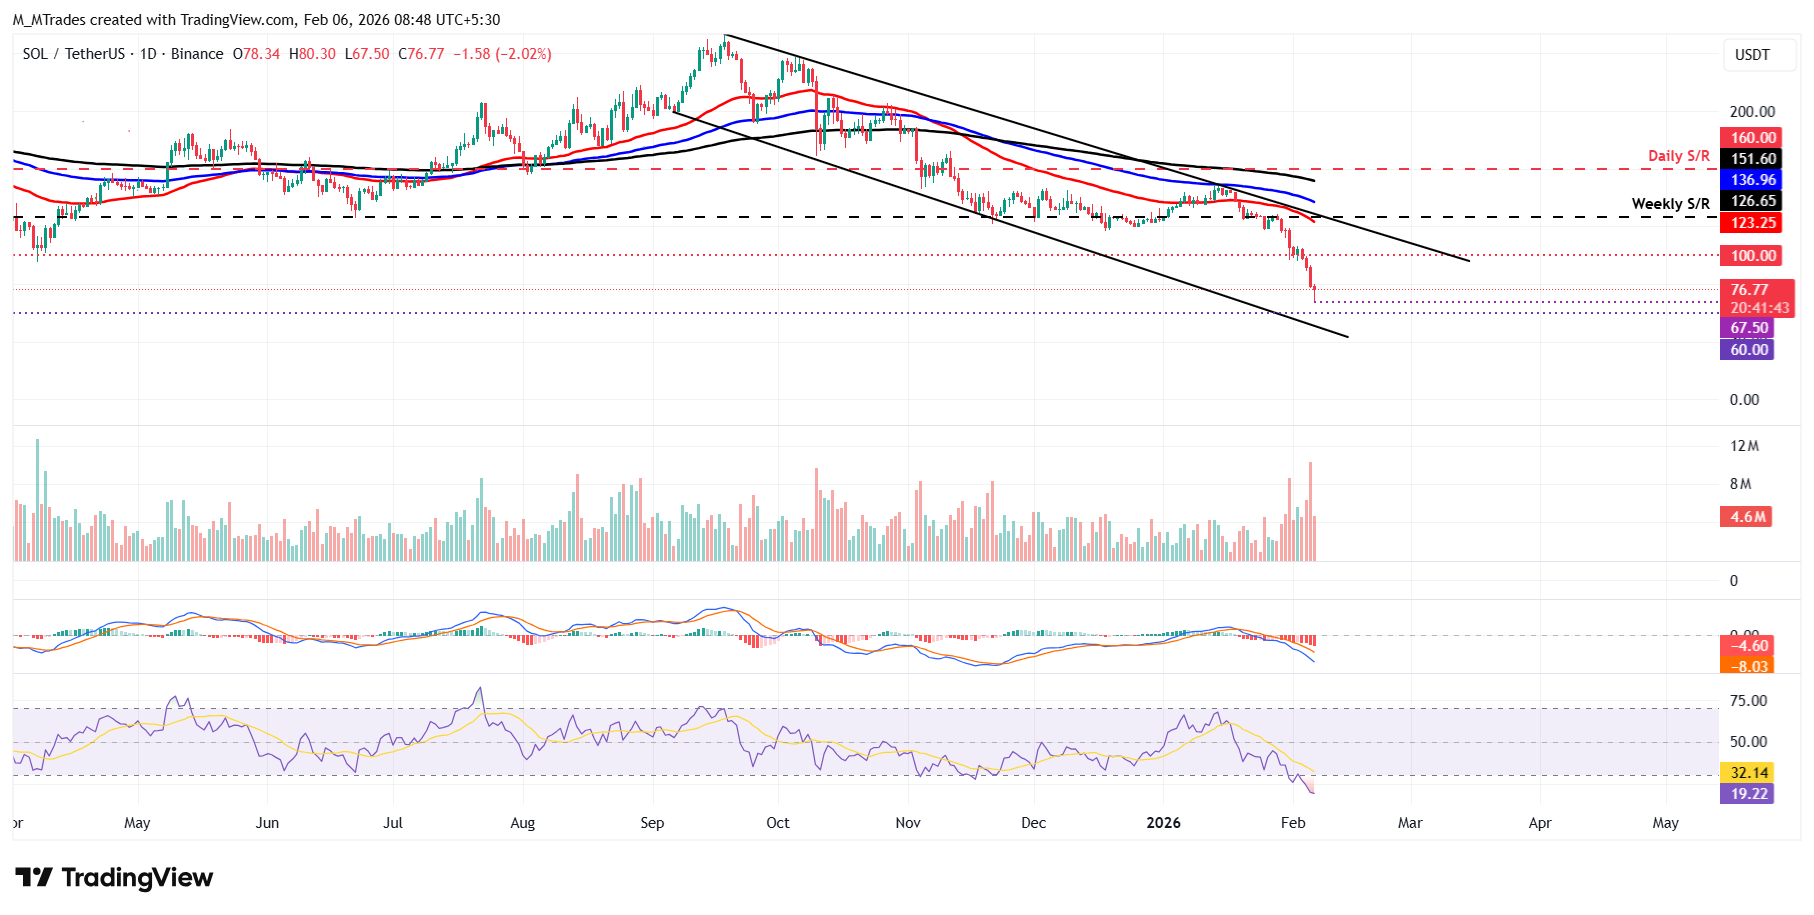
However, if SOL recovers, it could extend the advance toward Wednesday’s low of $89.30.

超过一百万用户依赖 FXStreet 获取实时市场数据、图表工具、专家洞见和外汇新闻。其全面的经济日历和教育网络研讨会帮助交易者保持信息领先、做出审慎决策。FXStreet 拥有约 60 人的团队,分布在巴塞罗那总部及全球各地区。
阅读更多


