
Solana Price Forecast: Strong ETF inflows and bullish derivatives support further upside
作者 Manish Chhetri
更新: 11 May 2026


热门文章

Solana (SOL) trades slightly lower at around $93.82 on Monday, after surging nearly 15% the previous week. This price rally was supported by strong institutional demand, with spot Exchange Traded Funds (ETFs) recording inflows of over $39 million last week.
- Solana edges slightly lower on Monday after rallying nearly 15% the previous week.
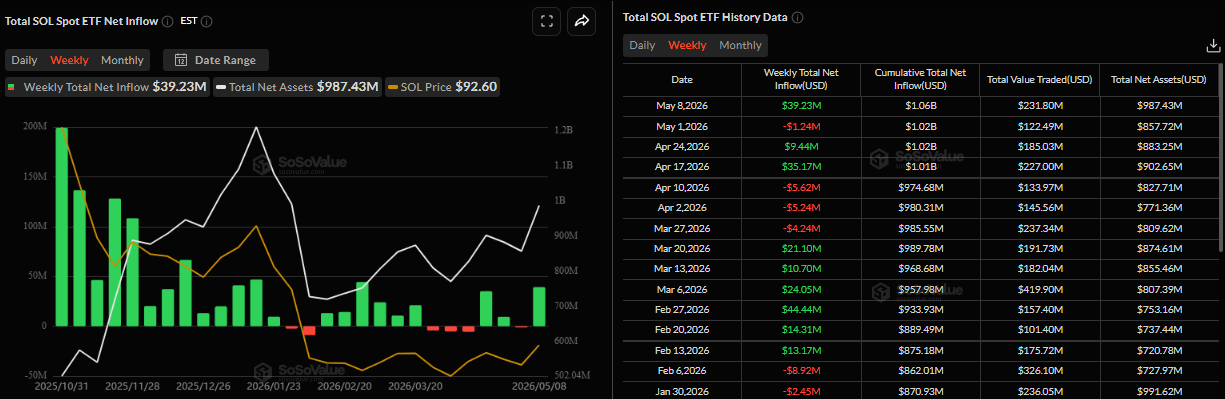
- US-listed Spot SOL ETFs recorded an inflow of $39.23 million last week, the highest weekly inflow since mid-January.
- On-chain and derivatives data support a bullish bias, hinting at further gains ahead.
Solana (SOL) trades slightly lower at around $93.82 on Monday, after surging nearly 15% the previous week. This price rally was supported by strong institutional demand, with spot Exchange Traded Funds (ETFs) recording inflows of over $39 million last week. Meanwhile, strengthening on-chain data and improving derivatives sentiment support further gains in SOL.
Institutional demand remains robust
Institutional demand for SOL remained strong last week. SoSoValue data shows that spot Solana ETFs recorded weekly inflows of $39.23 million, the highest since mid-January. If this inflow continues and intensifies, SOL could see an upside move ahead.
Bullish on-chain and derivatives outlook
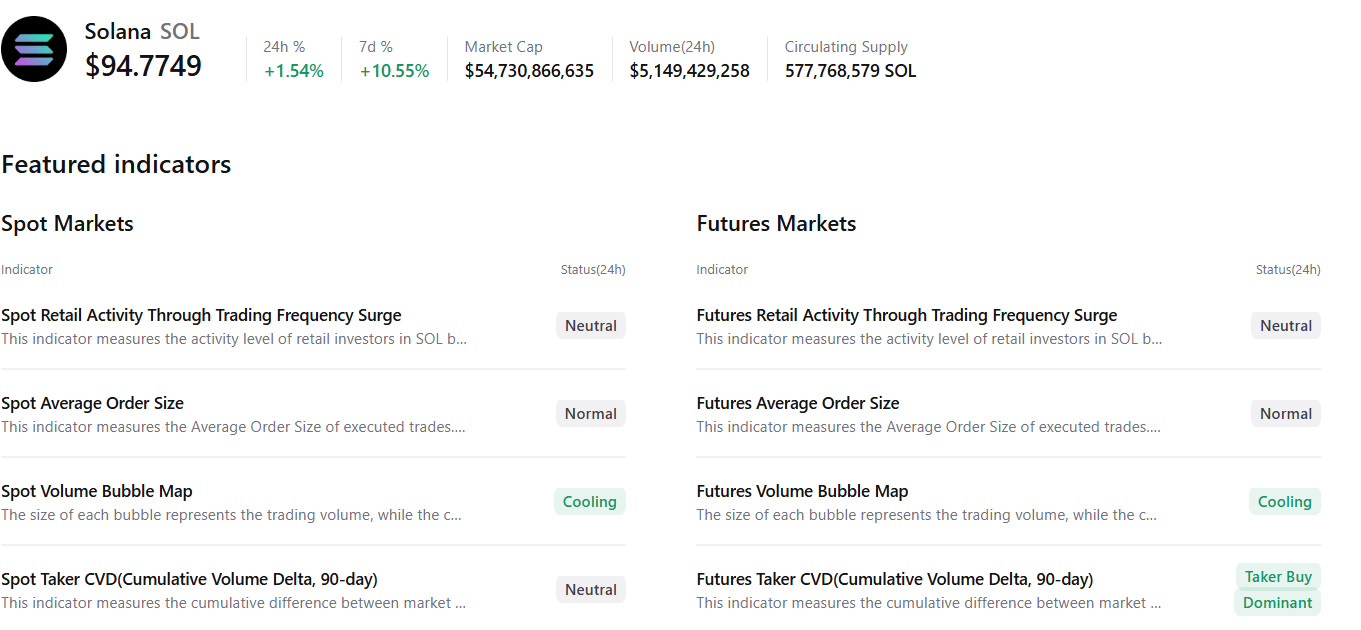
CryptoQuant summary data suggests a mild bullish outlook for Solana. The chart shows cooling conditions in both spot and futures markets, with buy-side dominance in futures, suggesting potential upside, though other metrics show mostly neutral signs.
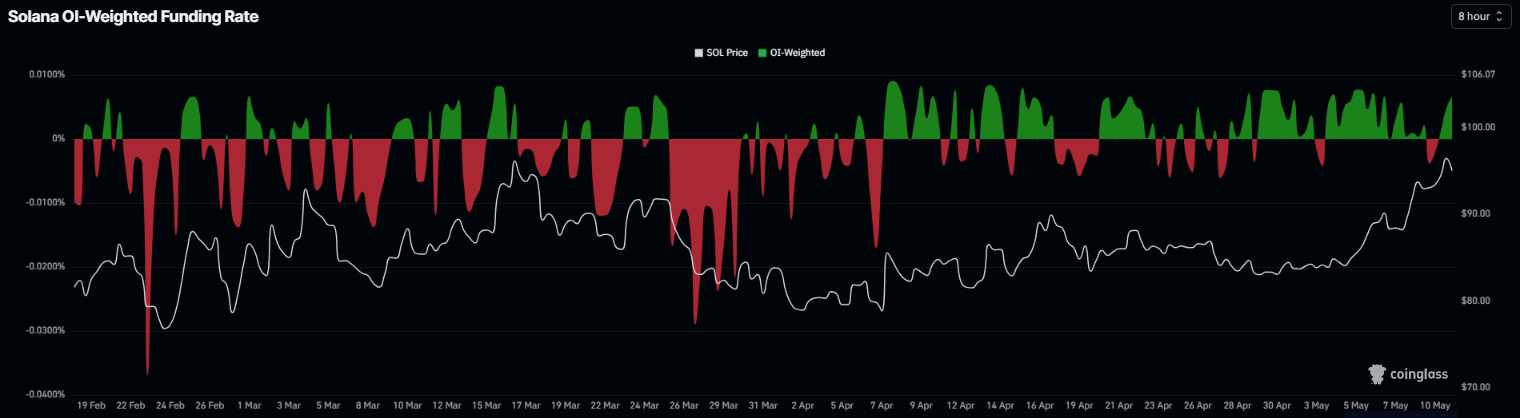
On the derivatives side, metrics also support a positive bias. Solana’s funding rates flipped positive on Sunday and surge to 0.0067% on Monday, indicating that longs are paying shorts. Historically, as shown in the chart below, when the funding rates have flipped from negative to positive and risen, the SOL price has rallied sharply.
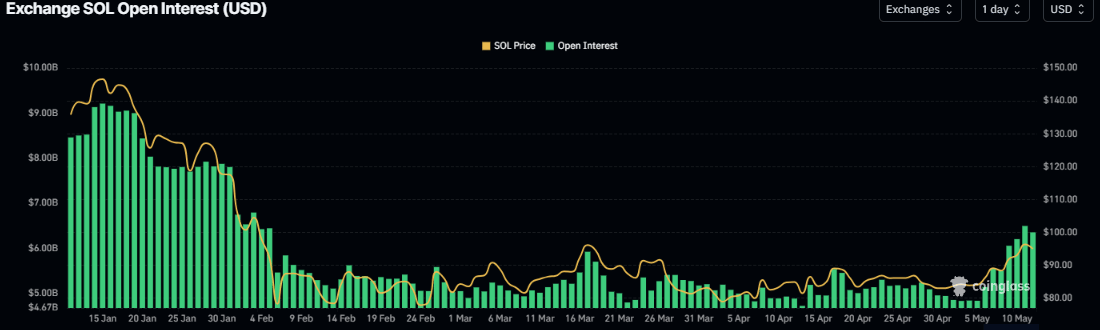
In addition, CoinGlass data shows that futures’ Open Interest (OI) at exchanges in SOL surges to $6.35 billion on Monday from $4.83 billion on May 5, and has been rising steadily since early May. An increasing OI indicates new or additional money entering the market and new buying, which could fuel a rally in Solana price.
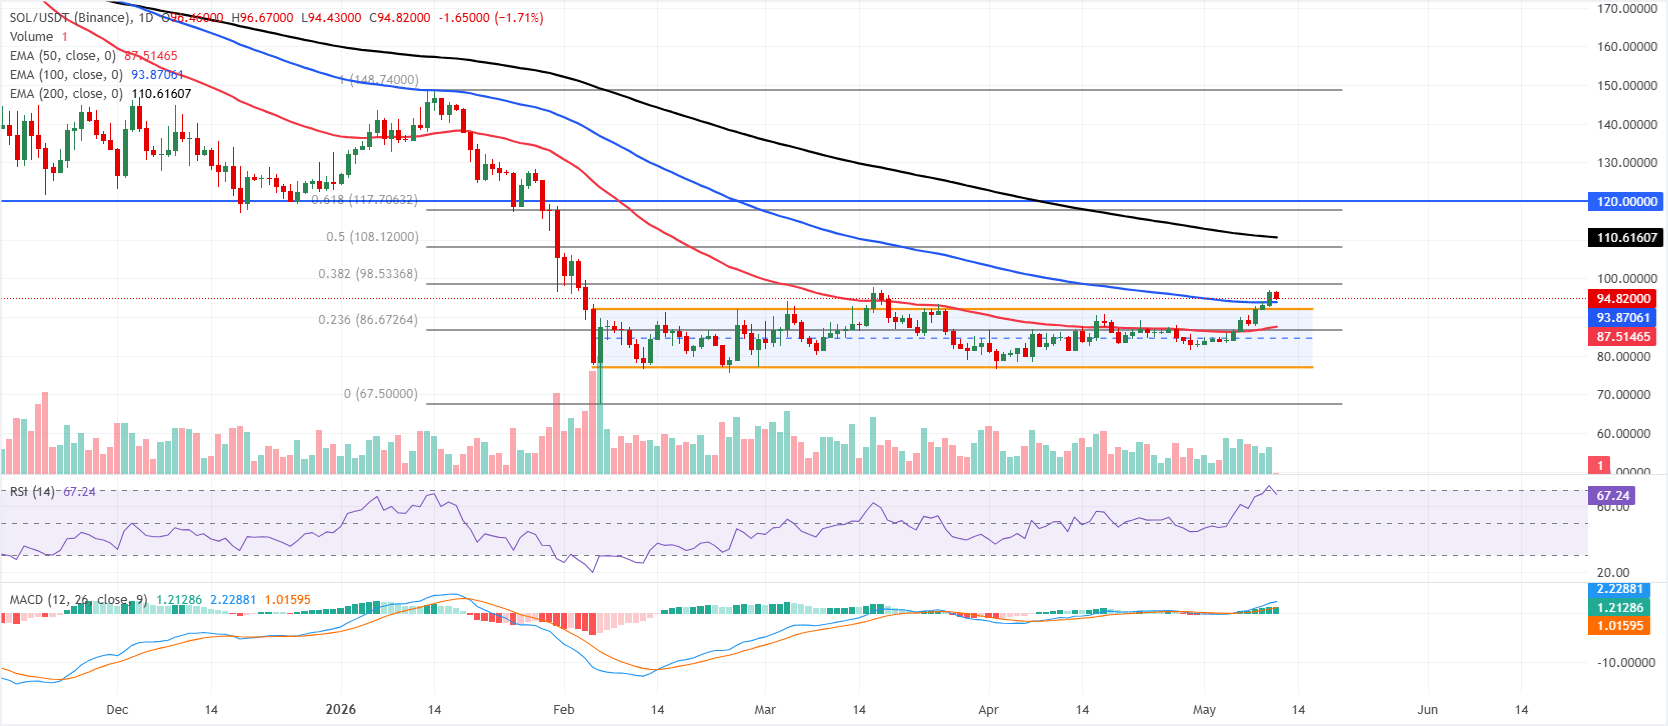
Solana Price Forecast: Bulls targeting level above $100
Solana price is trading at $94.82 on Monday, up 14.97% from the previous week. SOL is keeping a constructive near-term bias as price has reclaimed the upper side of the downward parallel channel and now holds above the 100-day Exponential Moving Average (EMA) at $93.87 and the 50-day EMA at $87.51.
The Relative Strength Index (RSI) at 67.27 indicates strong, but not yet extreme, upside momentum. At the same time, the Moving Average Convergence Divergence (MACD) remains firmly positive and rising, suggesting that bulls retain control as the market approaches more substantial overhead levels.
On the topside, initial resistance is seen at the 38.2% Fibonacci retracement of the latest swing at $98.53, ahead of a thicker barrier around the $108.12–$110.62 band defined by the 50% retracement and the 200-day EMA, with further resistance at the 61.8% level near $117.71 and the horizontal cap at $120.00; the 78.6% retracement at $131.35 is a more distant target if the rally extends.
On the downside, immediate support is now located around the prior channel top at $92.11. Support includes the 100-day EMA at $93.87, followed by the 50-day EMA at $87.52 and the 23.6% retracement at $86.67, while the channel floor at $77.12 and the cycle low area near $67.50 remain key medium-term demand zones in the event of a deeper pullback.
(The technical analysis of this story was written with the help of an AI tool.)

超过一百万用户依赖 FXStreet 获取实时市场数据、图表工具、专家洞见和外汇新闻。其全面的经济日历和教育网络研讨会帮助交易者保持信息领先、做出审慎决策。FXStreet 拥有约 60 人的团队,分布在巴塞罗那总部及全球各地区。
阅读更多


