
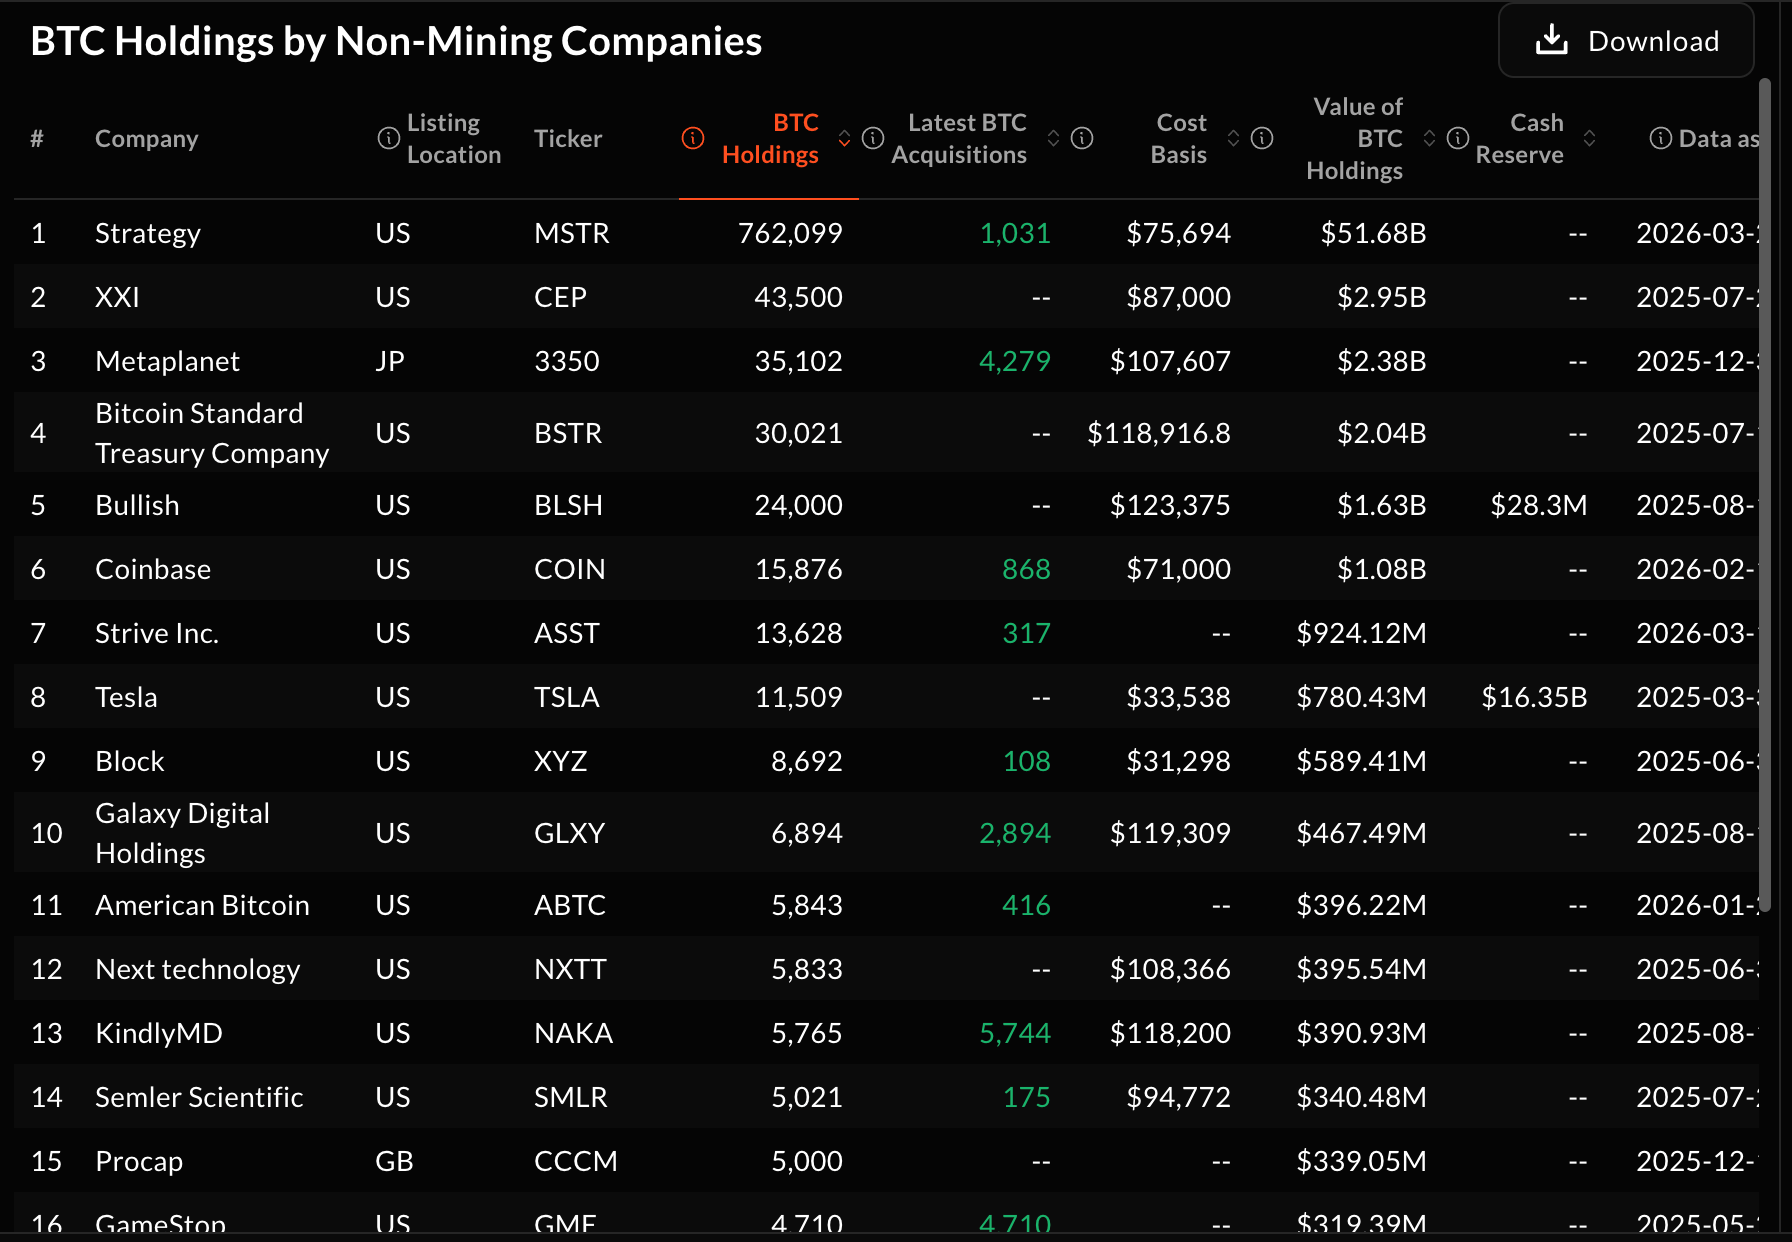
Strategy accounts for 76% of corporate Bitcoin holdings as treasury demand fades
作者 John Isige
更新: 27 Mar 2026


热门文章

Bitcoin (BTC) is facing a major shift in demand from companies in the first quarter of 2026, with Strategy (MSTR) adding more than 45,000 BTC to its balance sheet, while corporate activity remains muted.
- Strategy bought 45,000 BTC over the past 30 days, bringing total holdings to 762,099 BTC.
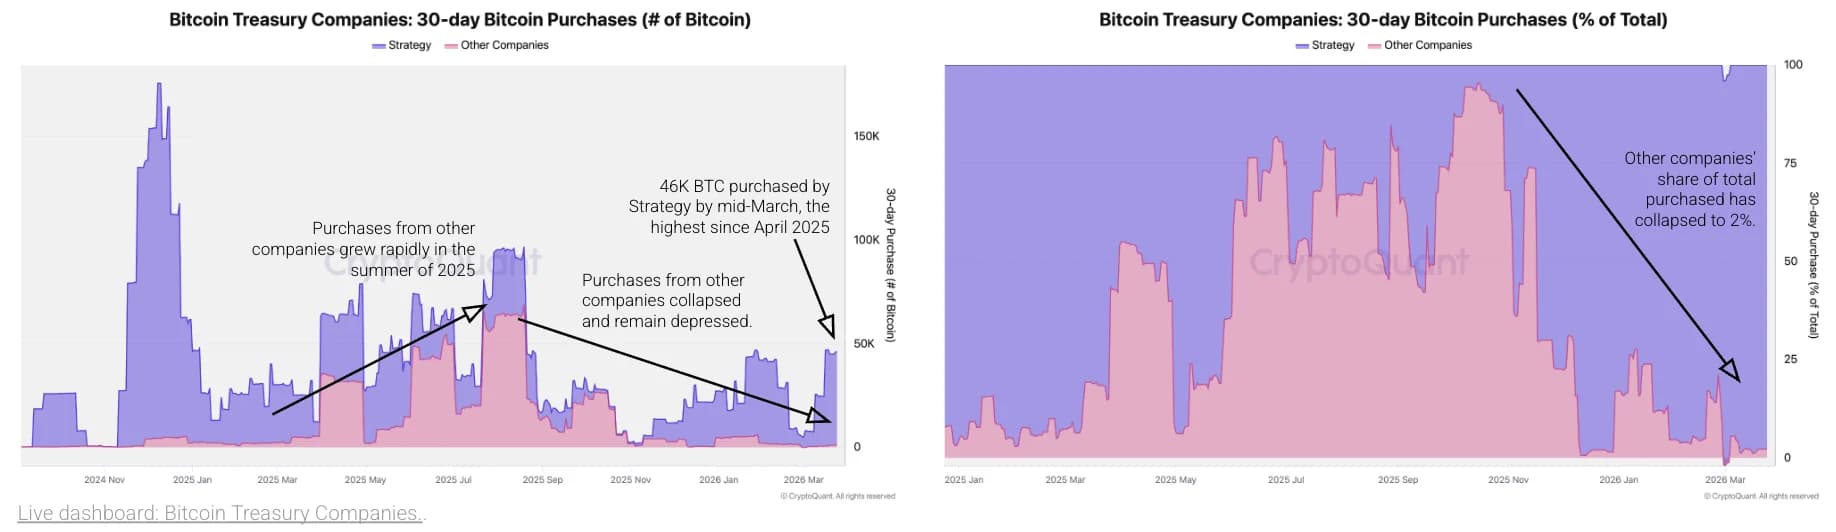
- Bitcoin treasury purchases from companies, excluding Strategy, have crashed by 99% from peak levels.
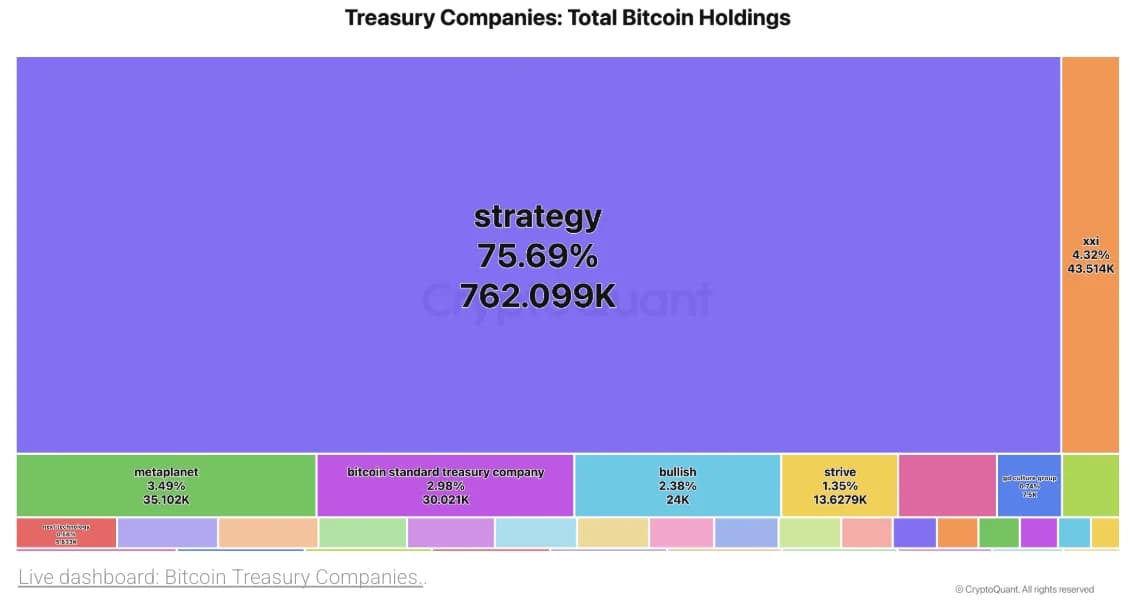
- Bitcoin treasury concentration has reached extreme levels, with Strategy accounting for 76% of total corporate holdings.
- Bitcoin extends its sell-off toward $66,000 on Friday as the Iran war weighs on risk assets.
Bitcoin (BTC) is facing a major shift in demand from companies in the first quarter of 2026, with Strategy (MSTR) adding more than 45,000 BTC to its balance sheet, while corporate activity remains muted. Treasury concentration has hit extreme levels and continues to increase, as Strategy holdings grow while other companies lag.
Meanwhile, Bitcoin remains in a largely bearish trend, falling by approximately 48% from its record high of $126,999. The crypto king is trading slightly above $66,000 at the time of writing on Friday, weighed down by risk-off sentiment and volatility due to the United States (US) and Israel's war with Iran.
Corporate Bitcoin buying excluding Strategy collapses
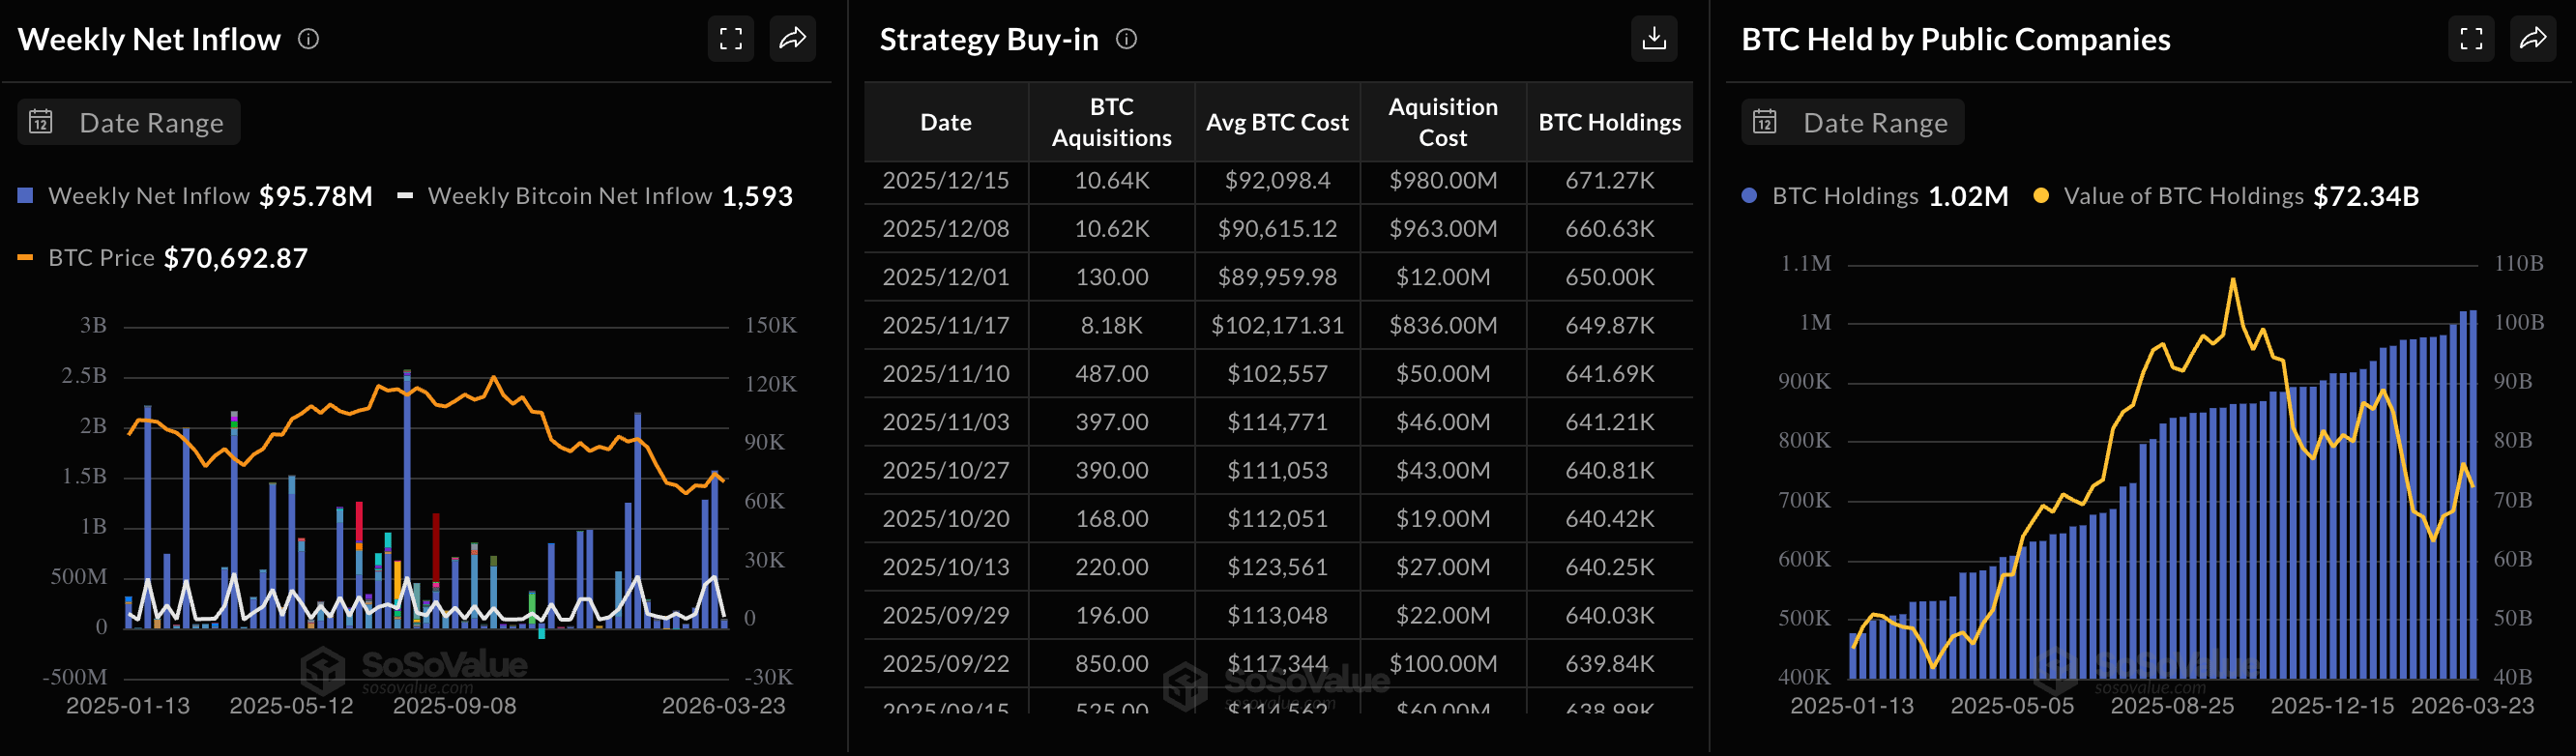
Strategy’s rush to accumulate Bitcoin on its balance sheet has not slowed, despite the price correction, which hit a yearly low of $60,000 in February. The leading corporate holder of Bitcoin has purchased more than 45,000 CTC over the past 30 days. According to CryptoQuant, this is the highest 30-day purchases since April 2025. Strategy’s holdings stand at 762,099 BTC, valued at $51.68 billion, with a cost basis of $75,694 per BTC.
Bitcoin purchases from all other companies other than Strategy remain significantly depressed at 1,000 BTC over the last 30 days. Compared to the 66,000 BTC purchased in August last year, this represents a 99% dip and accounts for only 2% of the Bitcoin treasury purchases, down from 95% in October.
Is the Bitcoin treasury summer over?
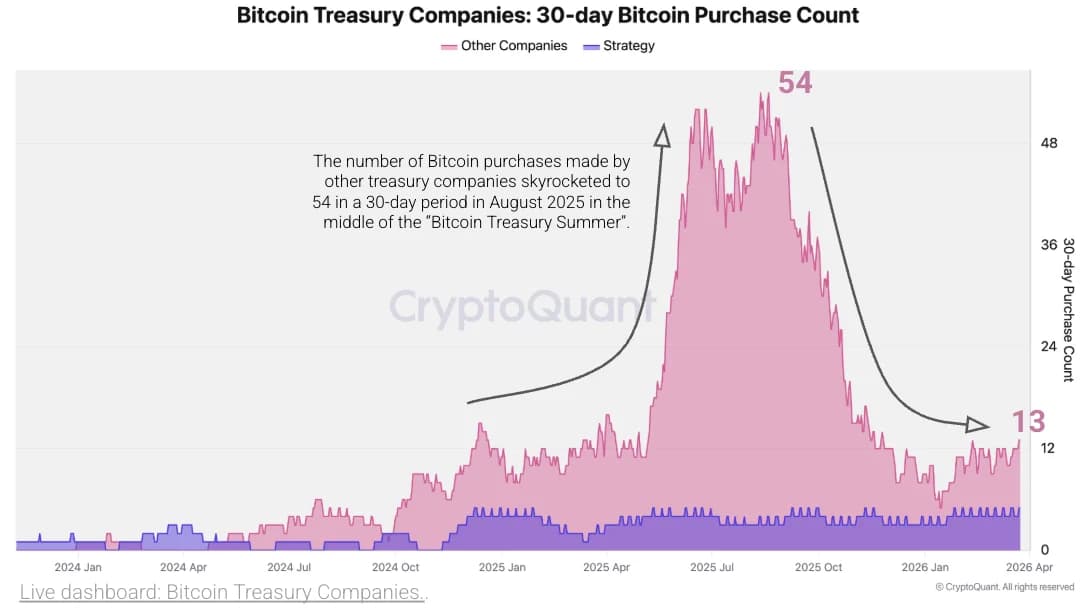
The number of Bitcoin purchases outside of Strategy is also down 76% to 13 over the last 30 days, compared to 54 in August. Total treasury activity surged in late April and peaked in August, as shown in the chart below. In contrast, Strategy's buying activity has remained relatively high, averaging between four and five purchases over a 30-day period.
As corporates stay away from Bitcoin, Strategy’s appetite for the largest cryptocurrency by market capitalization remains steady. This interest discrepancy has pushed Strategy’s holdings up by 90,000 BTC this year, while the other companies have bought a paltry 4,000 BTC. Strategy currently accounts for 76% of total holdings, while the remaining 24% is spread across other companies.
Macroeconomic uncertainty, bear market sentiment and the Iran war weigh on Bitcoin
Bitcoin has sustained a downtrend since hitting a record high of $126,199 in October, driving risk-off sentiment across markets. The October 10 sell-off, macroeconomic uncertainty following the Federal Reserve (Fed) pausing its monetary easing cycle, and geopolitical tensions are among factors that are escalating risk-averse sentiment and capping rebounds.
Bitcoin treasury companies are not immune to broader headwinds, as the value of their 1.02 million BTC holdings has plummeted to $72.34 billion on Friday from nearly $108 billion in October.
The Iran war continues to drag sentiment down, as risk appetite fades. Global risk assets remain on the edge amid increasing Oil prices. Central banks worldwide are preparing for lasting economic impacts, with inflation likely to rise and cap growth.
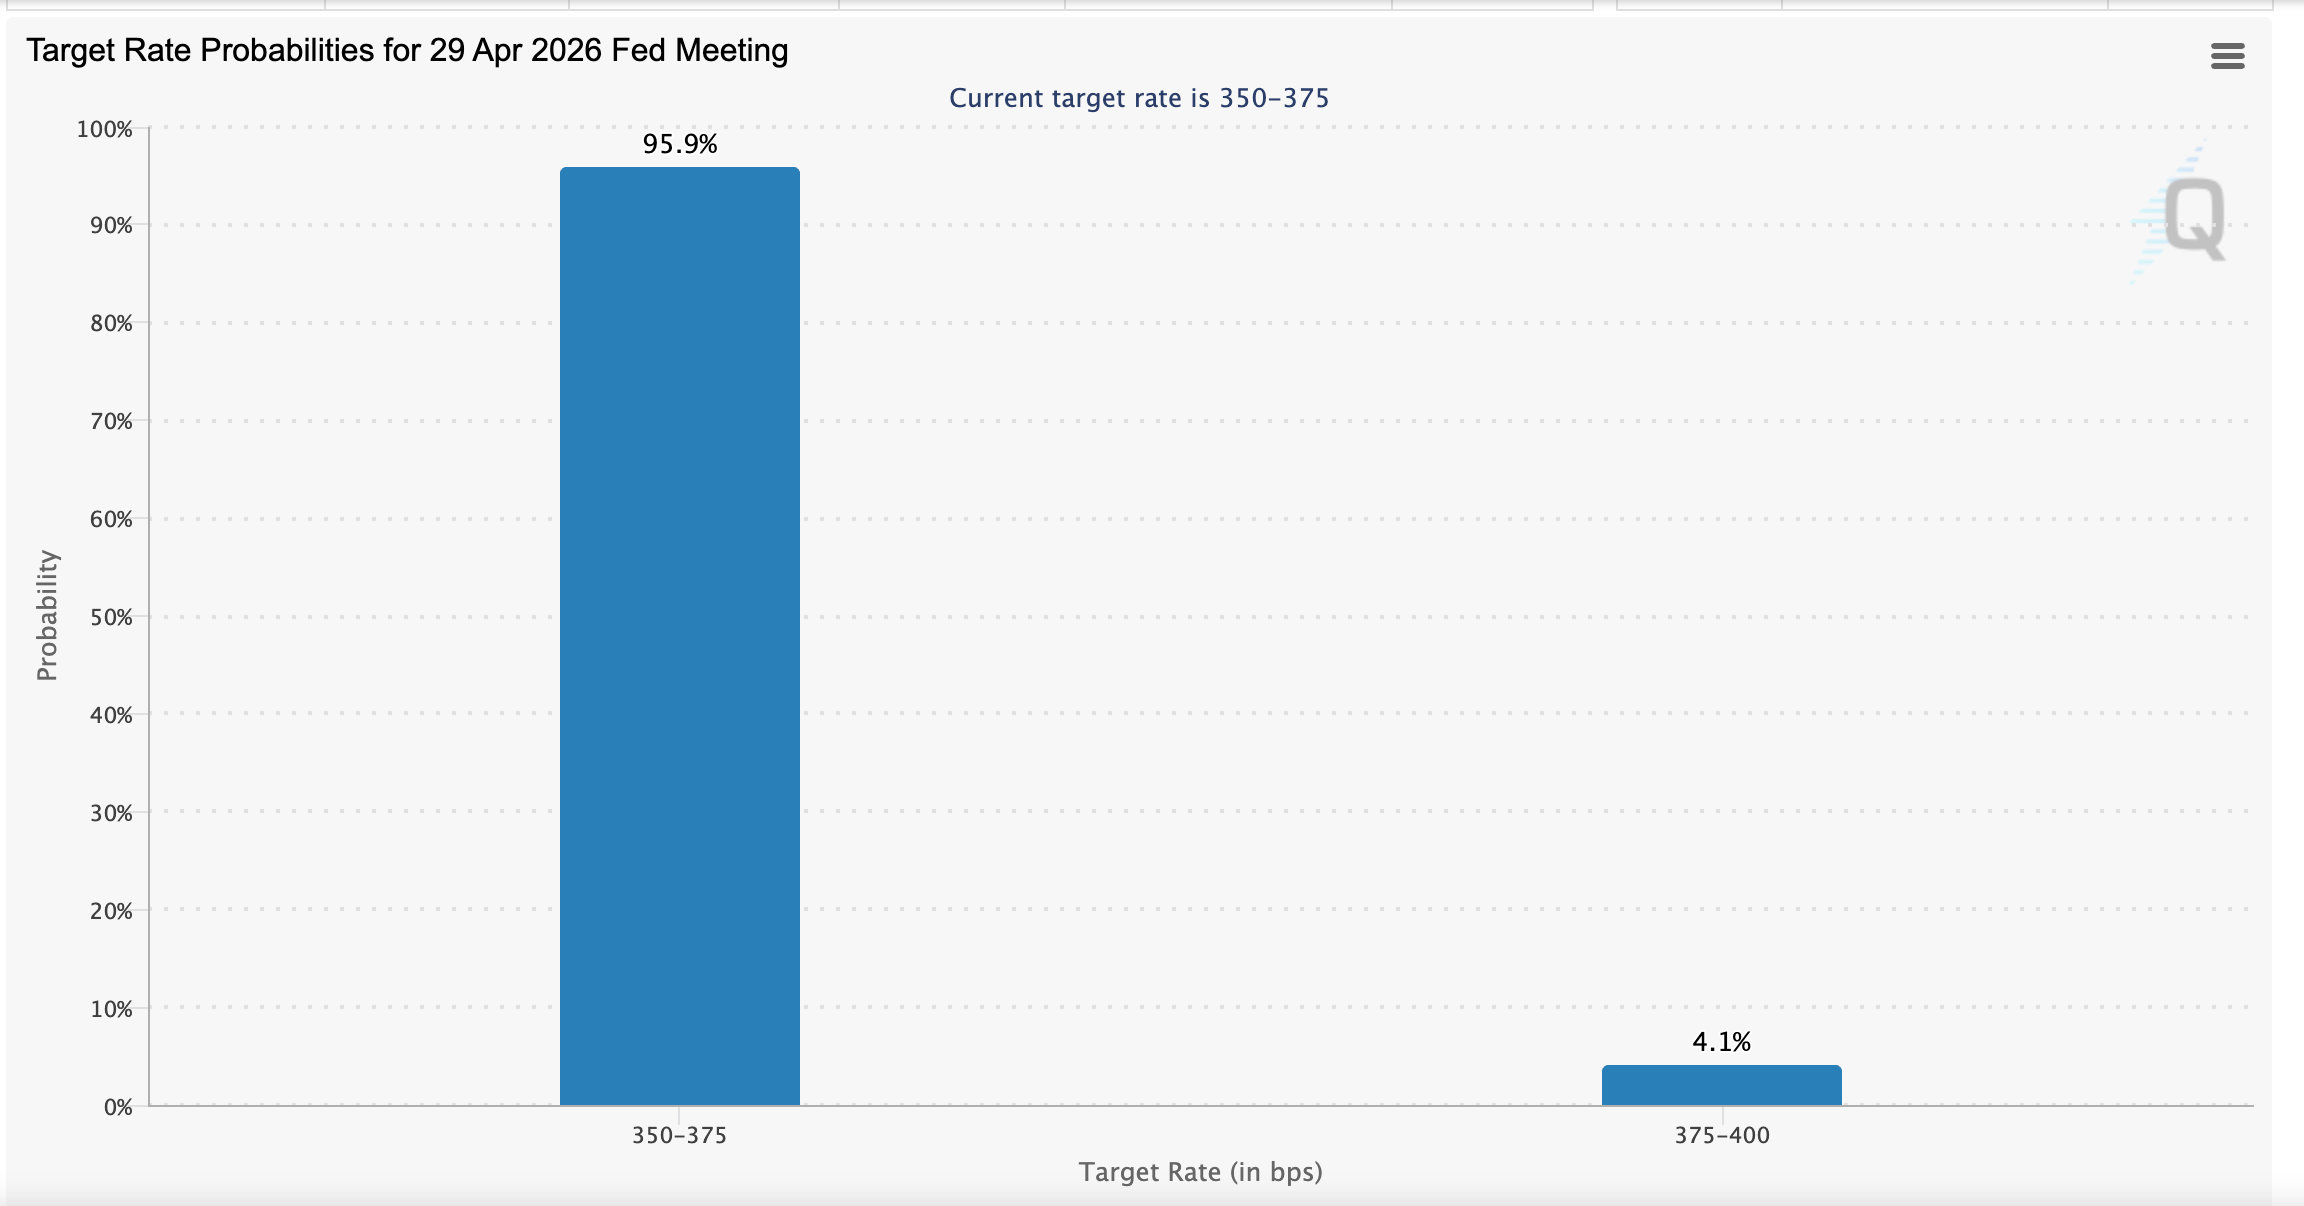
Earlier this month, the Federal Reserve took a hawkish stance on interest rate cuts due to the Iran war. Investors are now pricing in a high probability that rates will remain unchanged for much longer in 2026, a significant shift from an earlier projection of at least two rate cuts. Investors are now pricing almost a 96% chance that the central bank will leave rates unchanged in the 3.50%-3.75% range at the end of April.
Technical outlook: Bitcoin risks extending sell-off
Bitcoin is hovering above $66,500 at the time of writing on Friday. Its near‑term bias is mildly bearish as price slips further below the 50-day, 100-day and 200-day Exponential Moving Averages, keeping BTC entrenched in a broader corrective phase despite recent attempts to stabilize.
Momentum has softened, with the Moving Average Convergence Divergence (MACD) indicator slipping deeper into negative territory and its red histogram bars expanding on the daily chart, suggesting selling pressure persists. The Relative Strength Index (RSI) near 41 remains below the 50 midline on the same chart, suggesting a market where rallies face supply rather than triggering a sustained breakout.
fresh impulsive leg higher.
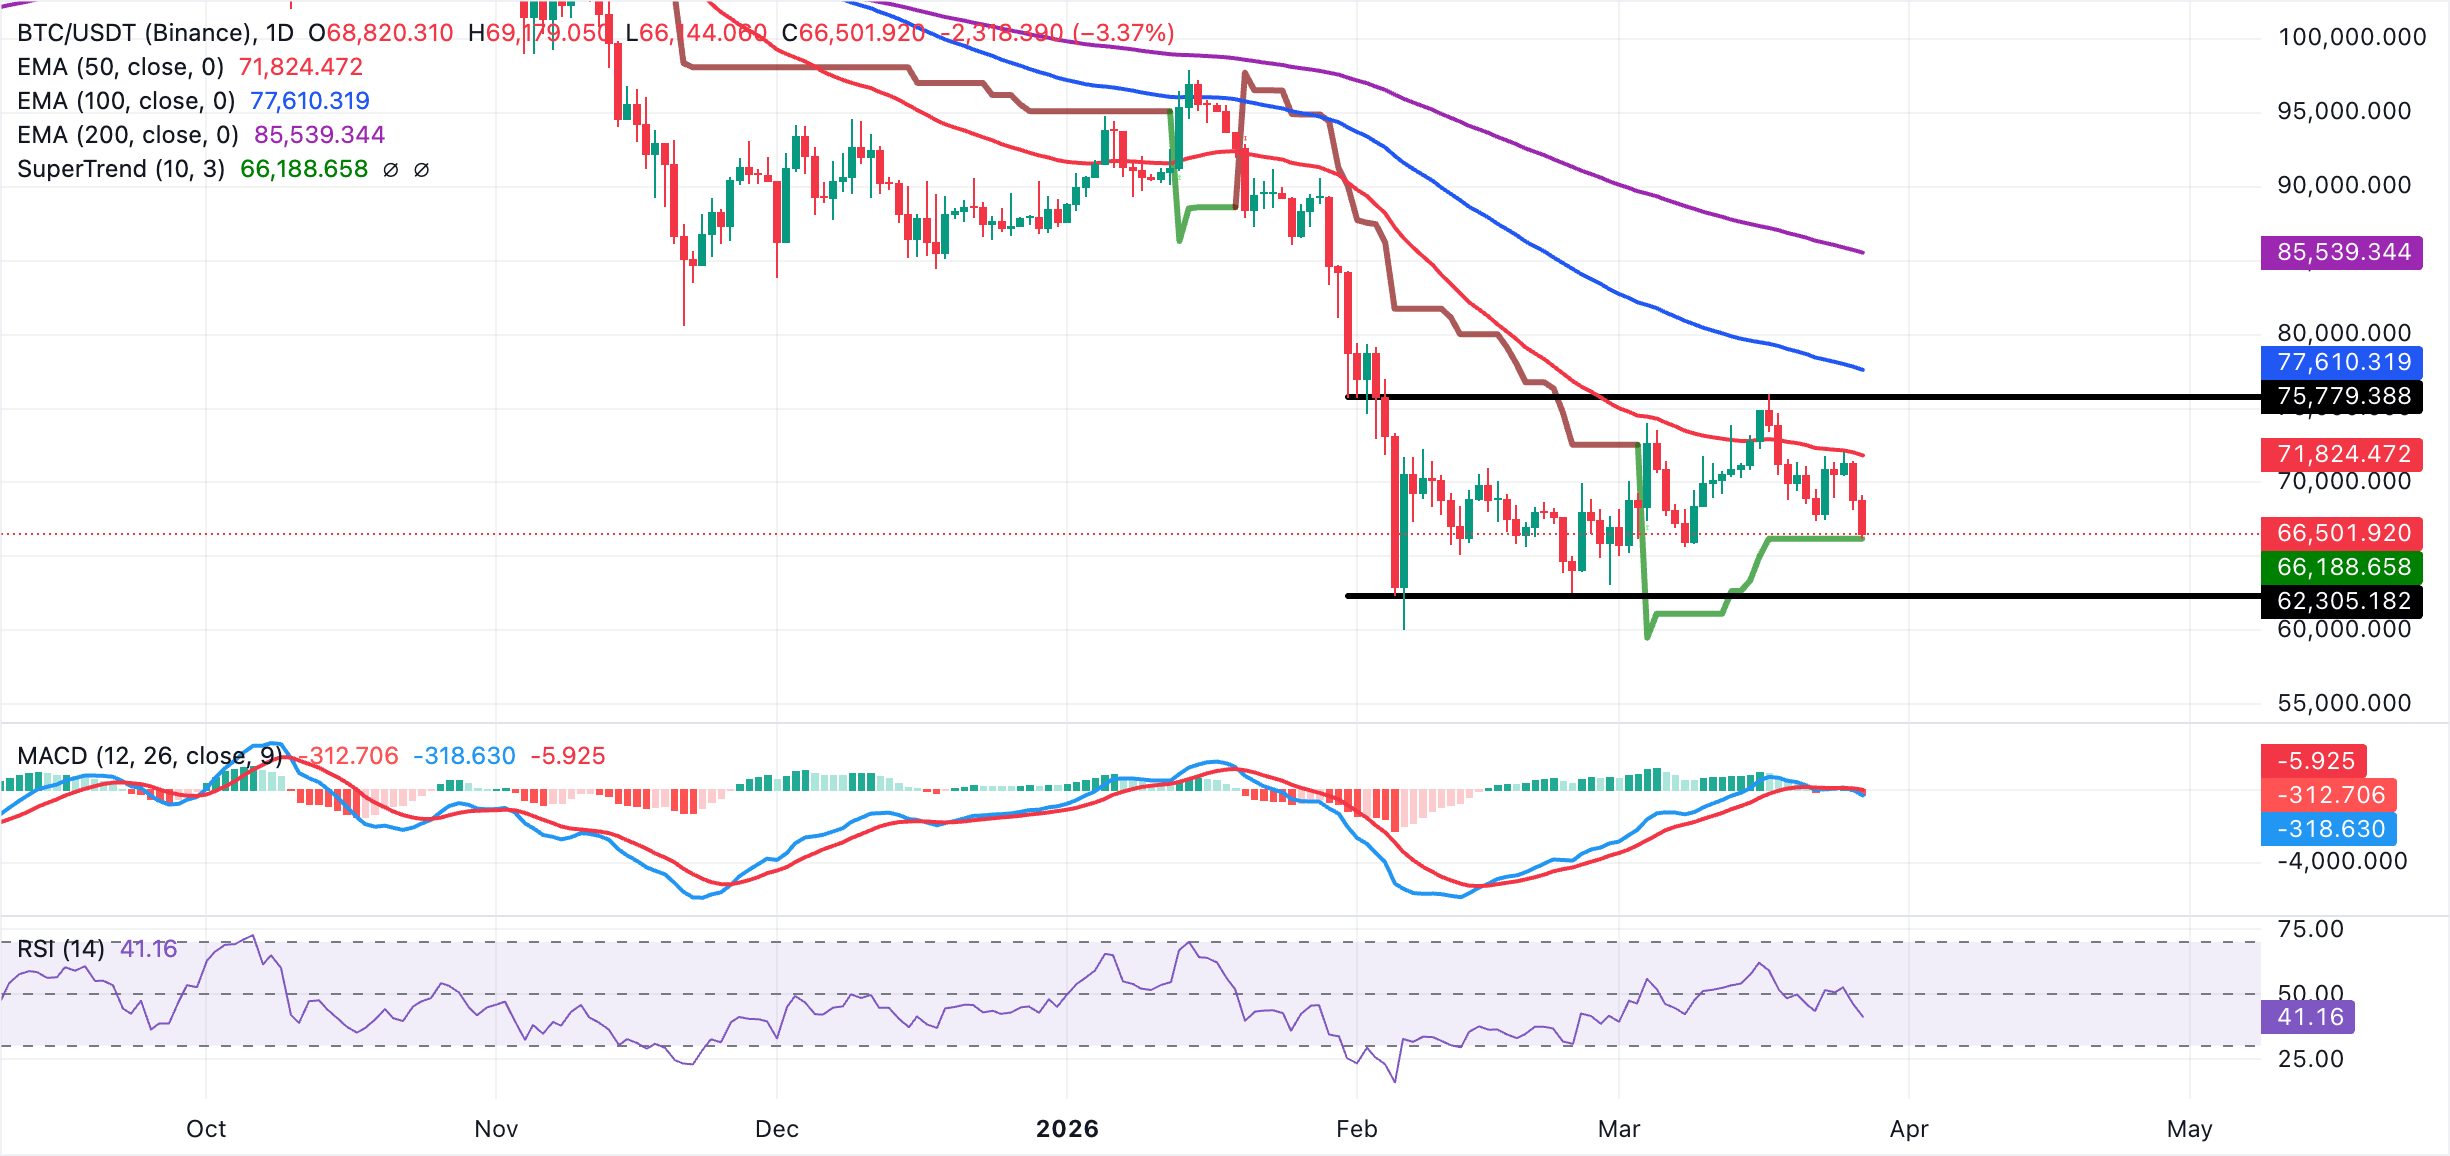
Bitcoin's initial resistance emerges at $68,820, aligning with the daily high. A daily close above this barrier would open the way toward the psychological $70,000 region, followed by the 50-day EMA at $71,824.
On the downside, immediate support aligns with the SuperTrend indicator at $66,189, where a break would expose the late‑range floor near $65,000. Below that, bearish momentum could extend toward the February low of $60,000.
Open Interest, funding rate FAQs
Higher Open Interest is associated with higher liquidity and new capital inflow to the market. This is considered the equivalent of increase in efficiency and the ongoing trend continues. When Open Interest decreases, it is considered a sign of liquidation in the market, investors are leaving and the overall demand for an asset is on a decline, fueling a bearish sentiment among investors.
Funding fees bridge the difference between spot prices and prices of futures contracts of an asset by increasing liquidation risks faced by traders. A consistently high and positive funding rate implies there is a bullish sentiment among market participants and there is an expectation of a price hike. A consistently negative funding rate for an asset implies a bearish sentiment, indicating that traders expect the cryptocurrency’s price to fall and a bearish trend reversal is likely to occur.
(The technical analysis of this story was written with the help of an AI tool.)

超过一百万用户依赖 FXStreet 获取实时市场数据、图表工具、专家洞见和外汇新闻。其全面的经济日历和教育网络研讨会帮助交易者保持信息领先、做出审慎决策。FXStreet 拥有约 60 人的团队,分布在巴塞罗那总部及全球各地区。
阅读更多


