
Top 3 Price Prediction: Bitcoin, Ethereum, Ripple – BTC and ETH rebound as bulls return, XRP targets breakout
作者 Manish Chhetri
更新: 3 Jul 2026


热门文章

Bitcoin (BTC), Ethereum (ETH) and Ripple (XRP) extend their recovery on Friday as improving risk sentiment and strengthening technical indicators support the broader cryptocurrency market.
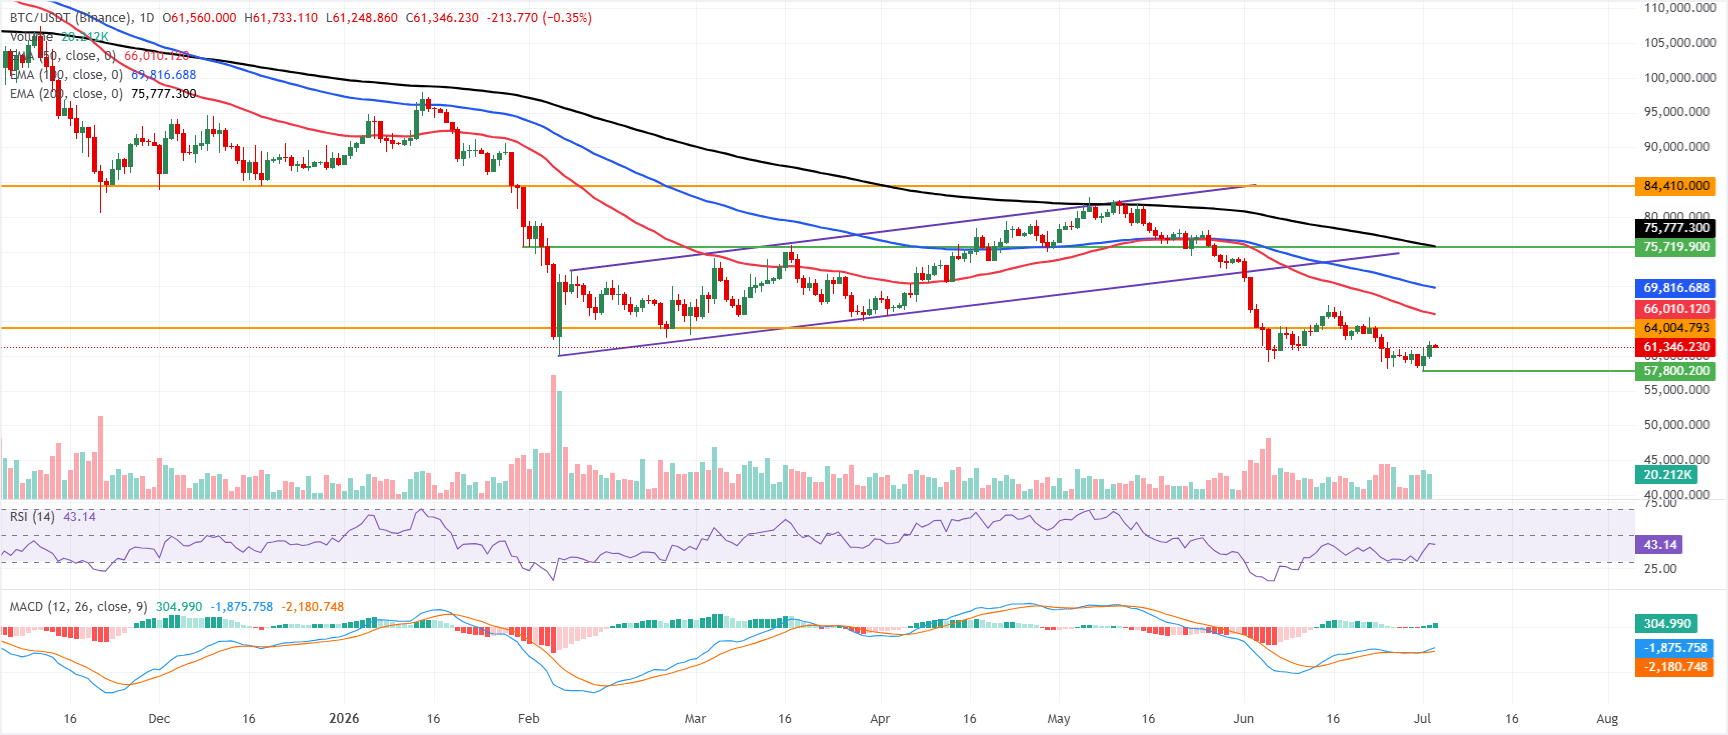
- Bitcoin reclaims $61,300 on Friday, recovering from a 21-month low reached earlier this week.
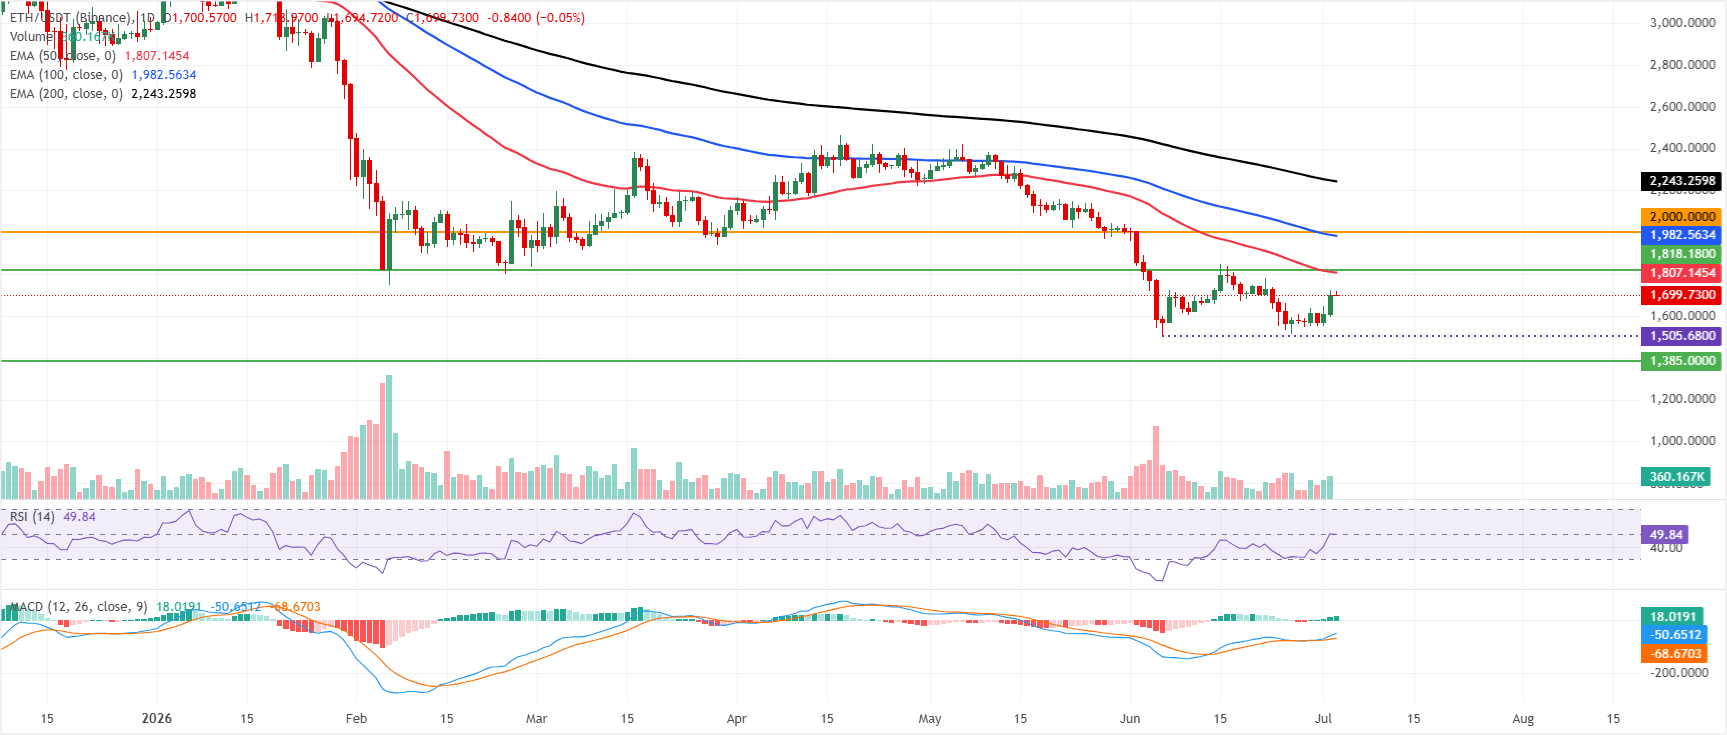
- Ethereum steadies at $1,700 after rebounding nearly 10% in the previous two days.
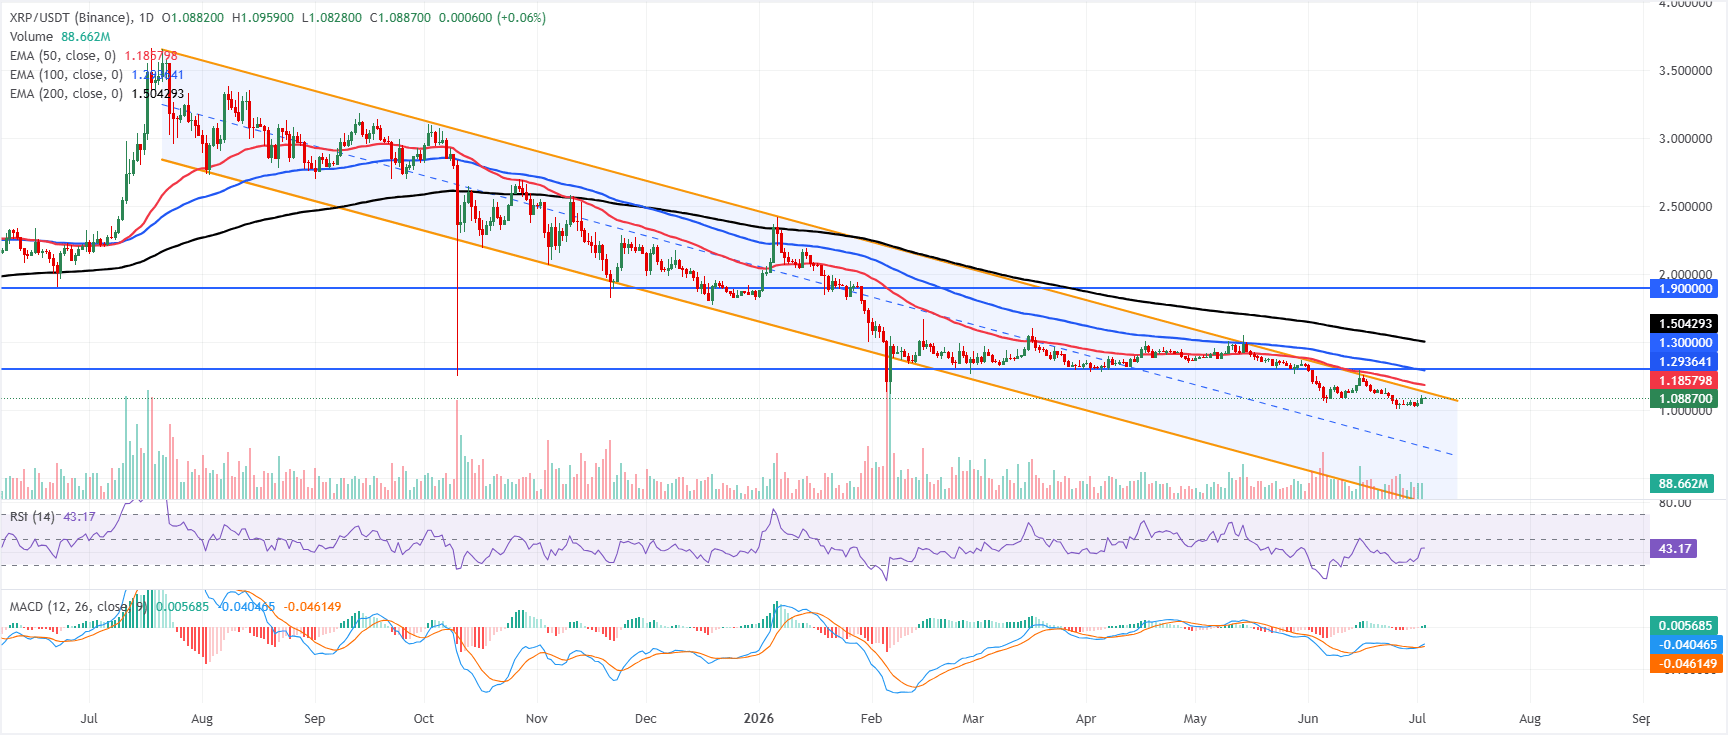
- XRP nears the upper boundary of the falling channel, a breakout suggests a bullish move.
Bitcoin (BTC), Ethereum (ETH) and Ripple (XRP) extend their recovery on Friday as improving risk sentiment and strengthening technical indicators support the broader cryptocurrency market. BTC reclaims the $61,300 level after rebounding from a 21-month low earlier this week, while ETH holds firm near $1,700 following a sharp two-day recovery. Meanwhile, XRP is approaching the upper boundary of its falling channel, and a decisive breakout could pave the way for further gains.
Bitcoin recovers from 21-month low
Bitcoin price trades around $61,300 on Friday, after rebounding from a 21-month low of $57,800 earlier this week. However, BTC maintains a bearish bias, as it decisively remains below the 50-day, 100-day, and 200-day Exponential Moving Averages (EMAs) at $66,010, $69,816, and $75,777, respectively.
The Relative Strength Index (RSI) at 43 stays below the midline, hinting at subdued buying pressure, while the Moving Average Convergence Divergence (MACD) shows a positive reading with the MACD line above its signal and above zero, indicating improving but still insufficient momentum to challenge the prevailing overhead supply.
On the topside, initial resistance appears near the horizontal barrier at $64,004, ahead of the 50-day EMA at $66,010, which reinforces a wider cap zone for any bounce. Further up, the 100-day EMA at $69,816 and the 200-day EMA at $75,777 align as successive resistance levels before the more distant horizontal level at $84,410.
On the downside, a failure to reclaim the $64,000 area would leave BTC vulnerable to renewed pressure targeting the key psychological level at $55,000.
Ethereum extends recovery toward $1,700
Ethereum price trades at $1,700 on Friday after extending its recovery. Despite this rebound, ETH maintains a bearish bias as price remains well below the 50-, 100-, and 200-day EMAs at $1,807, $1,982, and $2,243, respectively.
Despite this capped structure, momentum has improved, with the RSI hovering just below the neutral 50 mark and the MACD remaining positive above the zero line, suggesting an ongoing recovery attempt rather than a confirmed trend reversal.
On the topside, immediate resistance is seen at the 50-day EMA around $1,807, followed closely by a horizontal barrier near $1,818, forming a nearby supply zone; a break here would expose the 100-day EMA at roughly $1,983 and the $2,000 handle, with the 200-day EMA higher up at about $2,243 as a broader bearish cap.
On the downside, the key structural support sits much lower at the horizontal level near $1,385, where buyers would be expected to defend the medium-term floor if the current recovery falters.
XRP could extend gains if it breaks above the channel
XRP price trades at $1.088 on Friday, holding below all major EMAs and within a broader downward channel, which maintains a bearish bias despite some stabilization. The 50-day EMA at $1.185, the 100-day EMA at $1.293 and the 200-day EMA at $1.504 all sit overhead as layered resistance. At the same time, the RSI near 43 suggests only modest momentum recovery, and the MACD line holding slightly above zero hints at a tentative, still-fragile corrective phase within a dominant downtrend.
On the topside, initial resistance aligns with the upper boundary of the descending channel around $1.134, ahead of the 50-day EMA at $1.185, where sellers could look to reassert control. A more sustained recovery would require a break above the 100-day EMA at $1.293 and the nearby horizontal barrier at $1.300, with the 200-day EMA at $1.504 and the prior mapped resistance near $1.900 only coming into play if buyers can decisively reclaim those intermediate caps.
(The technical analysis of this story was written with the help of an AI tool.)
Cryptocurrency prices FAQs
Token launches influence demand and adoption among market participants. Listings on crypto exchanges deepen the liquidity for an asset and add new participants to an asset’s network. This is typically bullish for a digital asset.
A hack is an event in which an attacker captures a large volume of the asset from a DeFi bridge or hot wallet of an exchange or any other crypto platform via exploits, bugs or other methods. The exploiter then transfers these tokens out of the exchange platforms to ultimately sell or swap the assets for other cryptocurrencies or stablecoins. Such events often involve an en masse panic triggering a sell-off in the affected assets.
Macroeconomic events like the US Federal Reserve’s decision on interest rates influence crypto assets mainly through the direct impact they have on the US Dollar. An increase in interest rate typically negatively influences Bitcoin and altcoin prices, and vice versa. If the US Dollar index declines, risk assets and associated leverage for trading gets cheaper, in turn driving crypto prices higher.
Halvings are typically considered bullish events as they slash the block reward in half for miners, constricting the supply of the asset. At consistent demand if the supply reduces, the asset’s price climbs.

超过一百万用户依赖 FXStreet 获取实时市场数据、图表工具、专家洞见和外汇新闻。其全面的经济日历和教育网络研讨会帮助交易者保持信息领先、做出审慎决策。FXStreet 拥有约 60 人的团队,分布在巴塞罗那总部及全球各地区。
阅读更多


