
Top 3 Price Prediction: Bitcoin, Ethereum, Ripple – BTC, ETH and XRP face pressure near key technical barriers
作者 Manish Chhetri
发布日期: 15 Dec 2025 | 修改日期: 15 Dec 2025


热门文章

Bitcoin (BTC), Ethereum (ETH) and Ripple (XRP) hover around key levels on Monday after correcting slightly in the previous week. The top three cryptocurrencies by market capitalization could face increased downside risk as bearish momentum builds across key indicators.
- Bitcoin price hovers around $89,000 on Monday after failing to break above the descending trendline last week.
- Ethereum price drifts toward key support at $3,017 after repeatedly failing to close above the 50-day EMA at $3,280.
- XRP is approaching key support at $1.96, a firm close below suggests further correction ahead.
Bitcoin (BTC), Ethereum (ETH) and Ripple (XRP) hover around key levels on Monday after correcting slightly in the previous week. The top three cryptocurrencies by market capitalization could face increased downside risk as bearish momentum builds across key indicators. Market participants are closely monitoring critical support zones for signs of stabilization or a deeper corrective move.
Bitcoin fails to close above the descending trendline
Bitcoin price was rejected from the descending trendline (drawn by connecting multiple highs since early October) last week. This trendline coincides with the 61.8% Fibonacci retracement level at $94,253 (drawn from the April low of $74,508 to the all-time high of $126,199 set in October), making it a key resistance zone. As of Monday, BTC hovers around $89,000.
If BTC continues its pullback, it could extend the decline toward the next key support at $85,569, which aligns with the 78.6% Fibonacci retracement level.
The Relative Strength Index (RSI) on the daily chart is at 43, below its neutral level of 50, indicating bearish momentum is gaining traction. Moreover, the Moving Average Convergence Divergence (MACD) lines are converging, and a flip to a bearish crossover would further support the bearish outlook.
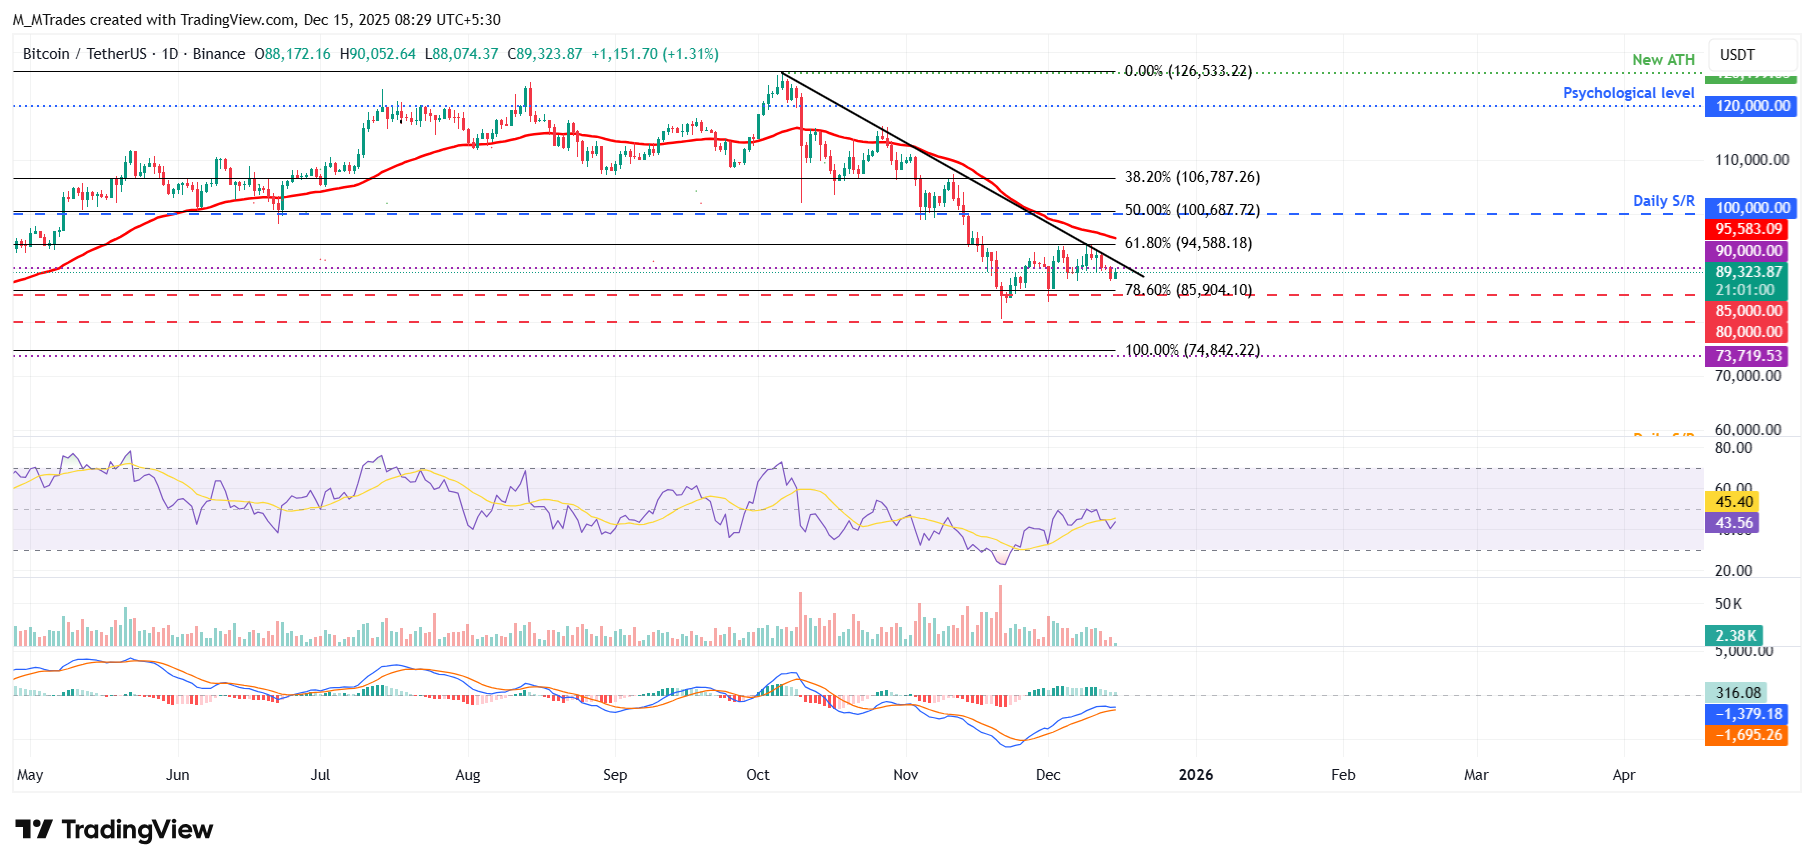
Looking up, if BTC breaks above the descending trendline and closes above the $94,253 resistance level, it could extend the rally toward the $100,000 psychological level.
Ethereum corrects after facing rejection from the 50-day EMA
Ethereum price failed to close above the 50-day Exponential Moving Average (EMA) at $3,280 on Wednesday and declined 7.62% by Sunday. At the time of writing on Monday, ETH hovers around $3,100.
If ETH continues its correction and closes below the daily support at $3,017, it could extend the decline toward the next support at $2,749.
The RSI on the daily chart reads 49, slipping below the neutral level of 50, indicating early signs of bearish momentum. Similarly, the MACD lines are converging, and a confirmed bearish crossover would further suggest the negative outlook.
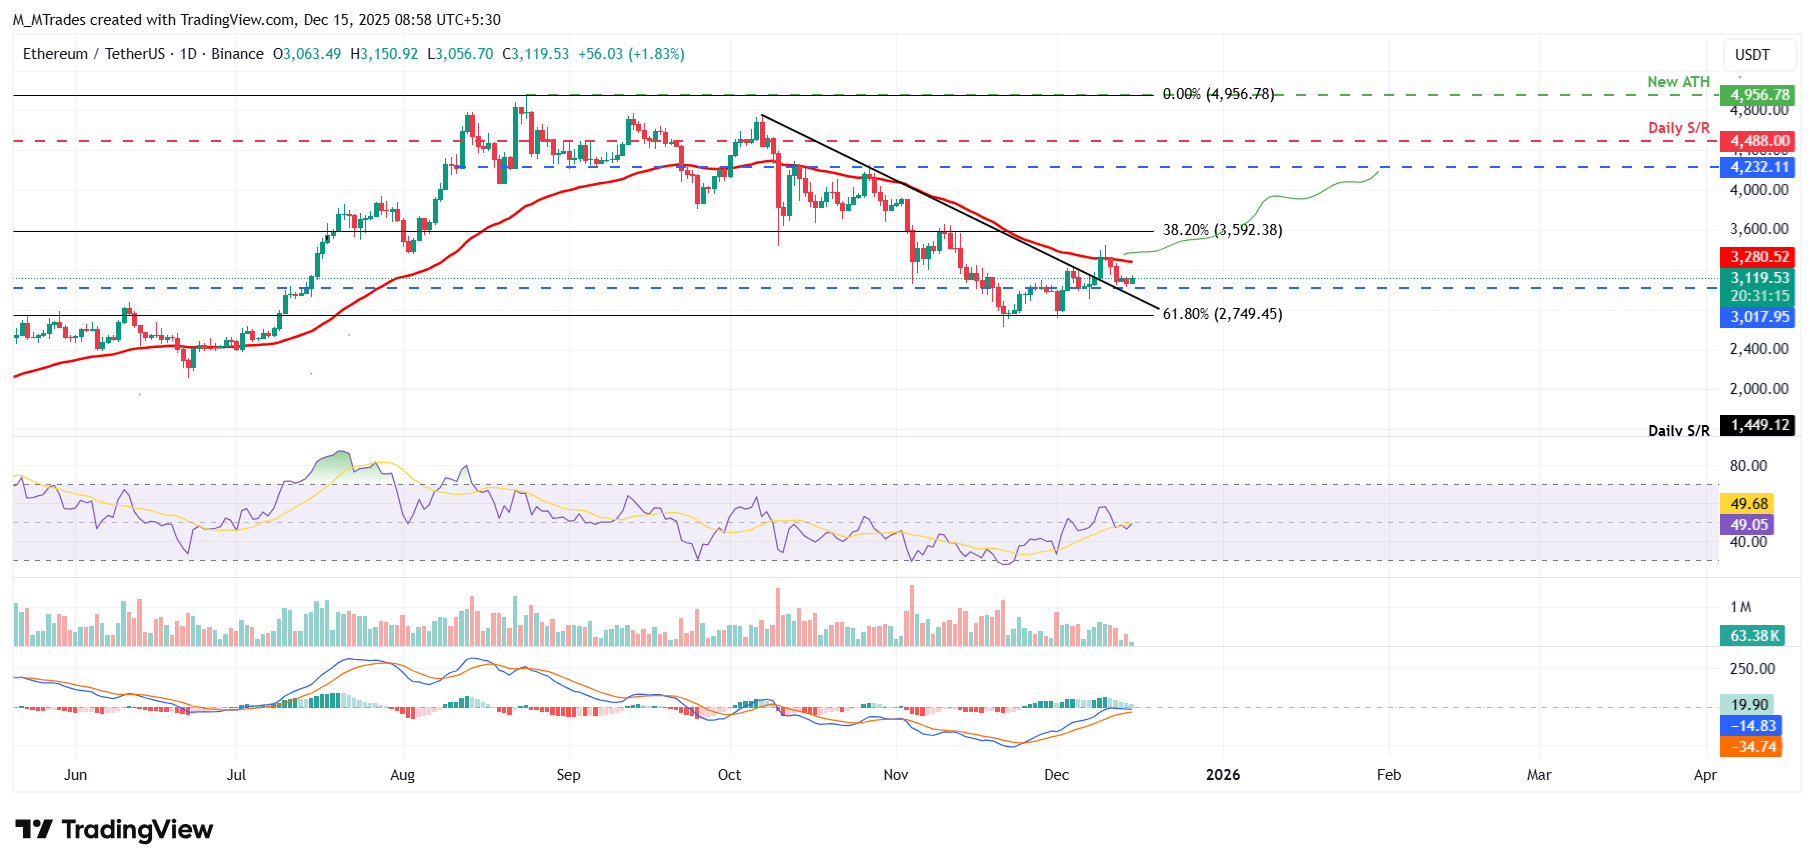
On the other hand, if ETH recovers, it could extend the recovery toward the 50-day EMA at $3,280.
XRP could extend its decline if it closes below $1.96 support
XRP price declined for the second consecutive week by 3.22%, retesting the key daily support at $1.96 on Sunday. At the time of writing on Monday, XRP hovers around $1.99.
If XRP closes below the daily support at $1.96, it could extend the decline toward the next daily support at $1.77.
The RSI on the daily chart is 40, below its neutral level of 50, indicating that bearish momentum is gaining traction. Additionally, the MACD lines are converging, indicating indecision among traders.
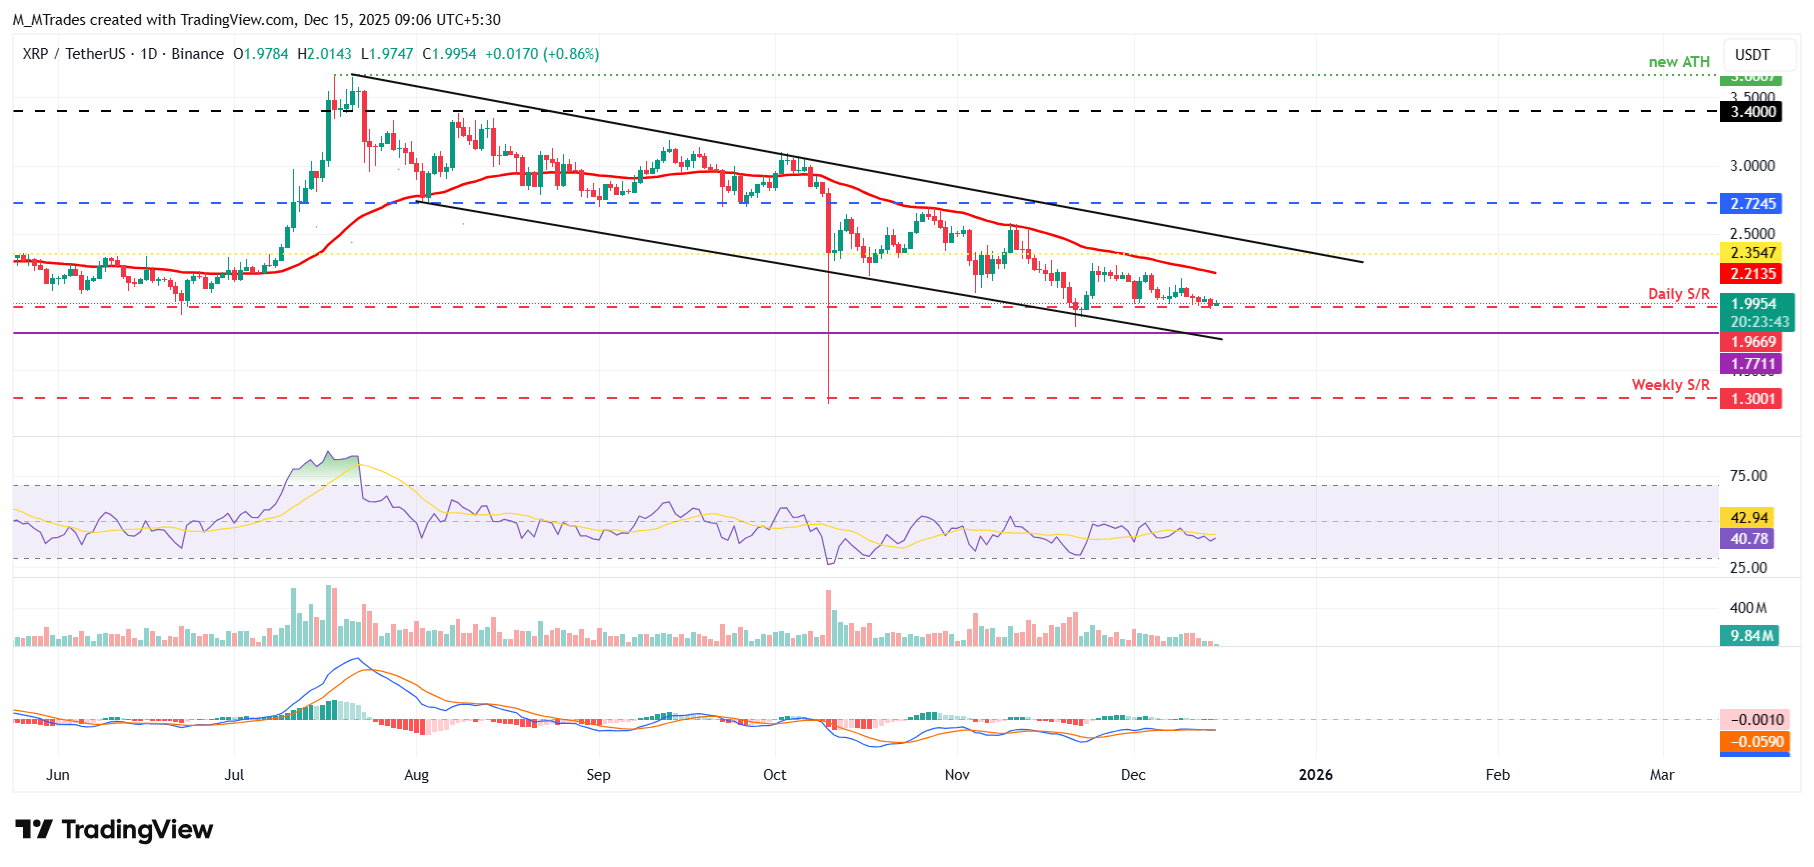
However, if the daily support at $1.96 holds, it could extend the rally toward the next daily resistance at $2.35.
Cryptocurrency metrics FAQs
The developer or creator of each cryptocurrency decides on the total number of tokens that can be minted or issued. Only a certain number of these assets can be minted by mining, staking or other mechanisms. This is defined by the algorithm of the underlying blockchain technology. On the other hand, circulating supply can also be decreased via actions such as burning tokens, or mistakenly sending assets to addresses of other incompatible blockchains.
Market capitalization is the result of multiplying the circulating supply of a certain asset by the asset’s current market value.
Trading volume refers to the total number of tokens for a specific asset that has been transacted or exchanged between buyers and sellers within set trading hours, for example, 24 hours. It is used to gauge market sentiment, this metric combines all volumes on centralized exchanges and decentralized exchanges. Increasing trading volume often denotes the demand for a certain asset as more people are buying and selling the cryptocurrency.
Funding rates are a concept designed to encourage traders to take positions and ensure perpetual contract prices match spot markets. It defines a mechanism by exchanges to ensure that future prices and index prices periodic payments regularly converge. When the funding rate is positive, the price of the perpetual contract is higher than the mark price. This means traders who are bullish and have opened long positions pay traders who are in short positions. On the other hand, a negative funding rate means perpetual prices are below the mark price, and hence traders with short positions pay traders who have opened long positions.

超过一百万用户依赖 FXStreet 获取实时市场数据、图表工具、专家洞见和外汇新闻。其全面的经济日历和教育网络研讨会帮助交易者保持信息领先、做出审慎决策。FXStreet 拥有约 60 人的团队,分布在巴塞罗那总部及全球各地区。
阅读更多


