
Top 3 Price Prediction: Bitcoin, Ethereum, Ripple – BTC, ETH and XRP see slight recovery after recent corrections
作者 Manish Chhetri
发布日期: 26 Jan 2026 | 修改日期: 26 Jan 2026


热门文章

Bitcoin (BTC), Ethereum (ETH), and Ripple (XRP) prices recovered slightly at the time of writing on Monday after correcting by over 7%, 14%, and 7%, respectively.
- Bitcoin price recovers above $87,700 on Monday after correcting 7.48% the previous week.
- Ethereum rebounds slightly after nearing the key support at $2,749.
- XRP rises higher after retesting daily support at $1.83, following three consecutive weeks of pullback.
Bitcoin (BTC), Ethereum (ETH), and Ripple (XRP) prices recovered slightly at the time of writing on Monday after correcting by over 7%, 14%, and 7%, respectively. The top three cryptocurrencies are nearing key support levels, and if they hold, could consolidate or extend their recovery in the upcoming days.
Bitcoin recovers after a massive correction
Bitcoin price closed below the midpoint of a horizontal parallel channel at $87,787 on Sunday, following a 7.4% correction last week. At the time of writing on Monday, BTC recovers slightly, nearing this broken level.
If BTC breaks and closes above $87,787 on a daily basis, it could extend the recovery toward the upper boundary of the horizontal pattern at $90,000.
However, the Relative Strength Index (RSI) on the daily chart is 39, below the neutral 50 level, indicating bearish momentum. For the recovery to be sustained, the RSI must move above the neutral 50 level. Traders should remain cautious, as the Moving Average Convergence Divergence (MACD) showed a bearish crossover last week and has remained intact, suggesting a downward move.
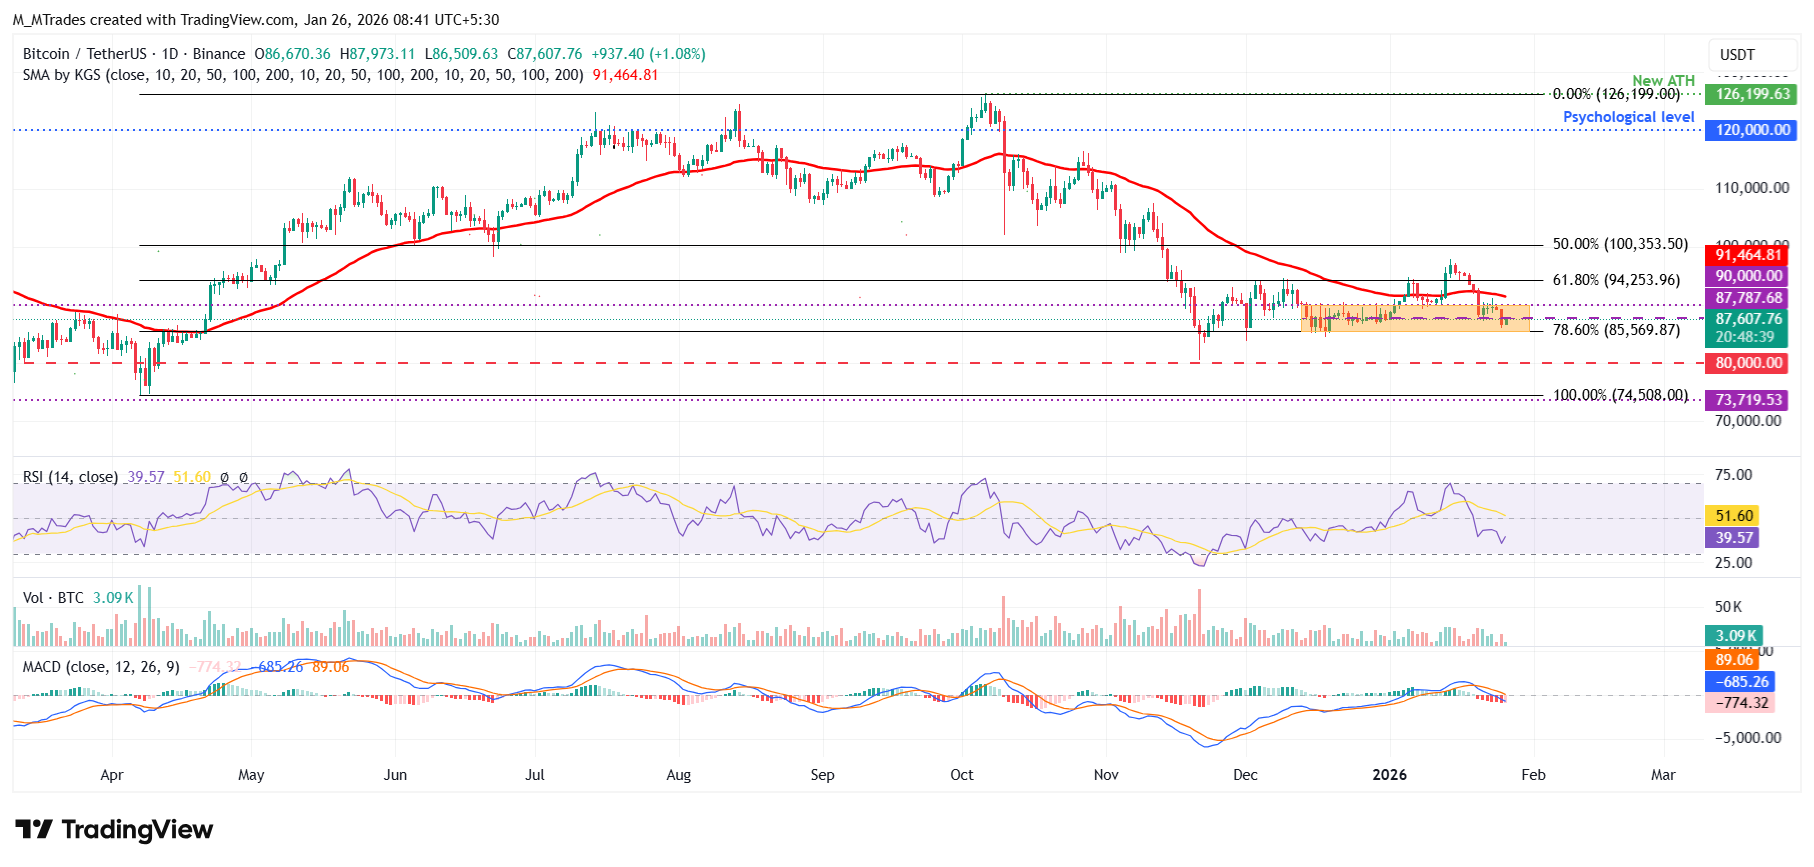
However, if BTC corrects, it could extend the fall toward the lower consolidation boundary at $85,569, which coincides with the 78.6% Fibonacci retracement level.
Ethereum nears key support level
Ethereum price closed below the daily support at $3,017 on Tuesday and declined 5.5% through Sunday. At the time of writing on Monday, ETH trades around $2,852, near the key support at $2,749.
If the 61.8% Fibonacci retracement level at $2,749 holds, ETH could recover toward the daily resistance level at $3,017.
However, traders should be cautious, as Bitcoin, Ethereum’s RSI, and MACD showed signs of bearish momentum.
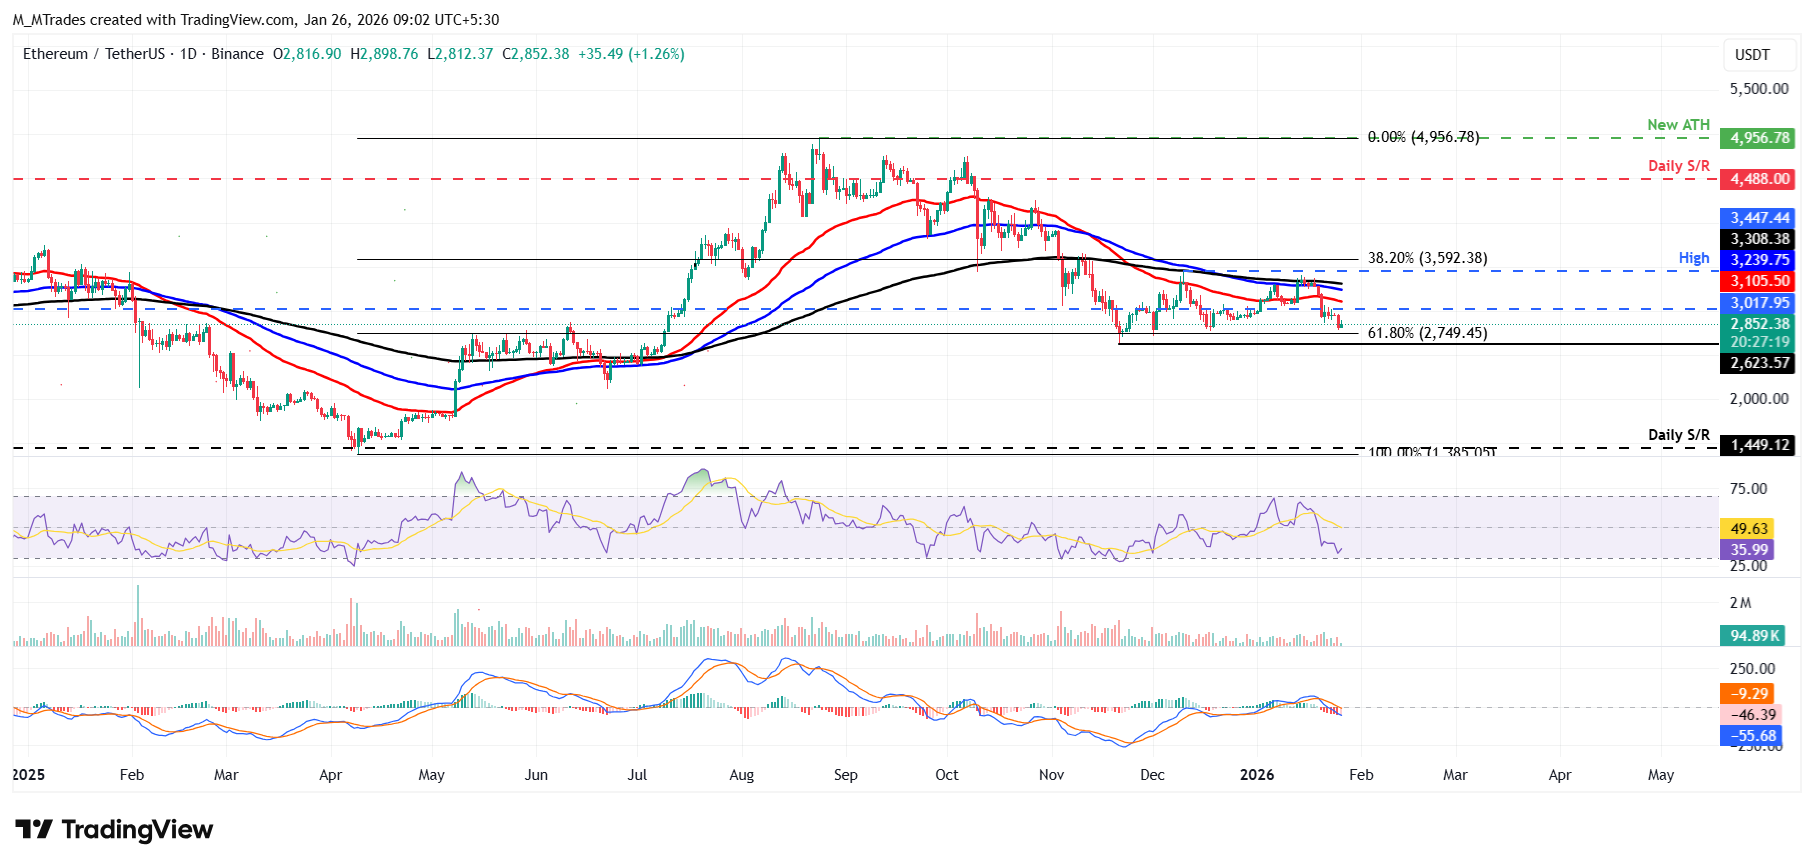
On the other hand, if ETH closes below $2,749, it could extend the correction toward the November 21 low at $2,623.
XRP rebounds slightly after retesting at daily support at $1.83
XRP price has corrected by more than 12% over the last three weeks since early January, retesting the daily support at $1.83 on Sunday. At the time of writing on Monday, XRP is rebounding slightly, trading around $1.87.
If the daily support at $1.83 holds, XRP could extend the recovery toward the next daily resistance at $1.96.
However, like Bitcoin and Ethereum, XRP’s momentum indicators (RSI and MACD) on the daily chart still support a bearish view.
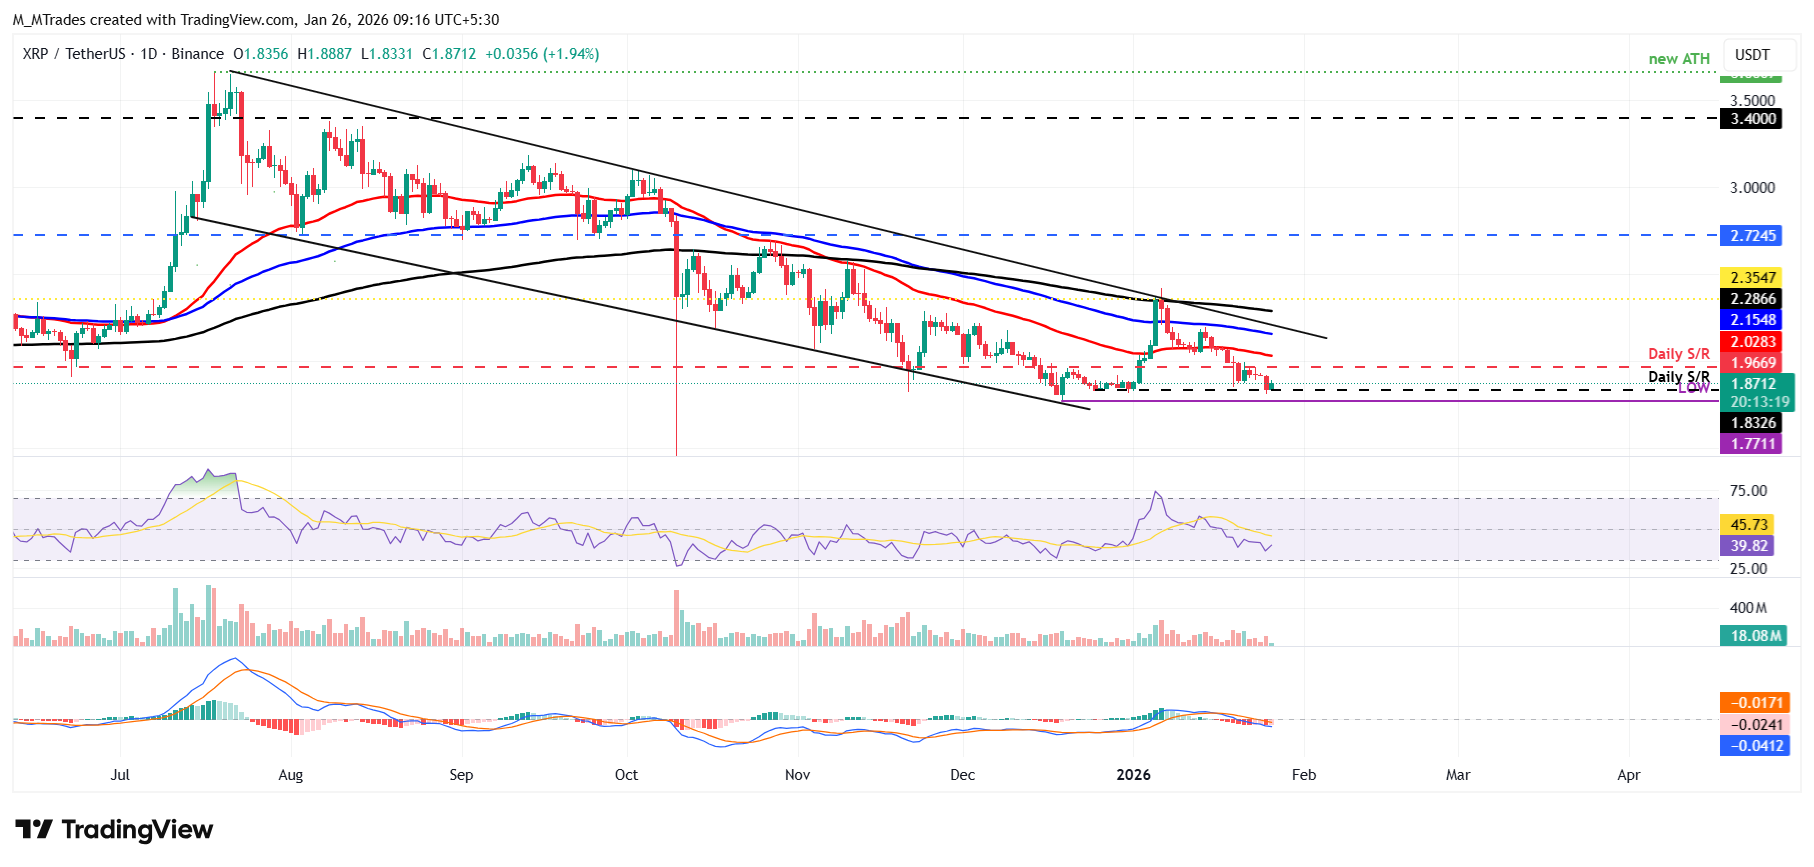
Conversely, if XRP closes below the daily support at $1.83, it could extend the decline toward the December 19 low of $1.77.
Cryptocurrency metrics FAQs
The developer or creator of each cryptocurrency decides on the total number of tokens that can be minted or issued. Only a certain number of these assets can be minted by mining, staking or other mechanisms. This is defined by the algorithm of the underlying blockchain technology. On the other hand, circulating supply can also be decreased via actions such as burning tokens, or mistakenly sending assets to addresses of other incompatible blockchains.
Market capitalization is the result of multiplying the circulating supply of a certain asset by the asset’s current market value.
Trading volume refers to the total number of tokens for a specific asset that has been transacted or exchanged between buyers and sellers within set trading hours, for example, 24 hours. It is used to gauge market sentiment, this metric combines all volumes on centralized exchanges and decentralized exchanges. Increasing trading volume often denotes the demand for a certain asset as more people are buying and selling the cryptocurrency.
Funding rates are a concept designed to encourage traders to take positions and ensure perpetual contract prices match spot markets. It defines a mechanism by exchanges to ensure that future prices and index prices periodic payments regularly converge. When the funding rate is positive, the price of the perpetual contract is higher than the mark price. This means traders who are bullish and have opened long positions pay traders who are in short positions. On the other hand, a negative funding rate means perpetual prices are below the mark price, and hence traders with short positions pay traders who have opened long positions.

超过一百万用户依赖 FXStreet 获取实时市场数据、图表工具、专家洞见和外汇新闻。其全面的经济日历和教育网络研讨会帮助交易者保持信息领先、做出审慎决策。FXStreet 拥有约 60 人的团队,分布在巴塞罗那总部及全球各地区。
阅读更多


