
Top 3 Price Prediction: Bitcoin, Ethereum, Ripple – BTC, ETH and XRP test key support after major correction
作者 Manish Chhetri
更新: 30 Mar 2026


热门文章

Bitcoin (BTC), Ethereum (ETH) and Ripple (XRP) retest key support levels on Monday after falling nearly 3%, 4% and 5%, respectively, in the previous week. BTC tests the lower channel support, ETH stabilizes around the midpoint of the consolidation zone, while XRP retests horizontal support.
- Bitcoin price holds near the lower boundary of the consolidating channel on Monday after correcting nearly 3% last week.
- Ethereum is finding support around the midpoint of the horizontal channel, signaling a critical test of that level.
- XRP holds the horizontal support at $1.30, if it holds, a recovery ahead is likely.
Bitcoin (BTC), Ethereum (ETH) and Ripple (XRP) retest key support levels on Monday after falling nearly 3%, 4% and 5%, respectively, in the previous week. BTC tests the lower channel support, ETH stabilizes around the midpoint of the consolidation zone, while XRP retests horizontal support. These top three cryptocurrencies are at a pivotal moment that could determine their next directional move.
Bitcoin could rebound if the lower boundary holds as support
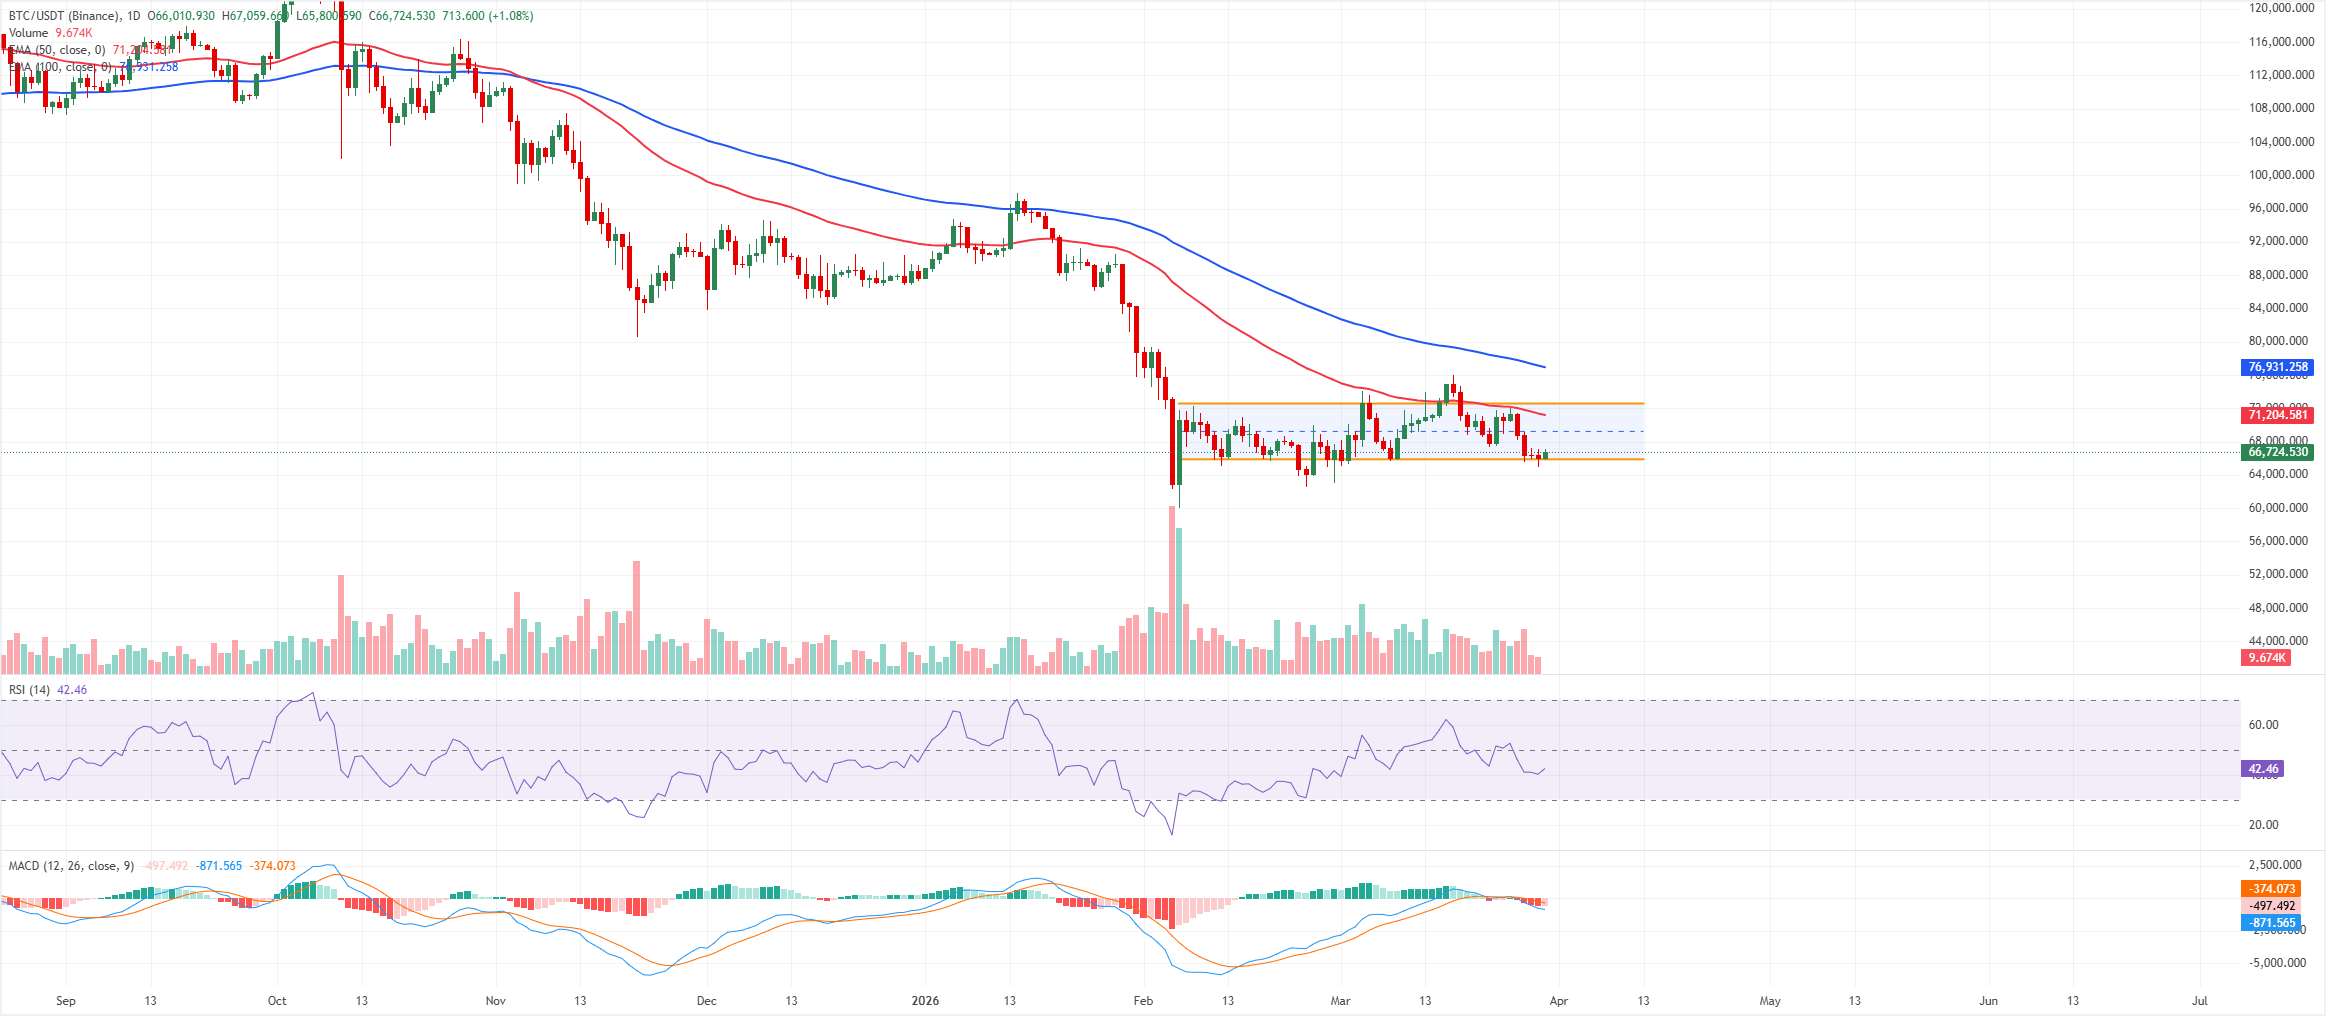
Bitcoin price is trading at $66,700 on Monday. Price holds near the lower boundary of the channel that caps rallies around $72,500 and guides a sequence of lower highs, keeping the near-term bias bearish. The pair trades well below the 50-day and 100-day Exponential Moving Averages, which are clustered above $71,000, underscoring overhead pressure and framing recent rebounds as corrective within the broader downswing.
The Relative Strength Index (RSI) on the daily chart around 42 stays below the 50 line, aligning with persistent selling pressure, while the Moving Average Convergence Divergence (MACD) indicator remains below its signal line and near the zero line, suggesting weak downside momentum rather than an aggressive selloff.
Immediate support emerges at the channel floor near $65,800, and a daily close below this area would expose the next downside band toward $64,000 and then $62,000.
On the upside, initial resistance sits at $69,000, where prior reaction highs converge with short-term supply, followed by a more important cap around $71,000, defined by the 50-day EMA. A break above $71,000 would be needed to challenge the channel top near $72,500 and start easing the prevailing bearish structure.
Ethereum finds support around the midpoint of the consolidating range
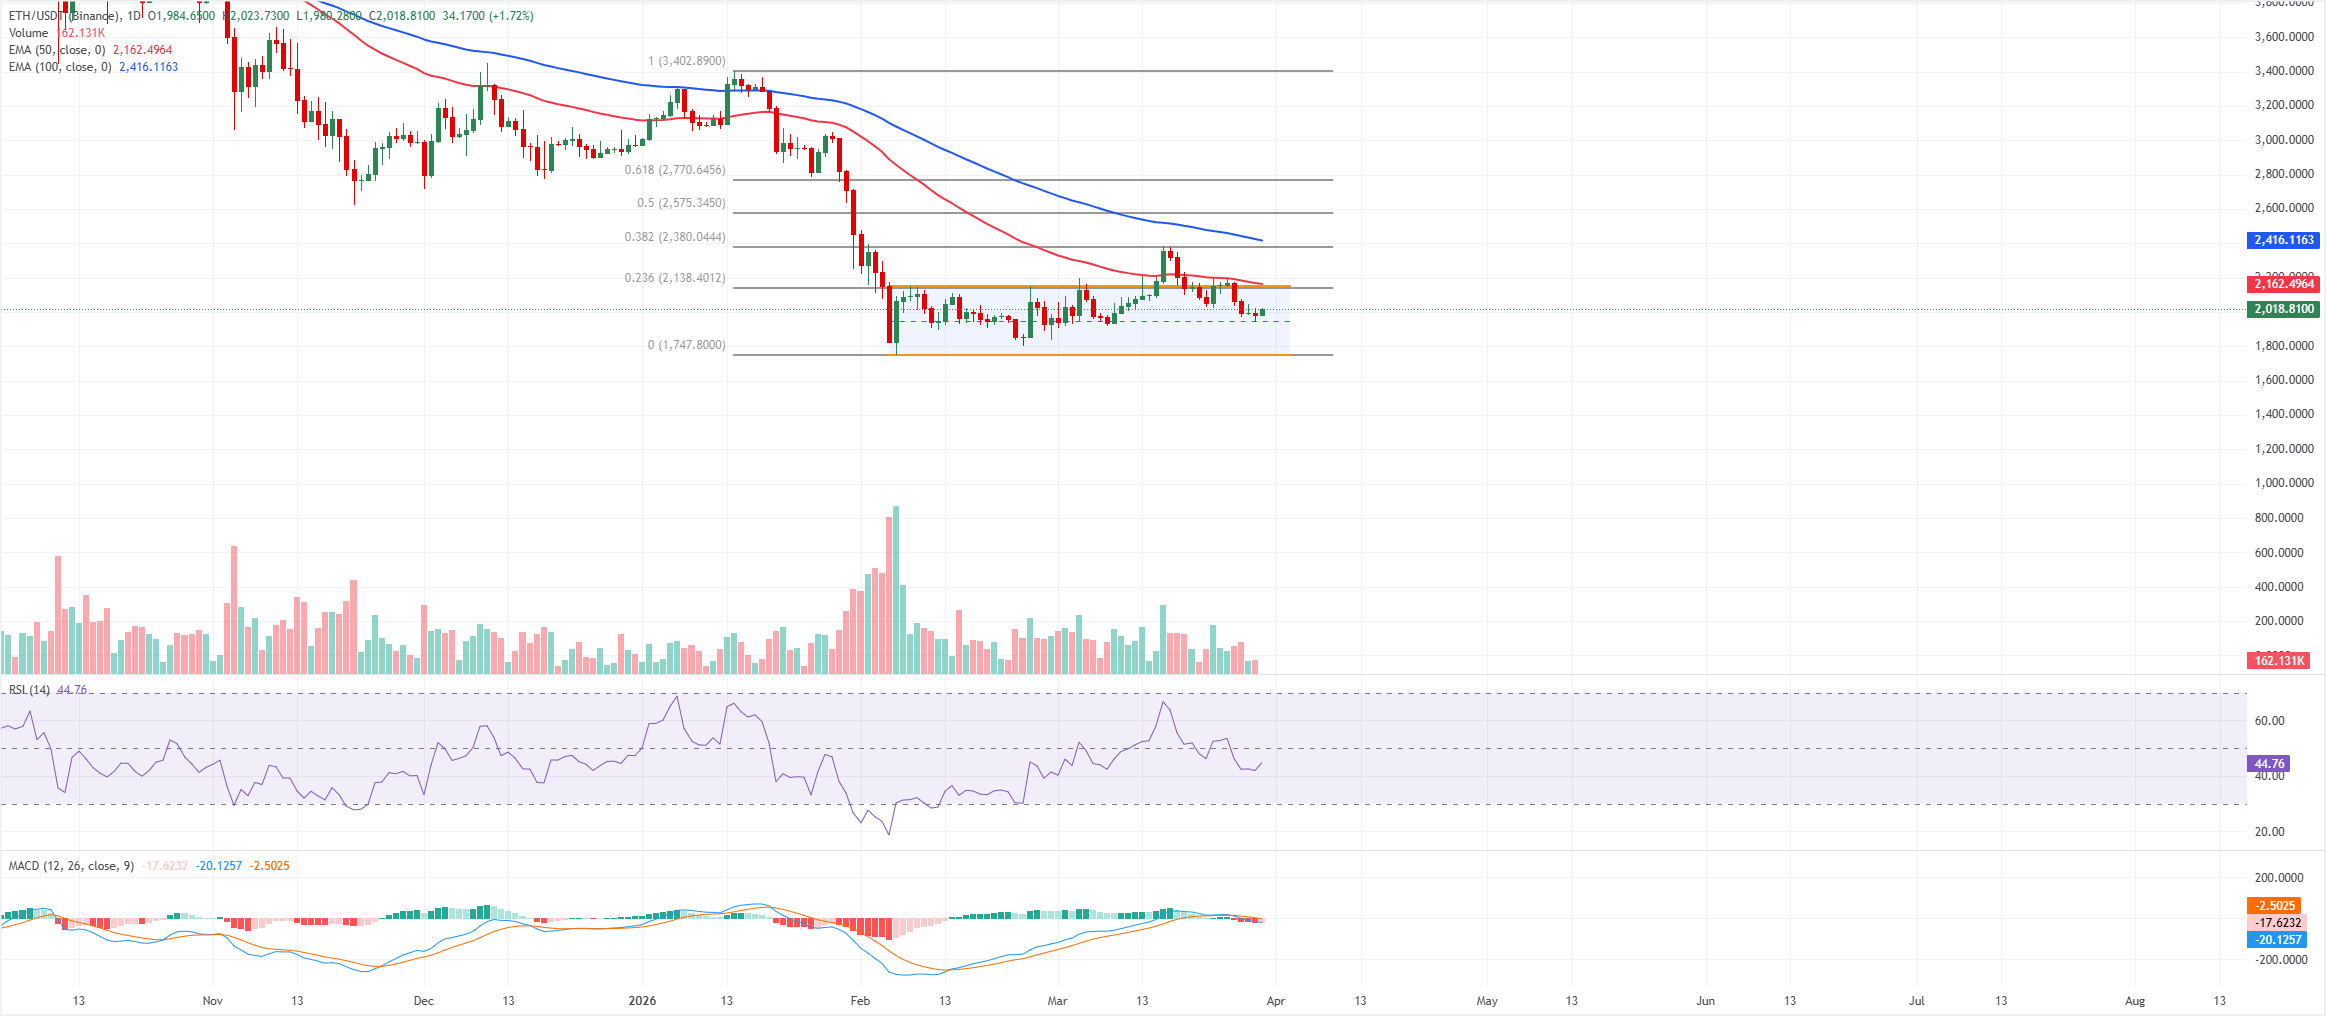
Ethereum price is trading at $2,019 on Monday. The near-term bias stays mildly bearish, with price holding below the channel’s mid-area and closer to its lower boundary than to the $2,148 top line, highlighting persistent downside pressure. The cluster of closes under the 50-day EMA near $2,160 keeps rallies capped, while the 100-day EMA, around $2,420, remains well above spot and reinforces a broader corrective phase.
Momentum has cooled, as the RSI on the daily chart at 44 drifts below the 50 midline and the MACD line trades below its signal and slips toward the zero mark, suggesting fading bullish attempts within the channel.
Immediate resistance stands at the 23.6% Fibonacci retracement from the $3,402 high to the $1,747 low at $2,138, with the channel top near $2,148 acting as a reinforcing cap; a daily close above this zone would open the way toward the 38.2% retracement at $2,380 and the 50-day EMA around $2,160, turning into a supporting base.
On the downside, initial support aligns with the recent lows near $1,990, followed by the channel floor at $1,748, where the Fibonacci origin also sits; a clean break below this area would extend the bearish sequence within the channel and expose further weakness in the coming sessions.
XRP retests the key horizontal support at $1.30
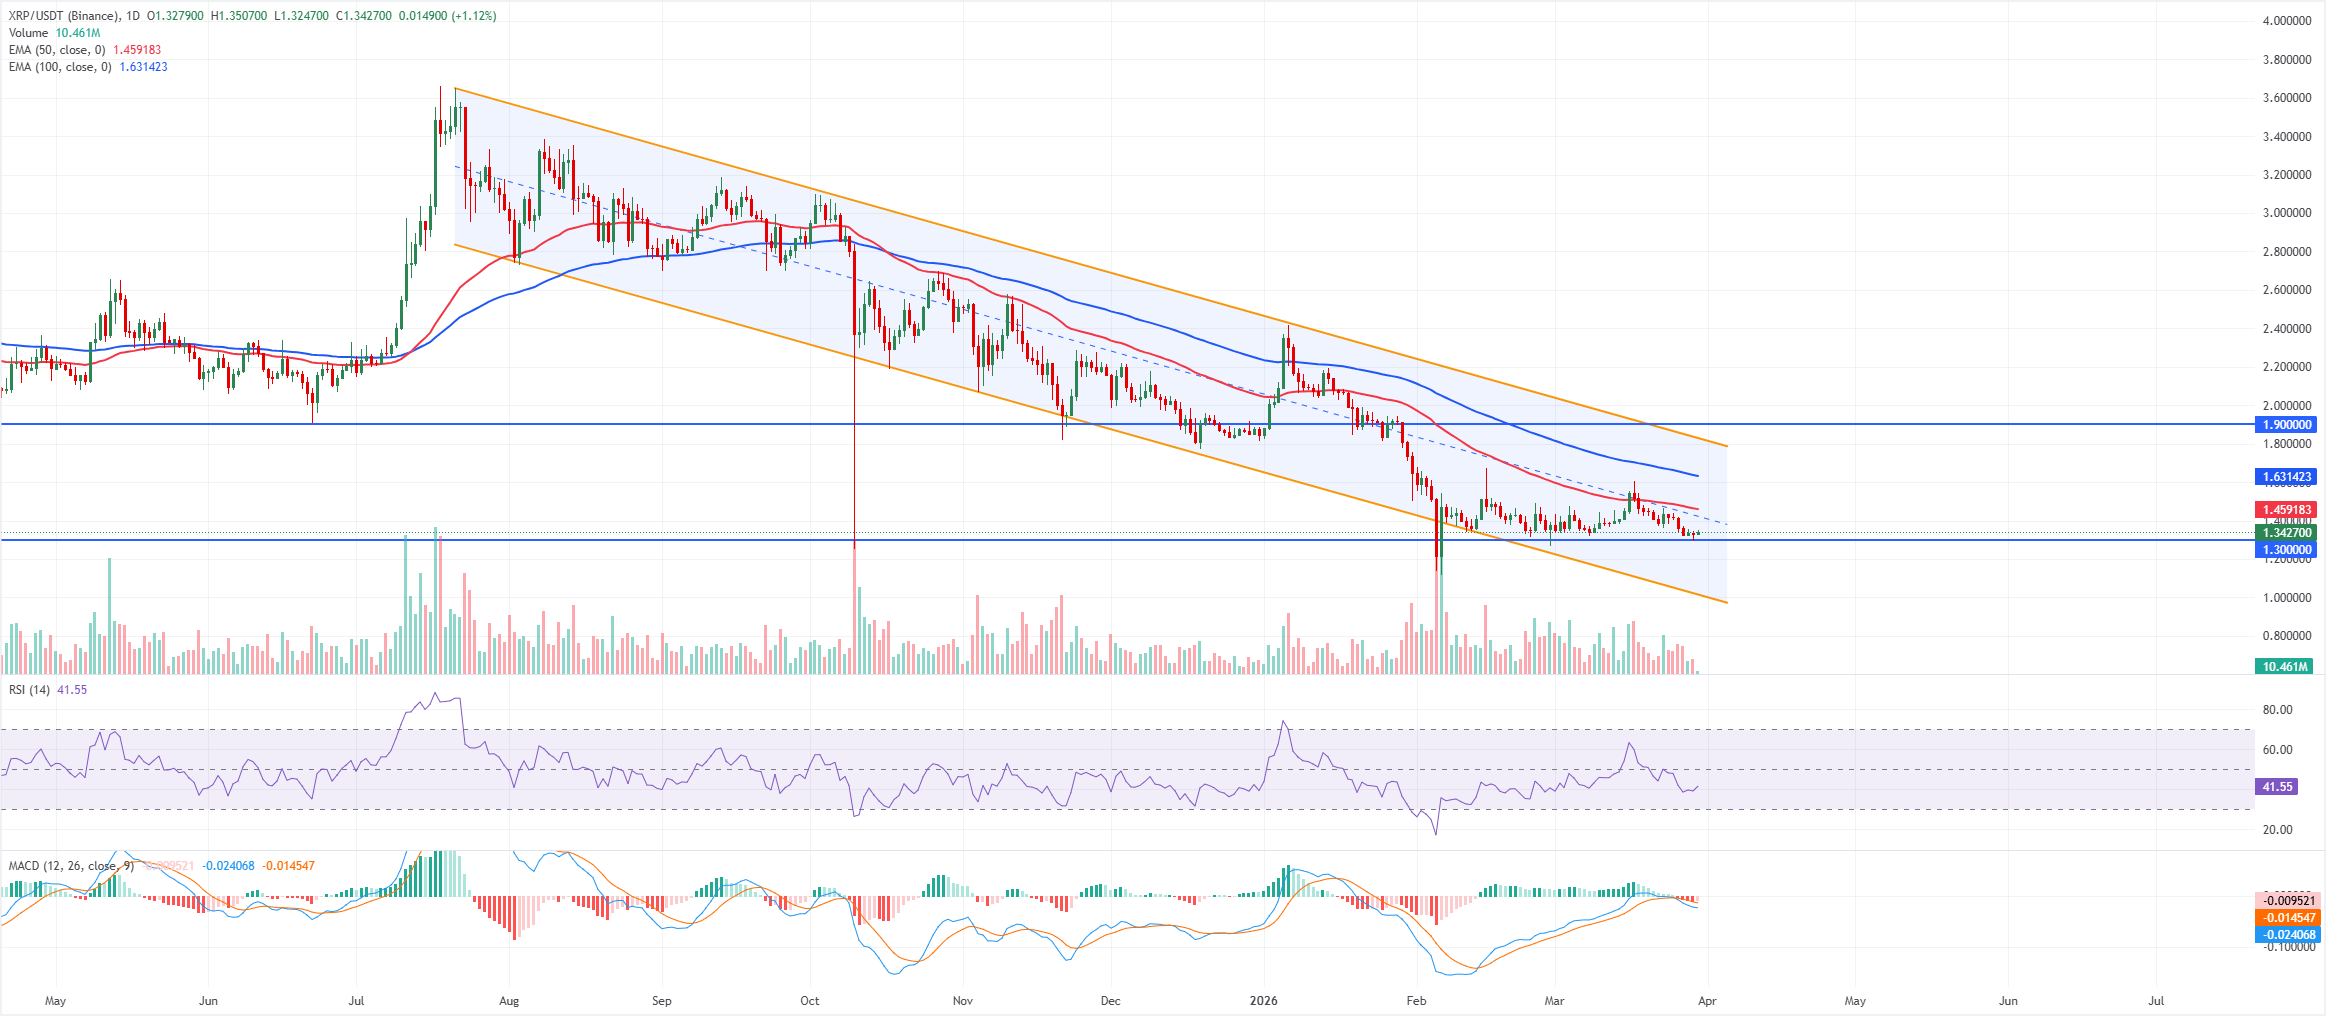
XRP price is trading at $1.34 on Monday. The near-term bias stays bearish as price holds well below the descending channel’s mid-point and trades under the 50-day and 100-day EMAs, which continue to slope lower and cap rebounds.
The RSI on the daily chart is at 41, pointing to subdued momentum, while the MACD line remains below the signal line and has slipped into negative territory, reinforcing persistent downside pressure within the broader falling structure.
Initial support is near $1.30, where a horizontal floor aligns with the lower half of the descending channel and defines the next downside pivot. A clear break below this area would expose the channel base closer to $1.01.
On the upside, the first resistance comes in around $1.45, where recent swing highs converge with the declining 50-day EMA, followed by stronger resistance near $1.90 at the upper boundary of the channel, which would need to give way to neutralize the prevailing bearish outlook.
(The technical analysis of this story was written with the help of an AI tool.)
Cryptocurrency metrics FAQs
The developer or creator of each cryptocurrency decides on the total number of tokens that can be minted or issued. Only a certain number of these assets can be minted by mining, staking or other mechanisms. This is defined by the algorithm of the underlying blockchain technology. On the other hand, circulating supply can also be decreased via actions such as burning tokens, or mistakenly sending assets to addresses of other incompatible blockchains.
Market capitalization is the result of multiplying the circulating supply of a certain asset by the asset’s current market value.
Trading volume refers to the total number of tokens for a specific asset that has been transacted or exchanged between buyers and sellers within set trading hours, for example, 24 hours. It is used to gauge market sentiment, this metric combines all volumes on centralized exchanges and decentralized exchanges. Increasing trading volume often denotes the demand for a certain asset as more people are buying and selling the cryptocurrency.
Funding rates are a concept designed to encourage traders to take positions and ensure perpetual contract prices match spot markets. It defines a mechanism by exchanges to ensure that future prices and index prices periodic payments regularly converge. When the funding rate is positive, the price of the perpetual contract is higher than the mark price. This means traders who are bullish and have opened long positions pay traders who are in short positions. On the other hand, a negative funding rate means perpetual prices are below the mark price, and hence traders with short positions pay traders who have opened long positions.

超过一百万用户依赖 FXStreet 获取实时市场数据、图表工具、专家洞见和外汇新闻。其全面的经济日历和教育网络研讨会帮助交易者保持信息领先、做出审慎决策。FXStreet 拥有约 60 人的团队,分布在巴塞罗那总部及全球各地区。
阅读更多


