
Top 3 Price Prediction: Bitcoin, Ethereum, Ripple – BTC extends rally, ETH and XRP near key resistance zones
作者 Manish Chhetri
更新: 4 May 2026


热门文章

Bitcoin (BTC) pushes higher on Monday, trading above $80,000 and resuming its uptrend after a brief consolidation phase last week.
- Bitcoin extends gains on Monday after taking a breather in the previous week.
- Ethereum approaches the 200-day EMA, a decisive close above this level could open the door for an upside move.
- XRP hovers near the $1.40 resistance zone, a breakout above this barrier may trigger a fresh rally.
Bitcoin (BTC) pushes higher on Monday, trading above $80,000 and resuming its uptrend after a brief consolidation phase last week. Ethereum (ETH) and Ripple (XRP) follow BTC’s footsteps and extend gains at the start of the week, nearing their key resistance zones, where a breakout suggests a fresh rally ahead.
Bitcoin hits $80,000
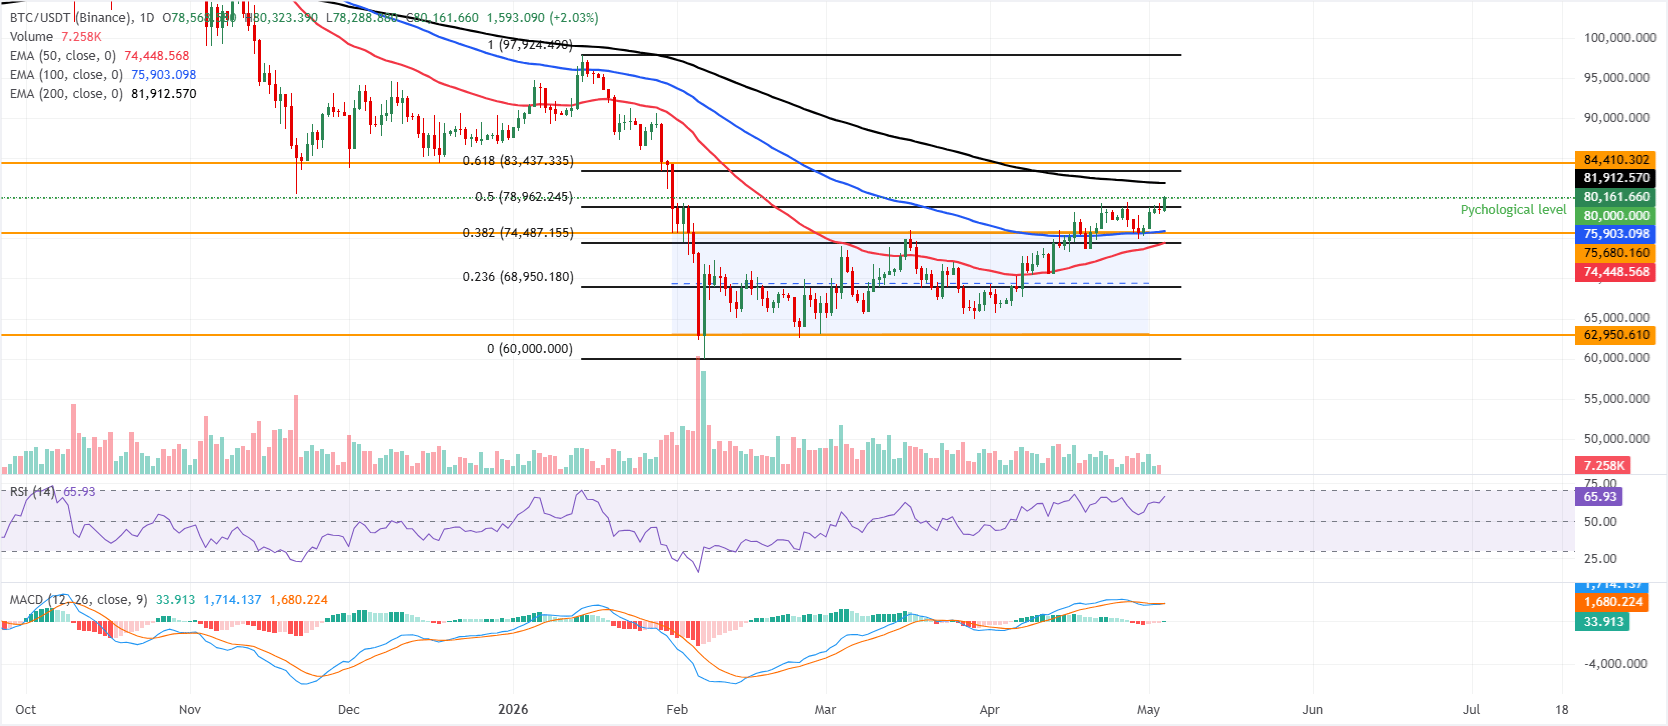
Bitcoin price is trading at $80,161 on Monday, retaining a constructive bias as it holds above a dense support band defined by the 50% retracement at $78,962 (drawn from the January high to the February low) and the 100-day Exponential Moving Average (EMA) near $75,903. The shorter-term 50-day EMA around $74,448 reinforces the underlying uptrend.
Momentum remains firm, as the Relative Strength Index (RSI) on the daily chart hovers in bullish territory near 66, and the Moving Average Convergence Divergence (MACD) has turned higher and returned to positive territory, hinting that buyers still control the near-term tone despite the proximity to major overhead barriers.
On the topside, initial resistance emerges at the 200-day EMA around $81,912, followed by the 61.8% Fibonacci retracement at $83,437 and a more prominent horizontal cap near $84,410; a daily close above this cluster would open the way toward the January highs around $97,924.
On the downside, immediate support is seen at the psychological $80,000 handle, with the 50% retracement at $78,962 as the first substantive floor; a deeper pullback would expose a broader demand area between the 100-day EMA at $75,903, the prior channel top near $75,680, where buyers would be expected to re-emerge while the broader bullish structure remains intact.
Ethereum could extend gains if it closes above the 50-day EMA
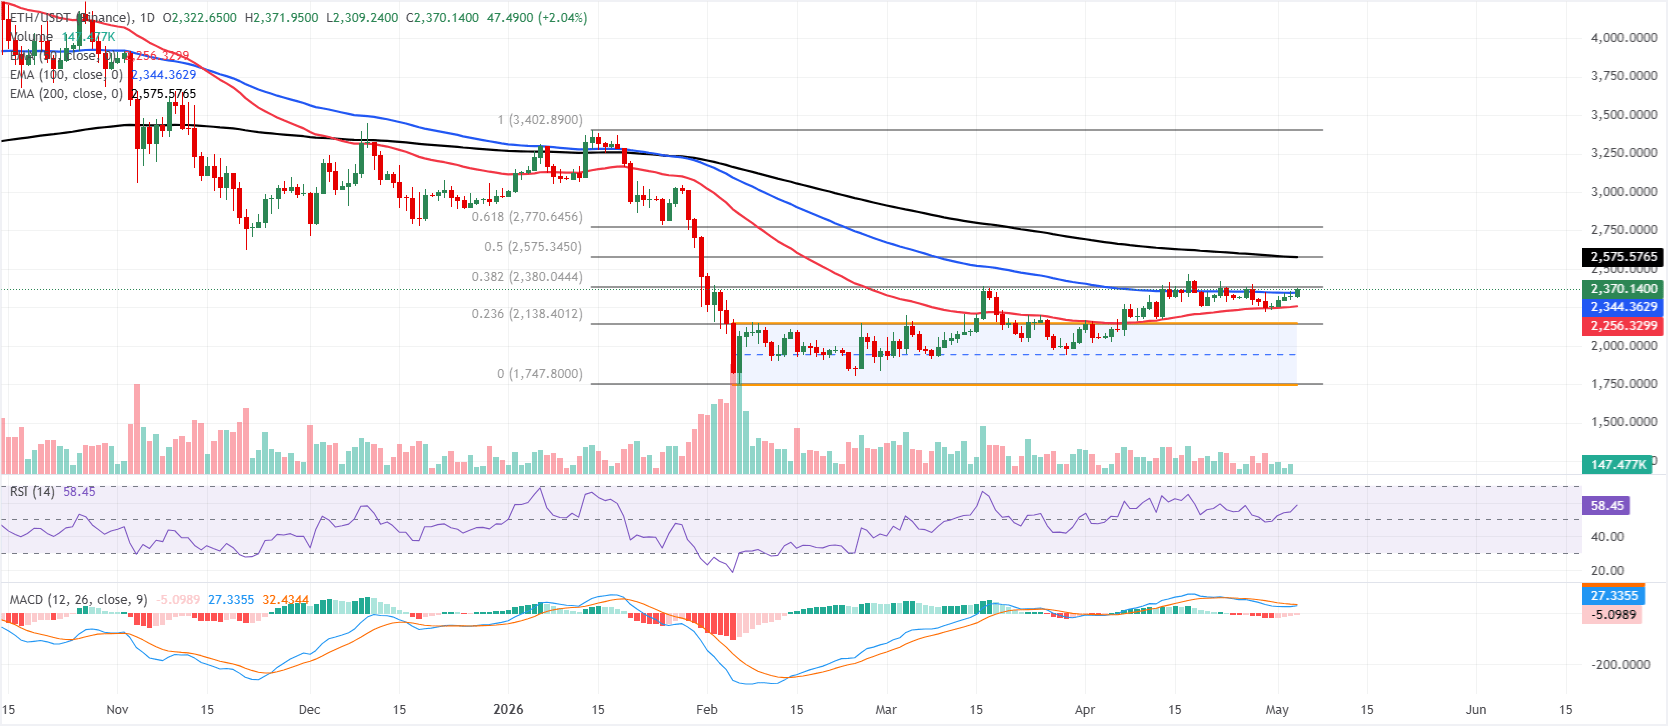
Ethereum is trading at $2,370 on Monday, maintaining a constructive near-term bias as price holds above the 50-day and 100-day EMA at roughly $2,256 and $2,344, respectively. ETH, however, is approaching a dense Fibonacci barrier, with the 38.2% retracement at $2,380 capping the immediate topside, while higher retracements and the 200-day EMA, clustered around $2,575, reinforce broader overhead supply.
A rising RSI on the daily chart near 58 suggests firm but not overstretched bullish momentum, while the negative yet improving MACD histogram hints that downside pressure is fading within this developing up-leg.
On the upside, initial resistance is located at the 38.2% Fibonacci retracement at $2,380, beyond which the $2,575 area forms a critical confluence zone, combining the 50% retracement at $2,575 with the 200-day EMA at $2,575; a daily close above this cluster would open the way toward the 61.8% Fibonacci retracement at $2,770.
On the downside, immediate support emerges at the 100-day EMA at $2,344, followed by the 50-day EMA at $2,256, while the upper boundary of the horizontal parallel channel around $2,148 and the 23.6% retracement at $2,138 guard the broader bullish structure, with only a drop toward the channel floor near $1,747 threatening the medium-term uptrend.
XRP is near key resistance at $1.40
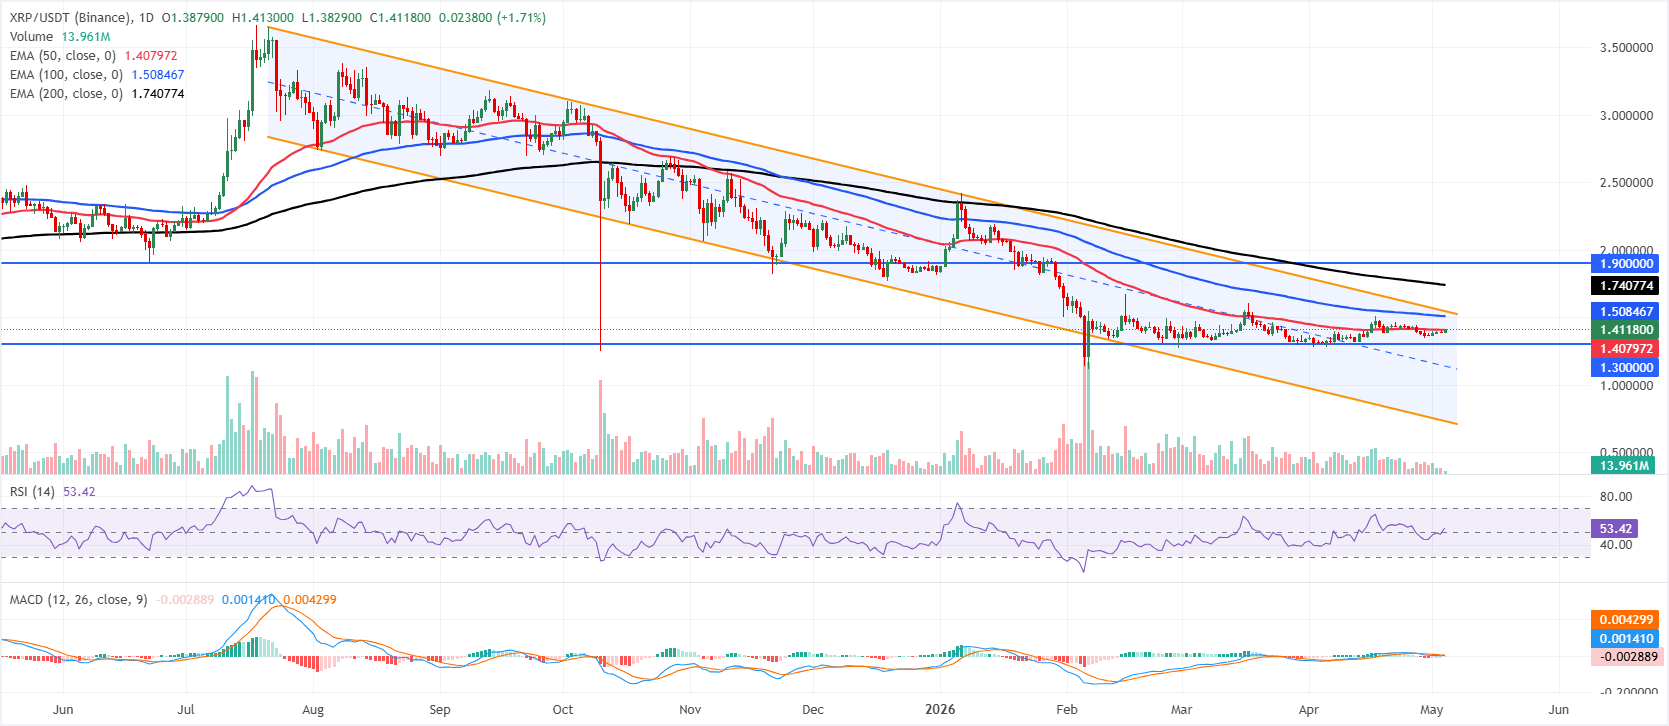
XRP price is trading at $1.41 on Monday, is hovering just above the 50-day EMA at $1.40, which lends initial trend support, but it remains well below the 100-day EMA at 1.50 and the broader downward parallel channel cap near $1.54, keeping the medium-term tone capped within a broader corrective structure.
The RSI at 53 suggests mildly positive but not overstretched momentum, while the MACD has slipped slightly into negative territory, hinting that upside traction may be fading as price consolidates under higher EMAs.
On the topside, immediate resistance is located at the 100-day EMA around $1.50, followed by the upper boundary of the descending channel near $1.55; a sustained break above these would be needed to challenge the 200-day EMA at $1.74 and the more distant horizontal barrier at $1.90.
On the downside, the 50-day EMA at $1.40 underpins the market as first support, ahead of the horizontal floor at $1.30, while the channel base down at $0.73 marks the broader structural support zone in the event of a deeper pullback.
(The technical analysis of this story was written with the help of an AI tool.)
Cryptocurrency metrics FAQs
The developer or creator of each cryptocurrency decides on the total number of tokens that can be minted or issued. Only a certain number of these assets can be minted by mining, staking or other mechanisms. This is defined by the algorithm of the underlying blockchain technology. On the other hand, circulating supply can also be decreased via actions such as burning tokens, or mistakenly sending assets to addresses of other incompatible blockchains.
Market capitalization is the result of multiplying the circulating supply of a certain asset by the asset’s current market value.
Trading volume refers to the total number of tokens for a specific asset that has been transacted or exchanged between buyers and sellers within set trading hours, for example, 24 hours. It is used to gauge market sentiment, this metric combines all volumes on centralized exchanges and decentralized exchanges. Increasing trading volume often denotes the demand for a certain asset as more people are buying and selling the cryptocurrency.
Funding rates are a concept designed to encourage traders to take positions and ensure perpetual contract prices match spot markets. It defines a mechanism by exchanges to ensure that future prices and index prices periodic payments regularly converge. When the funding rate is positive, the price of the perpetual contract is higher than the mark price. This means traders who are bullish and have opened long positions pay traders who are in short positions. On the other hand, a negative funding rate means perpetual prices are below the mark price, and hence traders with short positions pay traders who have opened long positions.

超过一百万用户依赖 FXStreet 获取实时市场数据、图表工具、专家洞见和外汇新闻。其全面的经济日历和教育网络研讨会帮助交易者保持信息领先、做出审慎决策。FXStreet 拥有约 60 人的团队,分布在巴塞罗那总部及全球各地区。
阅读更多


