
Top 3 Price Prediction: Bitcoin, Ethereum, Ripple – BTC falls to key support, ETH and XRP remain under pressure
作者 Manish Chhetri
更新: 18 May 2026


热门文章

Bitcoin (BTC), Ethereum (ETH) and Ripple (XRP) begin the week on a weaker footing after correcting over 5%, 10% and 4% in the previous week.
- Bitcoin nears key support on Monday after falling by more than 5.78% the previous week.
- Ethereum trades below $2,200, after correcting over 10% in the previous week.
- XRP keeps a bearish near-term tone as price holds below the 50-day EMA at $1.41.
Bitcoin (BTC), Ethereum (ETH) and Ripple (XRP) begin the week on a weaker footing after correcting over 5%, 10% and 4% in the previous week. BTC is near key support after losses last week, while ETH and XRP remain under pressure and slip below critical support levels, keeping the near-term bearish outlook intact.
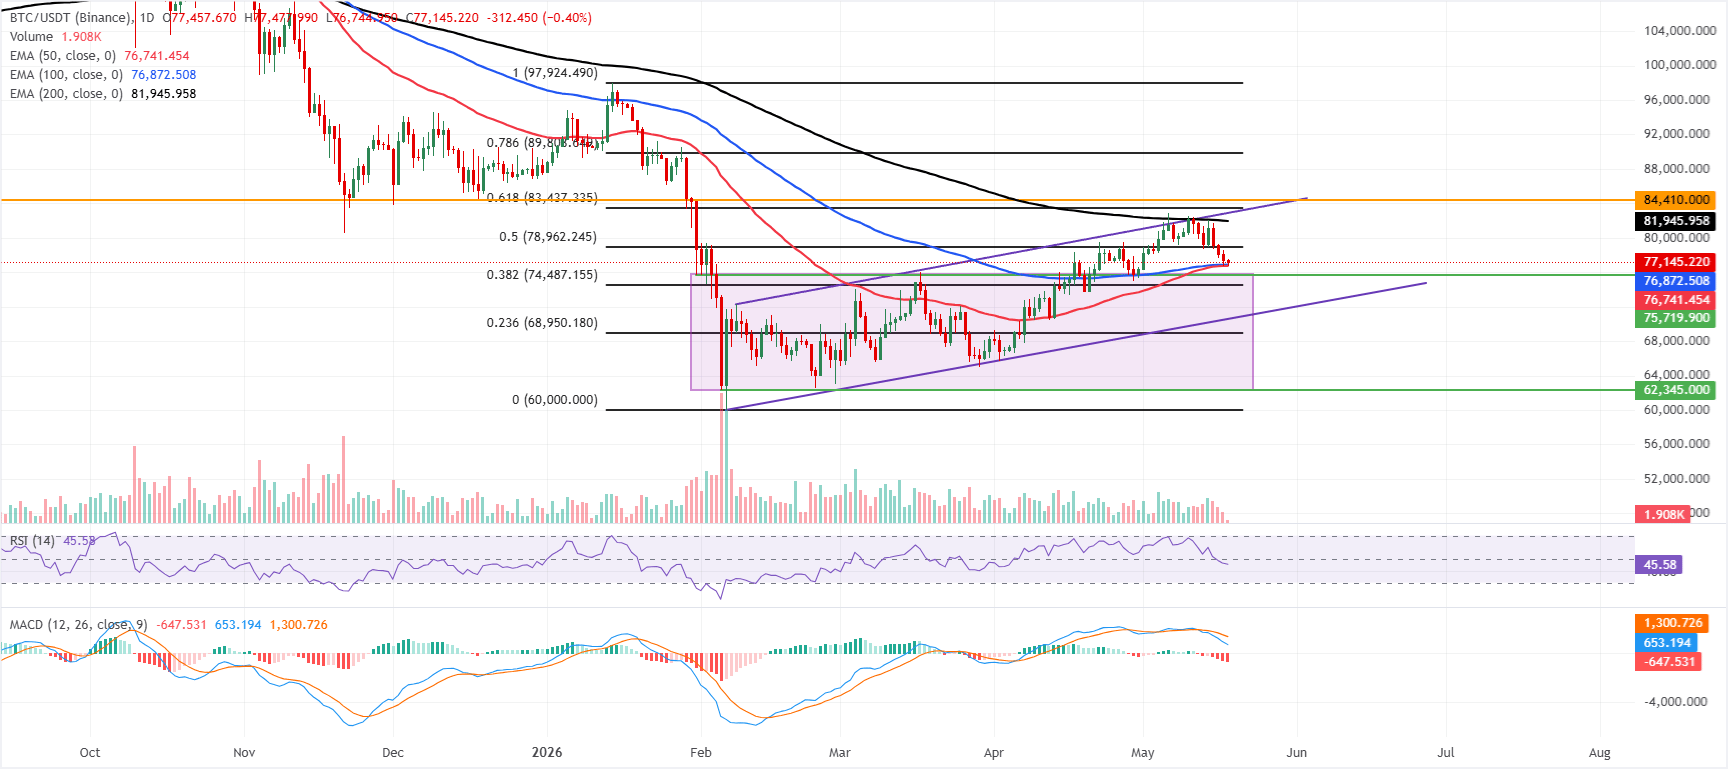
Bitcoin corrects to test key support
Bitcoin price trades at $77,145 on Monday after correcting by over 5% in the previous week. The Crypto King shows a neutral-to-bearish near-term tone, as price holds just above the 50-day and 100-day Exponential Moving Averages (EMAs) at $76,741 and $76,872, respectively, but remains clearly capped beneath the 200-day EMA at $81,945.
The failed push beyond recent highs has shifted momentum lower, with the Relative Strength Index (RSI) slipping toward the mid-40s and the Moving Average Convergence Divergence (MACD) deeply negative, suggesting fading bullish pressure. At the same time, the broader uptrend off the $60,000 base remains intact.
On the downside, initial support is seen at the 50-day and 100-day EMAs clustered just under the market, followed by the 38.2% Fibonacci retracement at roughly $74,487, with the prior trendline breakout area near $70,576 and the 23.6% retracement around $68,950 protecting the wider bullish structure above the $60,000 swing low.
On the topside, immediate resistance emerges at the 50% retracement near $78,962, ahead of the 200-day EMA around $81,945, while a clearer bullish continuation would likely require a daily close above the 61.8% retracement at about $83,437 and the horizontal barrier near $84,410.
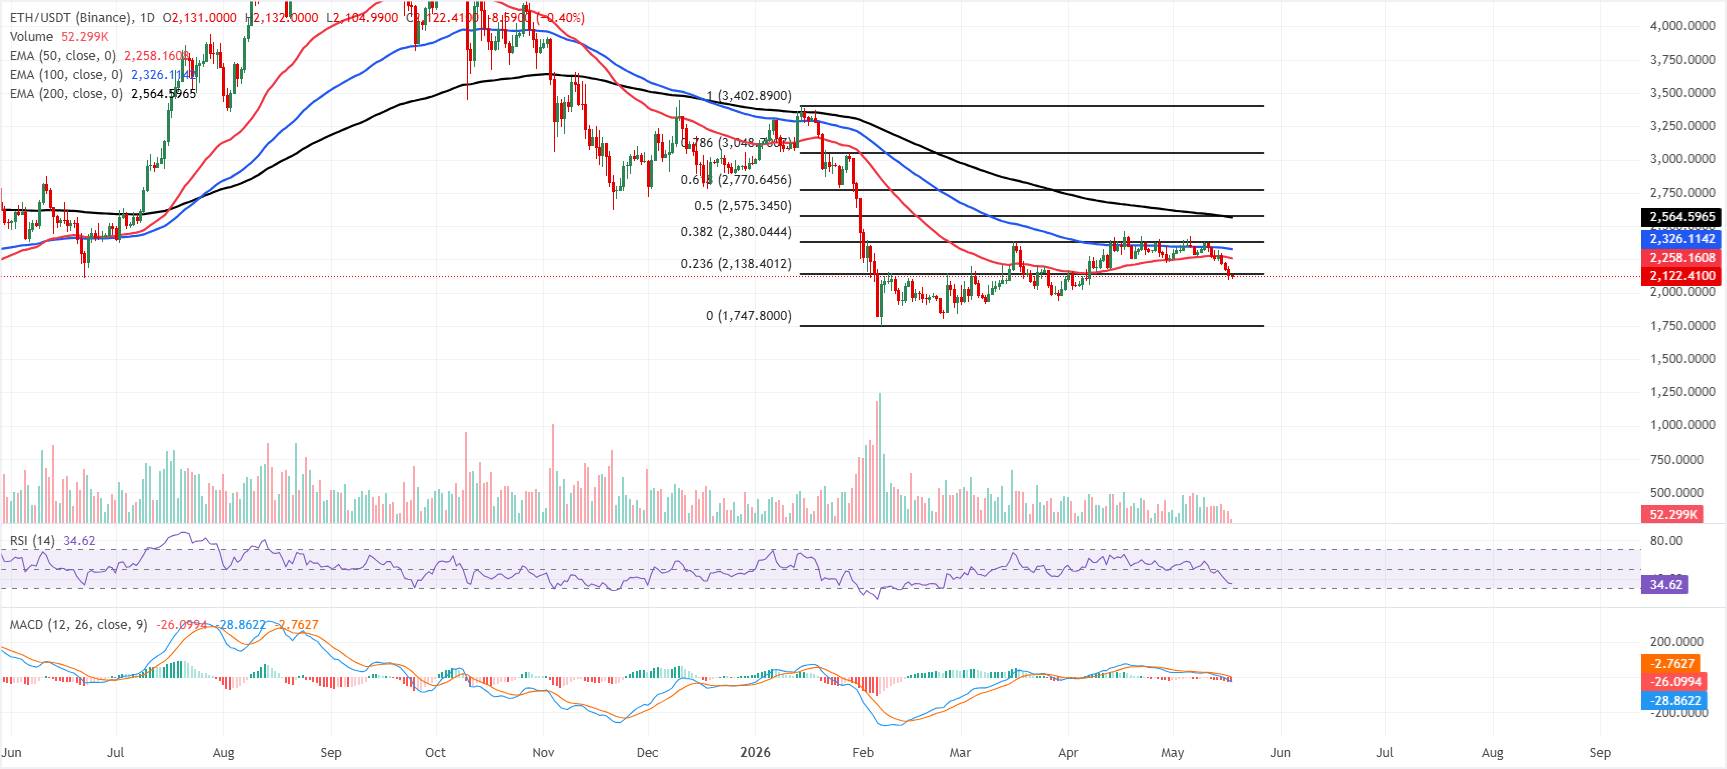
Ethereum slips below key support
Ethereum is trading at $2,122 on Monday, keeping a bearish near-term tone as it holds beneath the 50-day, 100-day, and 200-day EMAs and below key Fibonacci retracement levels of the latest upswing. The RSI near 34 indicates weak momentum, leaning toward oversold territory, while the MACD remains deeply negative, suggesting downside pressure persists despite the proximity of prior demand zones.
On the topside, initial resistance appears at the 23.6% Fibonacci retracement at $2,138, with further hurdles at the 50-day EMA near $2,258 and the 100-day EMA around $2,326; above these, the 38.2% retracement at $2,380 and the 200-day EMA close to $2,564 precede a stronger barrier at the 50% retracement near $2,575.35 and the 61.8% level at $2,770.65.
On the downside, structural support is only clearly defined by the prior cycle low around $1,747, and a sustained break below it would open the door to a deeper correction phase in the broader trend.
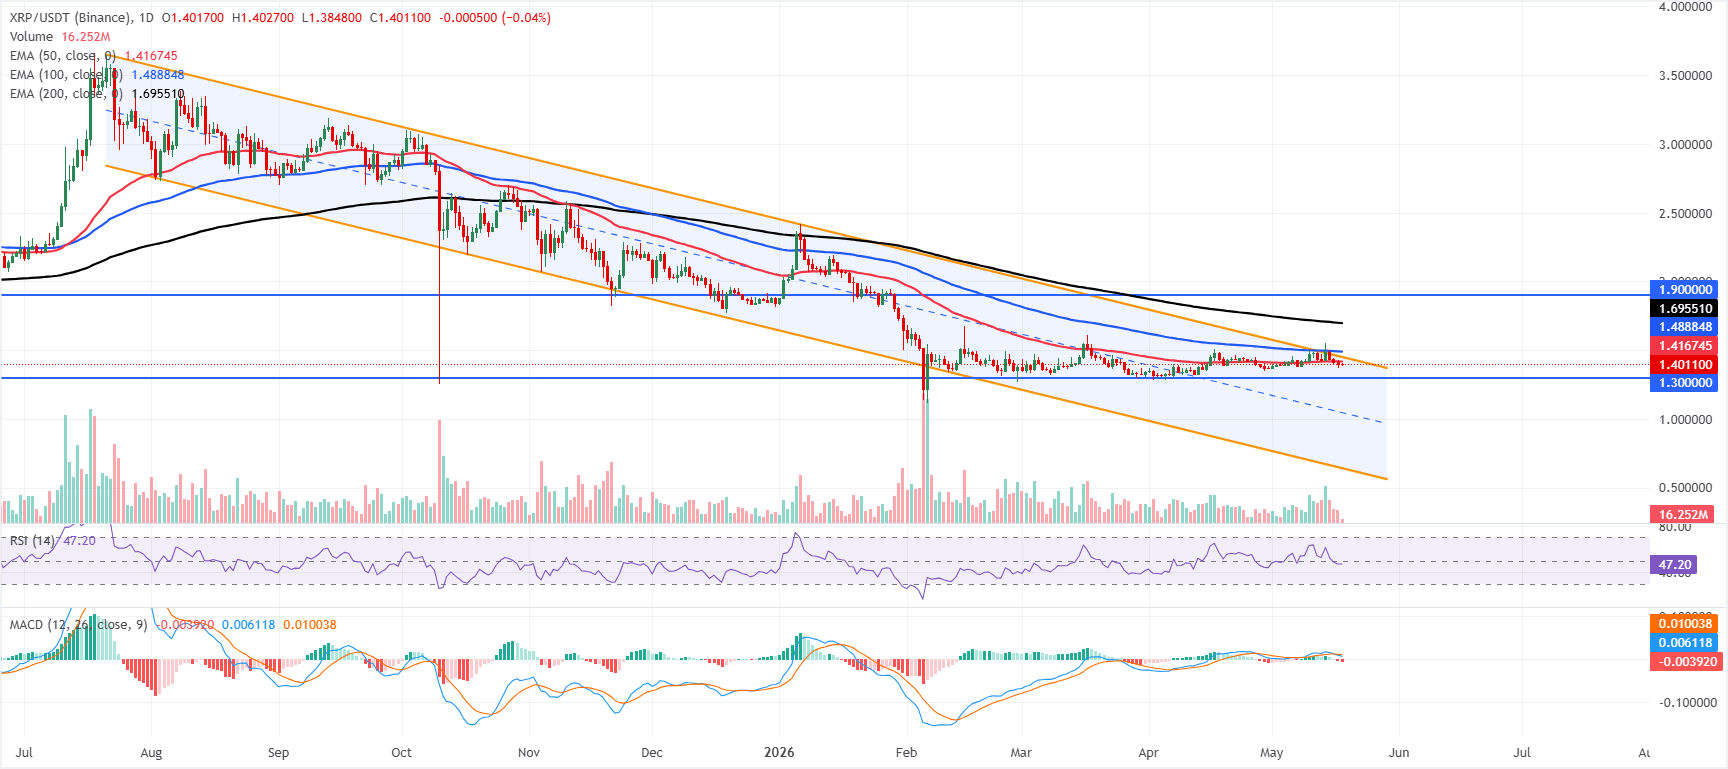
XRP hints at further losses
XRP is trading at $1.40 on Monday, maintaining a bearish near-term tone as it holds below the 50-day, 100-day, and 200-day EMAs. The pair is capped first by the 50-day EMA around $1.41, with the upper boundary of the existing downward parallel channel near $1.44 reinforcing overhead pressure. At the same time, a sub-50 RSI around 47 and a negative MACD line below zero both hint that upside attempts are likely to remain limited for now.
On the topside, initial resistance stands at the 50-day EMA at $1.41, followed by the channel boundary near $1.44; beyond that, the 100-day EMA at $1.48 and the distant 200-day EMA near $1.69 are likely to act as progressively stronger caps ahead of the horizontal barrier at $1.90.
On the downside, the key level to watch is the horizontal support at $1.30, where a break would expose deeper losses within the broader bearish structure.
(The technical analysis of this story was written with the help of an AI tool.)
Cryptocurrency prices FAQs
Token launches influence demand and adoption among market participants. Listings on crypto exchanges deepen the liquidity for an asset and add new participants to an asset’s network. This is typically bullish for a digital asset.
A hack is an event in which an attacker captures a large volume of the asset from a DeFi bridge or hot wallet of an exchange or any other crypto platform via exploits, bugs or other methods. The exploiter then transfers these tokens out of the exchange platforms to ultimately sell or swap the assets for other cryptocurrencies or stablecoins. Such events often involve an en masse panic triggering a sell-off in the affected assets.
Macroeconomic events like the US Federal Reserve’s decision on interest rates influence crypto assets mainly through the direct impact they have on the US Dollar. An increase in interest rate typically negatively influences Bitcoin and altcoin prices, and vice versa. If the US Dollar index declines, risk assets and associated leverage for trading gets cheaper, in turn driving crypto prices higher.
Halvings are typically considered bullish events as they slash the block reward in half for miners, constricting the supply of the asset. At consistent demand if the supply reduces, the asset’s price climbs.

超过一百万用户依赖 FXStreet 获取实时市场数据、图表工具、专家洞见和外汇新闻。其全面的经济日历和教育网络研讨会帮助交易者保持信息领先、做出审慎决策。FXStreet 拥有约 60 人的团队,分布在巴塞罗那总部及全球各地区。
阅读更多


