
Top 3 Price Prediction: Bitcoin, Ethereum, Ripple – BTC slides to a fresh yearly low, ETH breaks down, XRP signals more losses
作者 Manish Chhetri
更新: 26 Jun 2026


热门文章

Bitcoin (BTC), Ethereum (ETH) and Ripple (XRP) remain under heavy selling pressure on Friday, falling over 7%, 9% and 8%, respectively, so far this week. BTC has fallen to a fresh yearly low, ETH slipped below key support, while XRP continues to lose momentum.
- Bitcoin remains under pressure, trading below $59,800 on Friday and extending losses by over 7% so far this week.
- Ethereum extends its correction, slipping below $1,550 and increasing the risk of a deeper decline.
- XRP sellers in control of momentum suggest further price correction.
Bitcoin (BTC), Ethereum (ETH) and Ripple (XRP) remain under heavy selling pressure on Friday, falling over 7%, 9% and 8%, respectively, so far this week. BTC has fallen to a fresh yearly low, ETH slipped below key support, while XRP continues to lose momentum. The technical outlook for these top three cryptocurrencies suggests bears remain firmly in control, hinting at deeper losses.
Bitcoin slips to a fresh yearly low
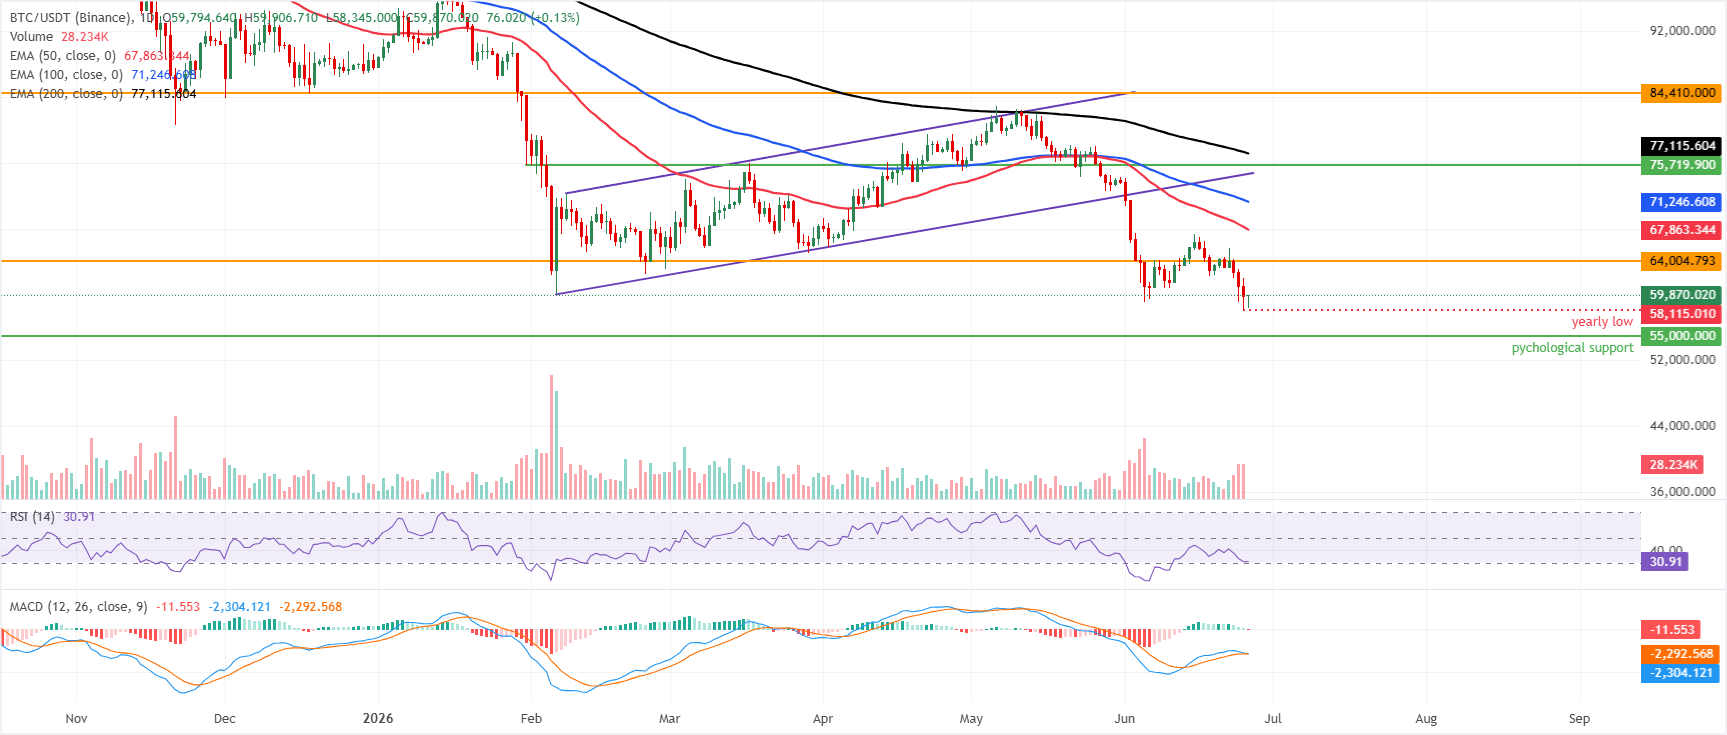
Bitcoin price trades at $59,818 on Friday, recovering slightly after reaching a fresh yearly low of $58,115 on the previous day. BTC is maintaining a bearish near-term bias and remains well below the 50-day, 100-day, and 200-day Exponential Moving Averages (EMAs) at $67,863, $71,246, and $77,115, respectively.
BTC recently bounced from oversold territory, with the Relative Strength Index (RSI) at 30 hovering just above the neutral line. At the same time, the Moving Average Convergence Divergence (MACD) has rolled lower toward the zero area, suggesting waning recovery momentum after the latest corrective uptick.
On the topside, initial resistance appears at the horizontal barrier near $64,004, ahead of the 50-day EMA at $67,863, with the 100-day EMA at $71,246 and the 200-day EMA at $77,115 reinforcing a broader cap before the major structural ceiling at $84,410.
On the downside, the next notable support is seen at the horizontal level around $55,000, where buyers could attempt to slow the decline if selling pressure extends.
Ethereum closed below key support zones
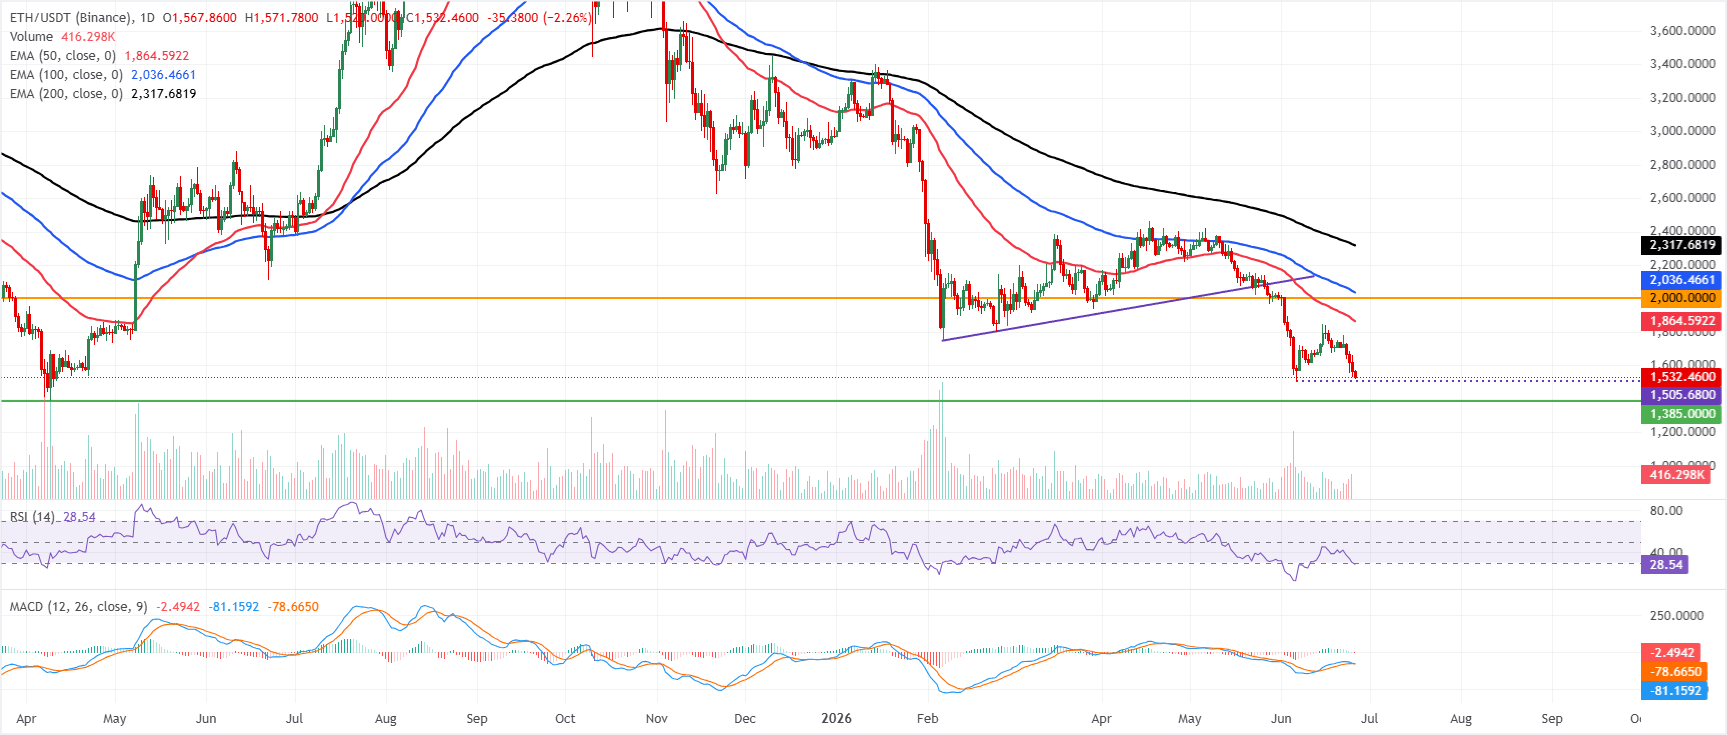
Ethereum price trades at $1,532 on Friday, extending its bearish bias as it remains well under the 50-, 100-day, and 200-day EMAs, clustered between roughly $1,865 and $2,320. ETH has slipped away from the previously tested $2,000 horizontal barrier, keeping price capped by overhead supply. In contrast, the RSI at 28 slips into oversold territory and the MACD remains slightly negative, hinting at persistent but gradually weakening downside momentum.
On the topside, immediate resistance is seen at the $2,000 horizontal level, followed by the 50-day EMA near $1,864, with the 100-day EMA at $2,036 and the 200-day EMA at $2,317 reinforcing a broader bearish structure overhead.
On the downside, the current area around $1,532 acts as a near-term price reference. At the same time, stronger support appears at the $1,385 horizontal floor, where sellers could hesitate, and short covering may emerge if the decline extends.
XRP bears are in control of the momentum
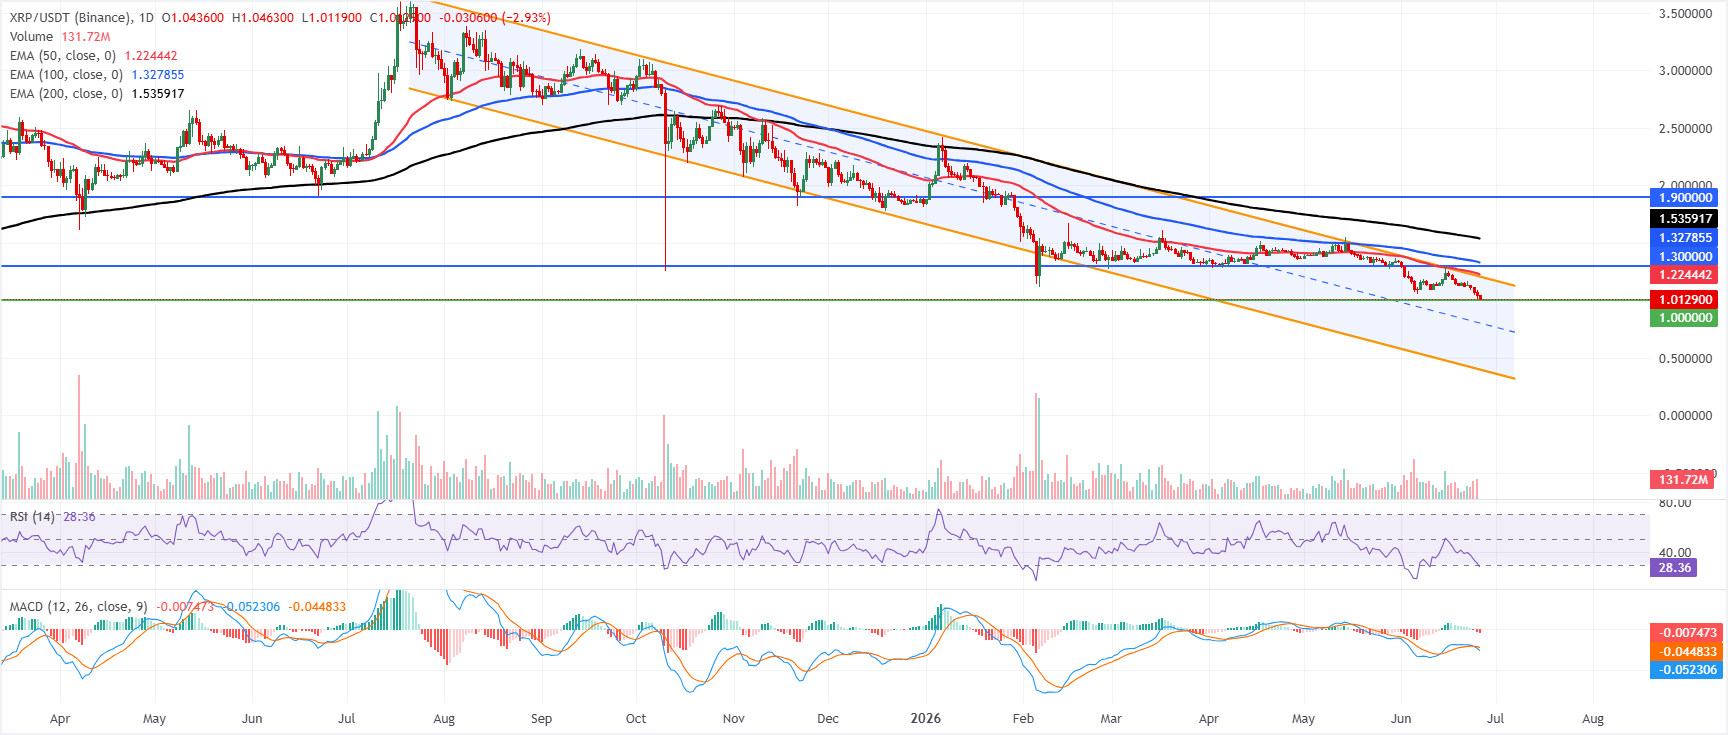
XRP price trades at $1.012 on Friday, maintaining a clear bearish bias as it remains below the 50-day, 100-day, and 200-day EMAs, clustered between roughly $1.220 and $1.540. XRP also remains within a downward parallel channel, with the active barrier near $1.204 acting as immediate overhead resistance, while momentum remains weak: the RSI at 28 sits in oversold territory, and the MACD histogram is negative, hinting that sellers still control the near-term tone despite stretched conditions.
On the topside, initial resistance appears at the channel boundary around $1.204, followed closely by the 50-day EMA at $1.224; a sustained break above these would be needed to ease selling pressure and open the way toward the horizontal cap at $1.300 and the 100-day EMA at $1.327. Higher up, the 200-day EMA at $1.535 and the broader resistance line at $1.900 define a major ceiling for any medium-term recovery.
On the downside, immediate support is located at the psychological $1.000 level, where buyers may attempt to stabilize the price after the recent slide.
(The technical analysis of this story was written with the help of an AI tool.)
Cryptocurrency prices FAQs
Token launches influence demand and adoption among market participants. Listings on crypto exchanges deepen the liquidity for an asset and add new participants to an asset’s network. This is typically bullish for a digital asset.
A hack is an event in which an attacker captures a large volume of the asset from a DeFi bridge or hot wallet of an exchange or any other crypto platform via exploits, bugs or other methods. The exploiter then transfers these tokens out of the exchange platforms to ultimately sell or swap the assets for other cryptocurrencies or stablecoins. Such events often involve an en masse panic triggering a sell-off in the affected assets.
Macroeconomic events like the US Federal Reserve’s decision on interest rates influence crypto assets mainly through the direct impact they have on the US Dollar. An increase in interest rate typically negatively influences Bitcoin and altcoin prices, and vice versa. If the US Dollar index declines, risk assets and associated leverage for trading gets cheaper, in turn driving crypto prices higher.
Halvings are typically considered bullish events as they slash the block reward in half for miners, constricting the supply of the asset. At consistent demand if the supply reduces, the asset’s price climbs.

超过一百万用户依赖 FXStreet 获取实时市场数据、图表工具、专家洞见和外汇新闻。其全面的经济日历和教育网络研讨会帮助交易者保持信息领先、做出审慎决策。FXStreet 拥有约 60 人的团队,分布在巴塞罗那总部及全球各地区。
阅读更多


