
Top Crypto Gainers: Stable, MemeCore and Nexo rally test critical resistance levels
作者 Vishal Dixit
发布日期: 17 Feb 2026 | 修改日期: 17 Feb 2026


热门文章

Stable (STABLE), MemeCore (M), and Nexo (NEXO) are among the leading gainers in the crypto market over the last 24 hours, while Bitcoin (BTC) remains below $70,000, suggesting renewed interest in altcoins among investors.
- Stable approaches a crucial resistance on Tuesday following a 16% jump the previous day.
- MemeCore is up 7% so far on Tuesday, extending a rebound within a consolidation range.
- Nexo rests above the 50-day EMA at $0.886 after a 7% rise on Monday, struggling to pass a key resistance trendline.
Stable (STABLE), MemeCore (M), and Nexo (NEXO) are among the leading gainers in the crypto market over the last 24 hours, while Bitcoin (BTC) remains below $70,000, suggesting renewed interest in altcoins among investors. Technically, STABLE and NEXO are approaching a key resistance level, while MemeCore shows upside within a consolidation range.
Stable recovery approaches key resistance
Stable extends the broadly V-shaped recovery over the last 10 days, crossing above the $0.030 mark. At the time of writing, STABLE is up 3% on Tuesday, building on the 16% gains from the previous day.
The immediate resistance for STABLE lies at the R1 pivot point at $0.03219. A decisive close above this level could extend the rally to the R2 pivot point at $0.04185.
Technical indicators on the daily chart maintain an upward bias. The Relative Strength Index (RSI) is at 67, approaching the oversold zone as buying pressure increases. Meanwhile, the Moving Average Convergence Divergence (MACD) extends the upward trend following a bullish crossover on Sunday, indicating rising bullish momentum.
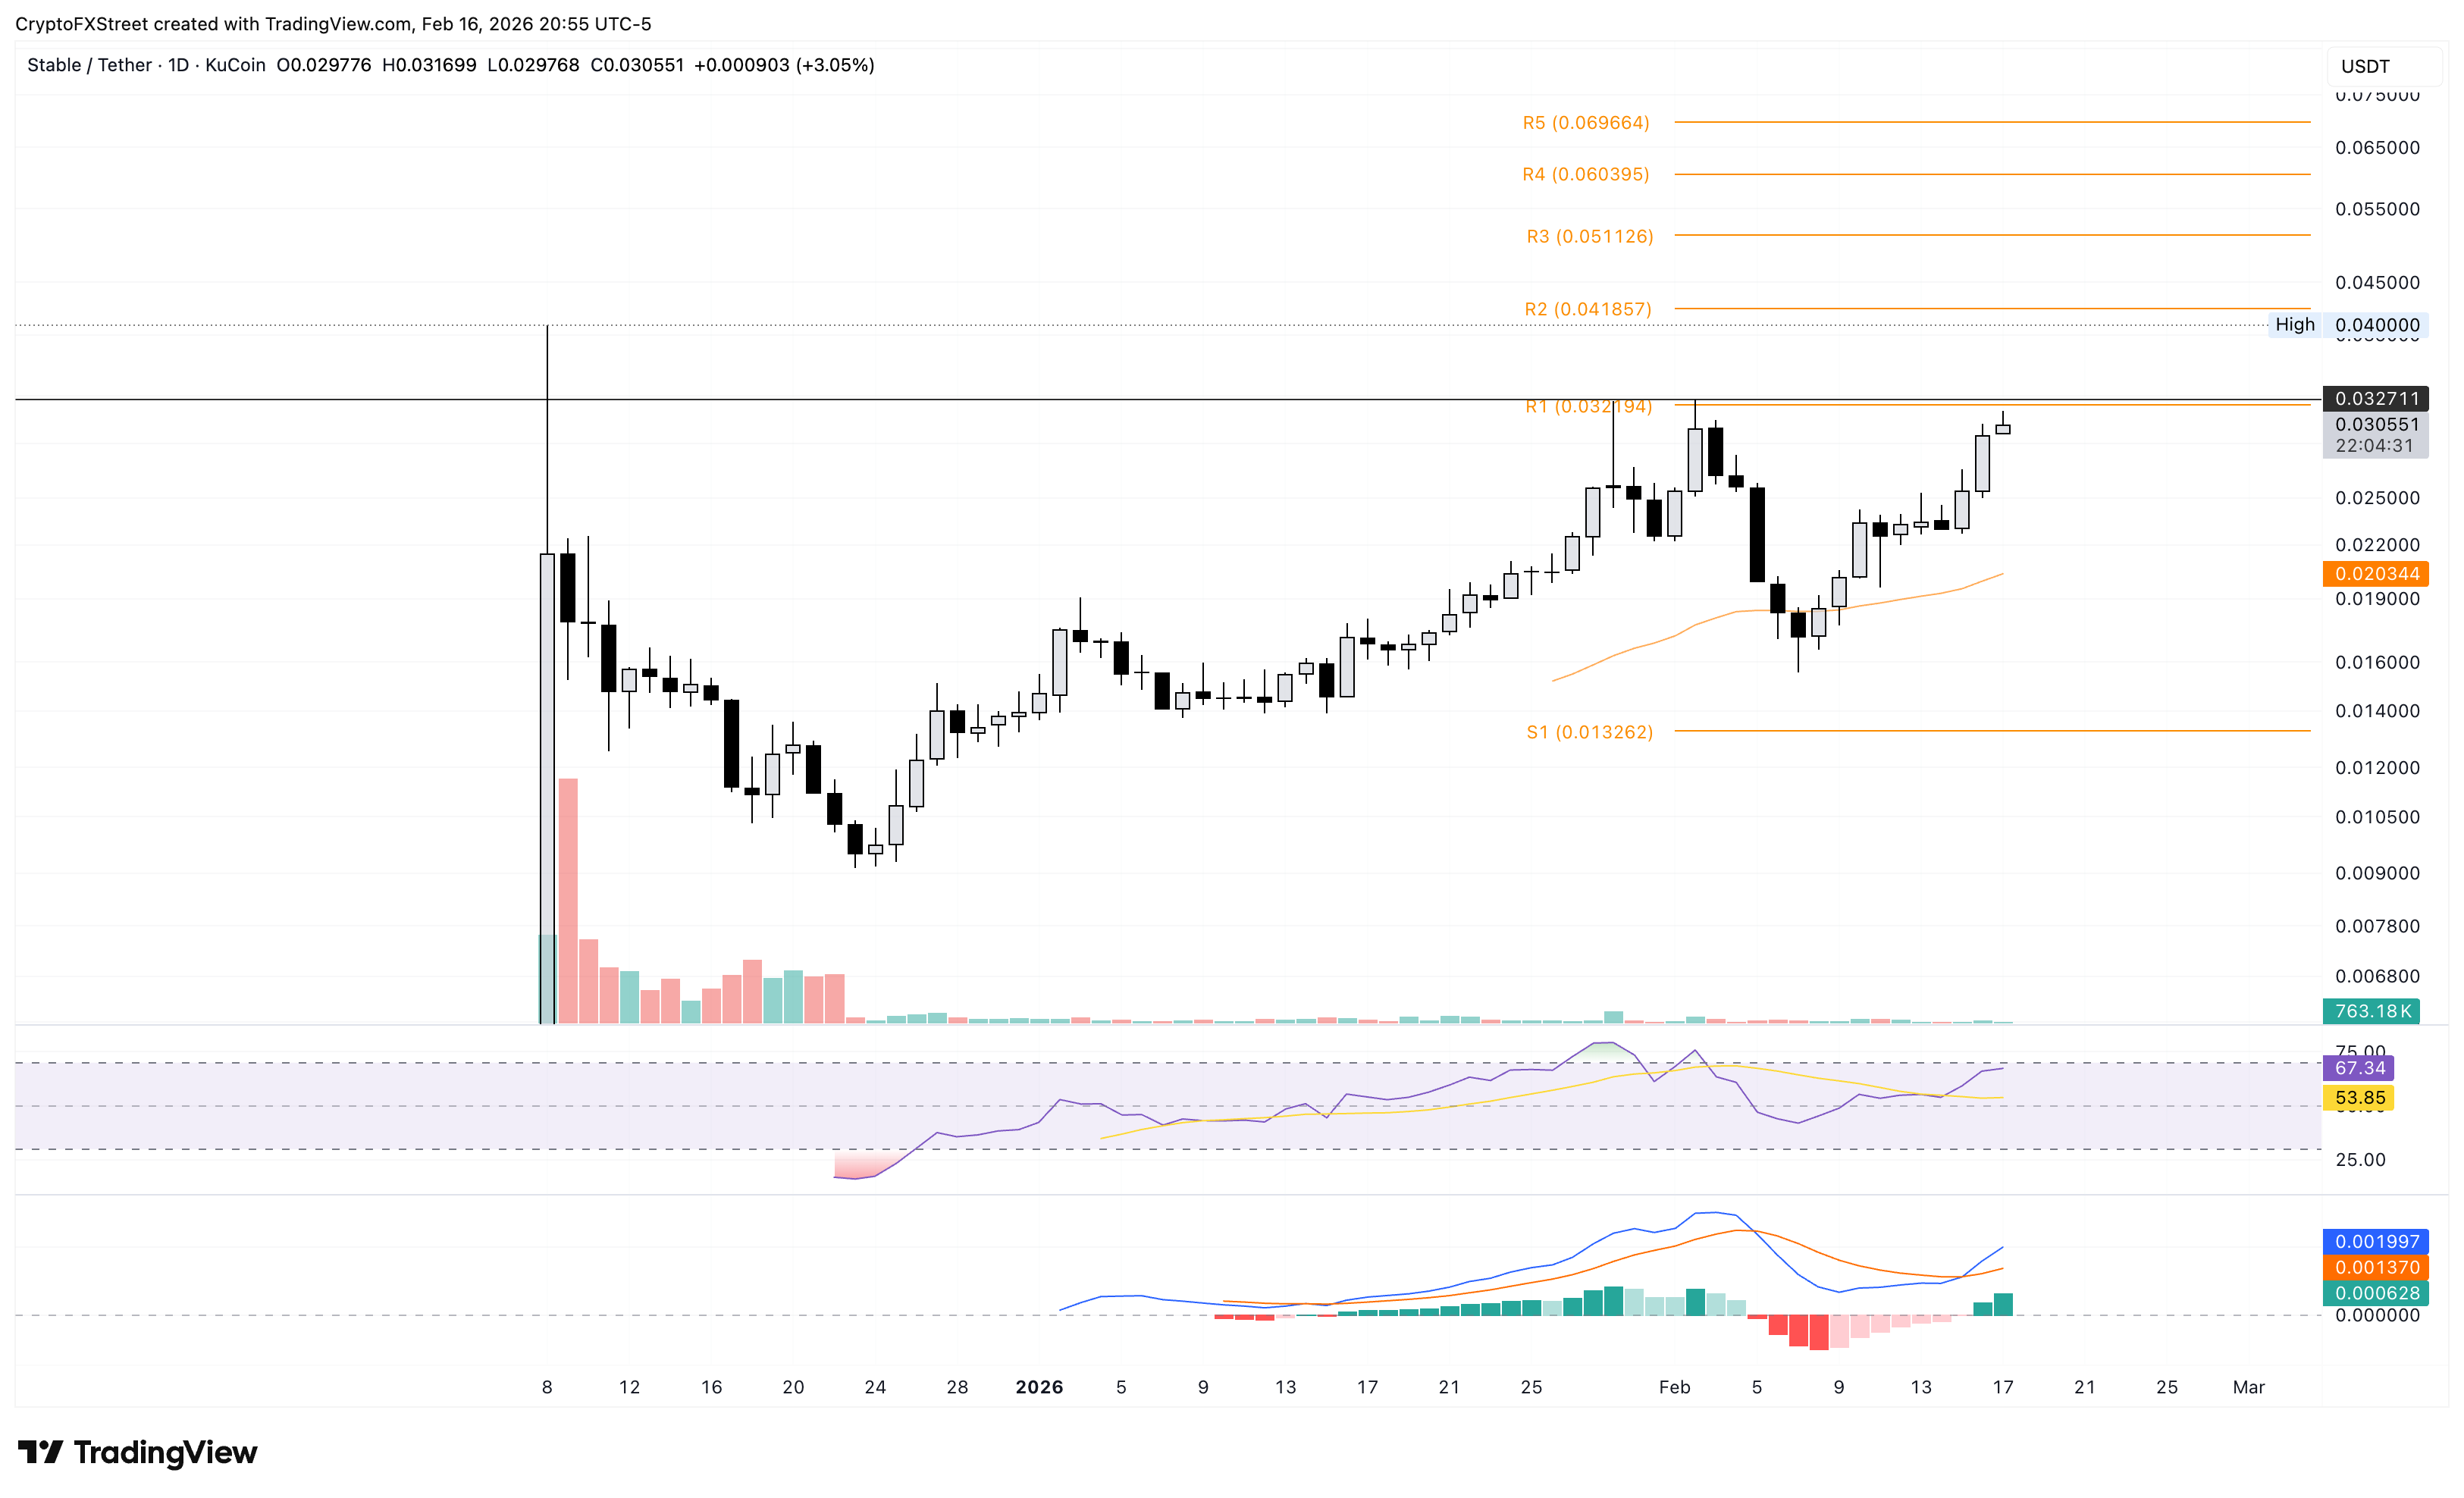
On the flip side, a reversal in STABLE could result in a pullback toward the $0.02000 psychological support.
MemeCore rebound gains momentum
MemeCore edges higher by 7% at the time of writing on Tuesday, extending the rebound from the $1.20-$1.25 support zone. The intraday recovery indicates a potential upside cycle within the consolidation range, with the upper ceiling near $1.70.
A decisive close above the 50-day Exponential Moving Average (EMA) at $1.5169 could extend the recovery to $1.70, followed by a higher resistance at the R2 pivot point at $1.95.
The technical indicators on the daily chart suggest a renewed buying pressure in the meme coin. The RSI at 47 approaches the midline with an upward slope, indicating declining selling pressure. At the same time, the MACD approaches the signal line for a potential bullish crossover as the negative histograms contract.
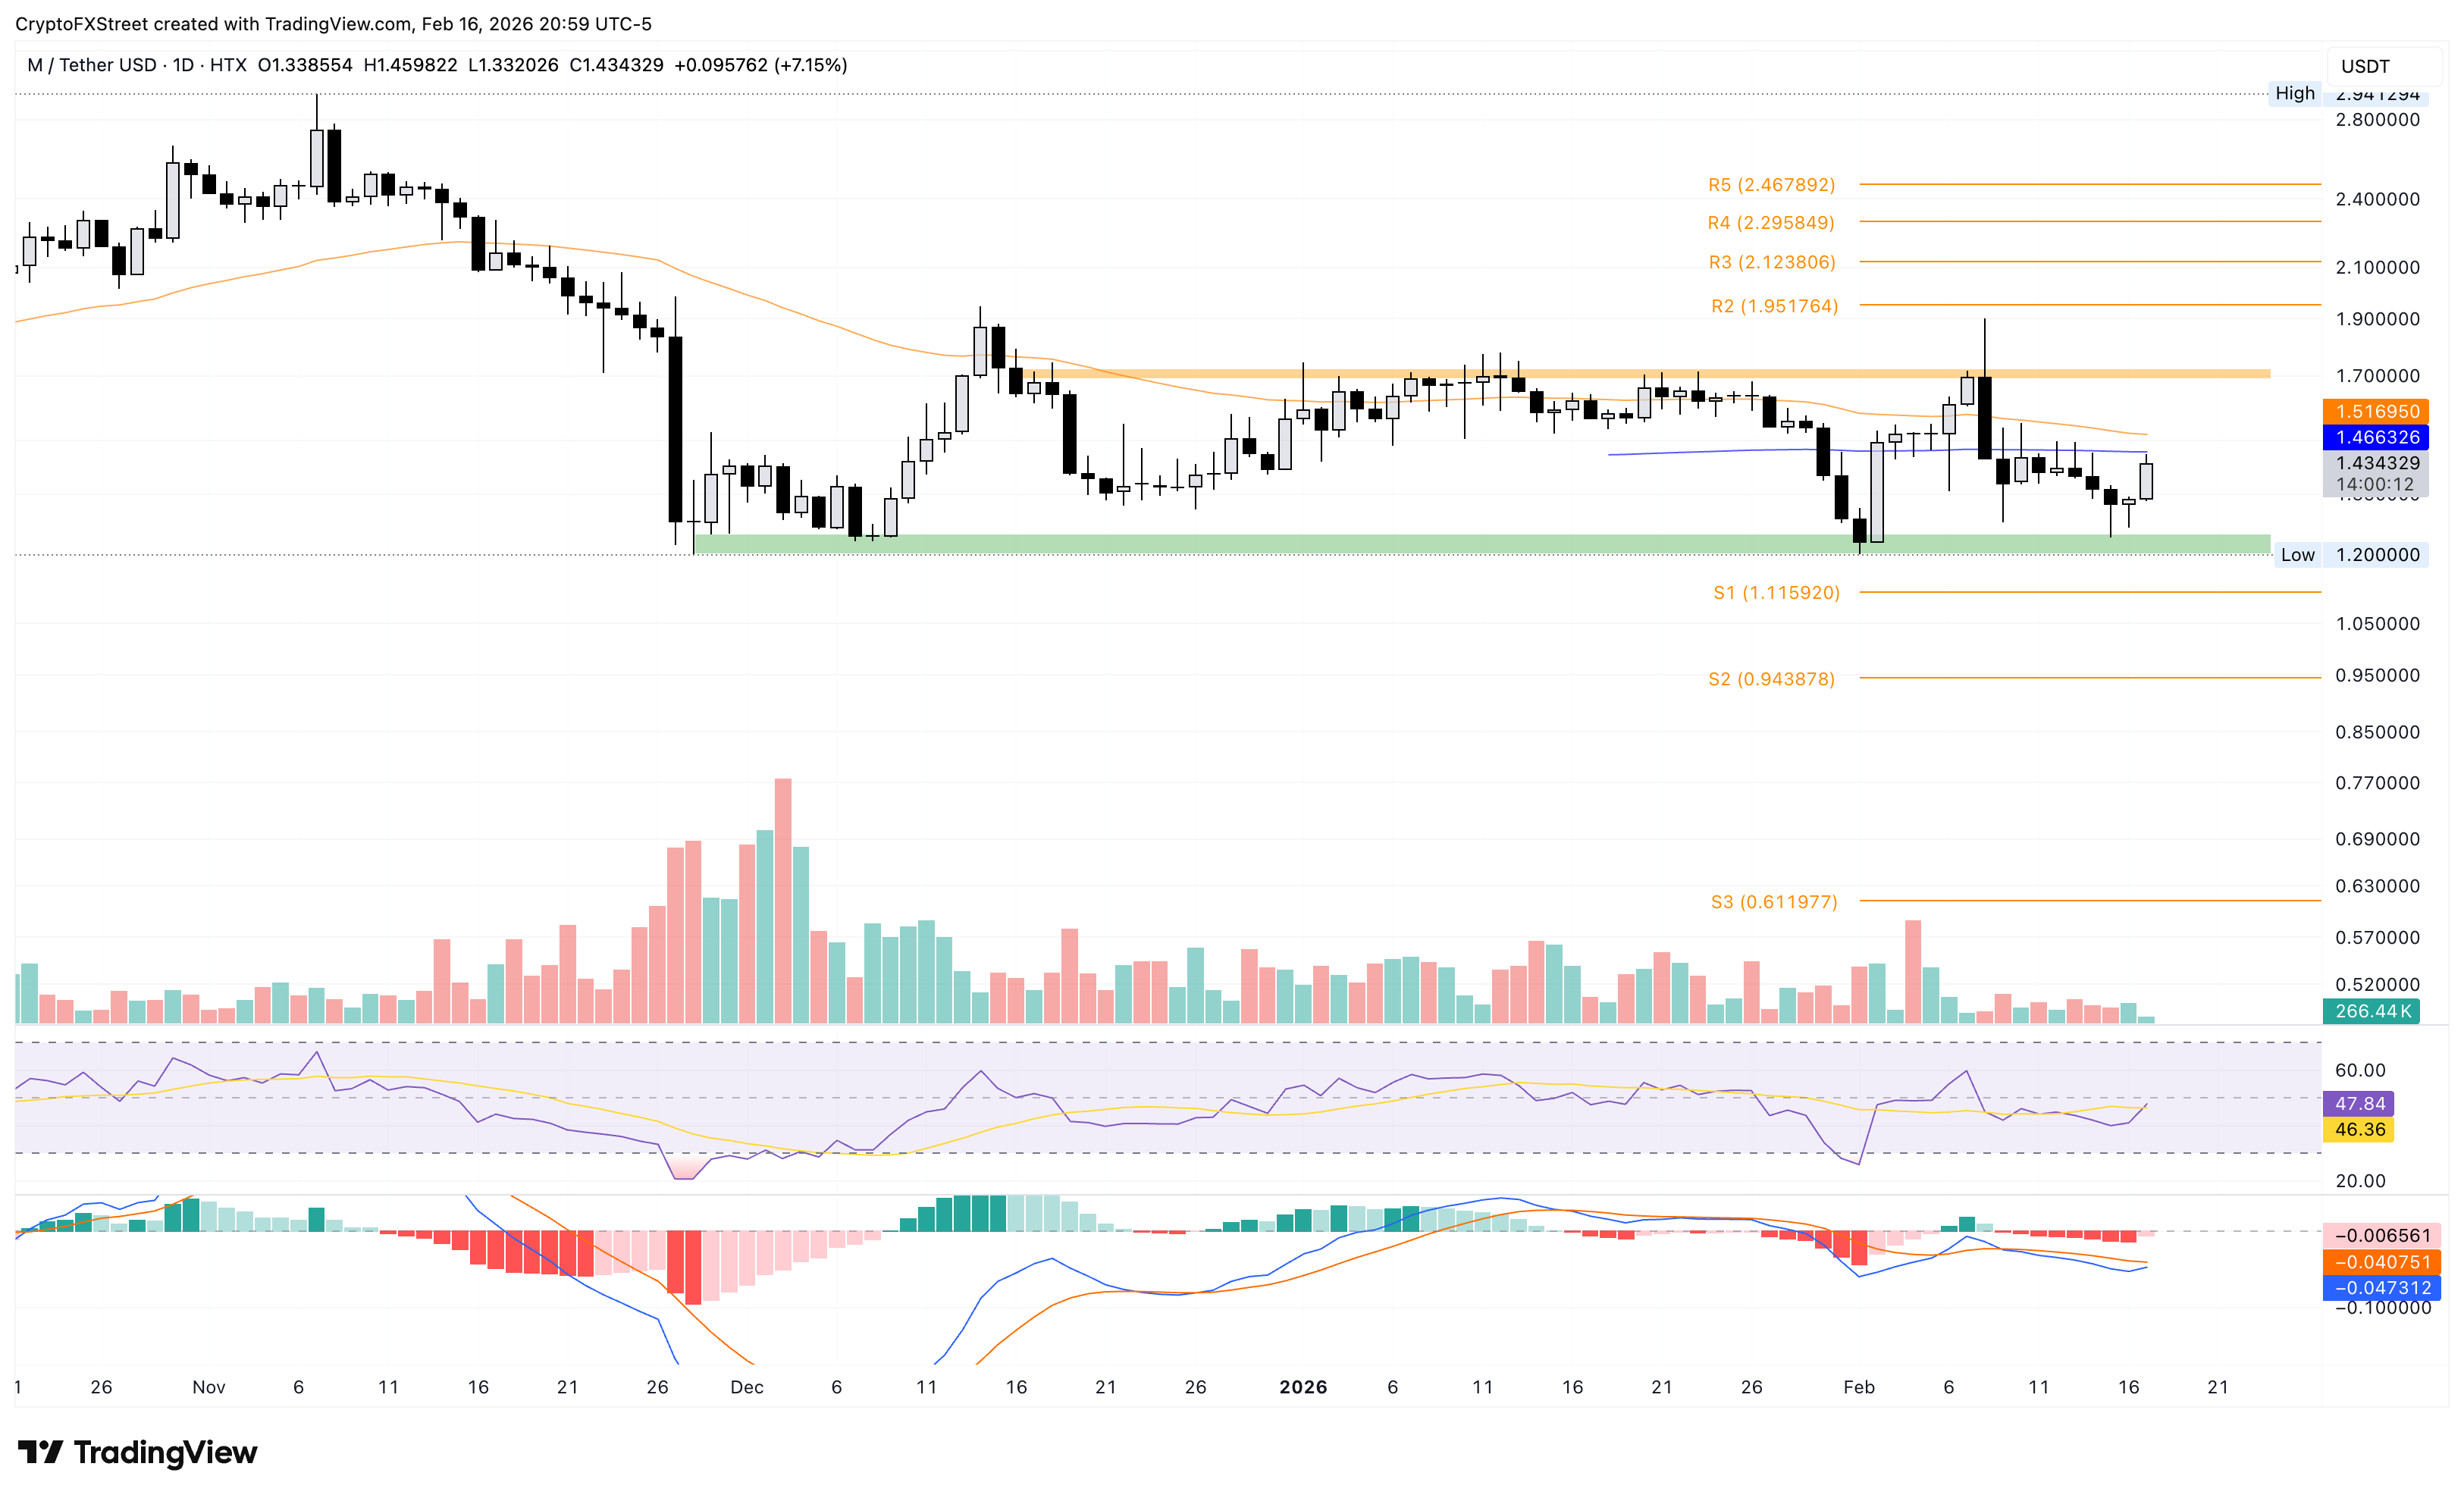
However, closing below $1.20 would nullify the rebound chances and would open the door to the S1 Pivot Point at $1.15 and the $1.00 psychological mark.
Nexo remains under pressure above the 50-day EMA
Nexo is resting above the 50-day EMA at $0.886 at the time of writing on Tuesday after a 7% jump on the previous day. The crypto faces overhead resistance from a declining trendline connecting the October 8th and January 16th highs on the daily chart at $0.93.
A decisive close above this level could extend the recovery to the 200-day EMA at $1.030.
The RSI at 54 edges above the midline, suggesting a mild buy-side bias. Meanwhile, the MACD and signal line remain upward trending, with positive histograms widening above the zero line. This reflects a steady increase in bullish momentum consistent with the broader V-shaped recovery over the last two weeks.
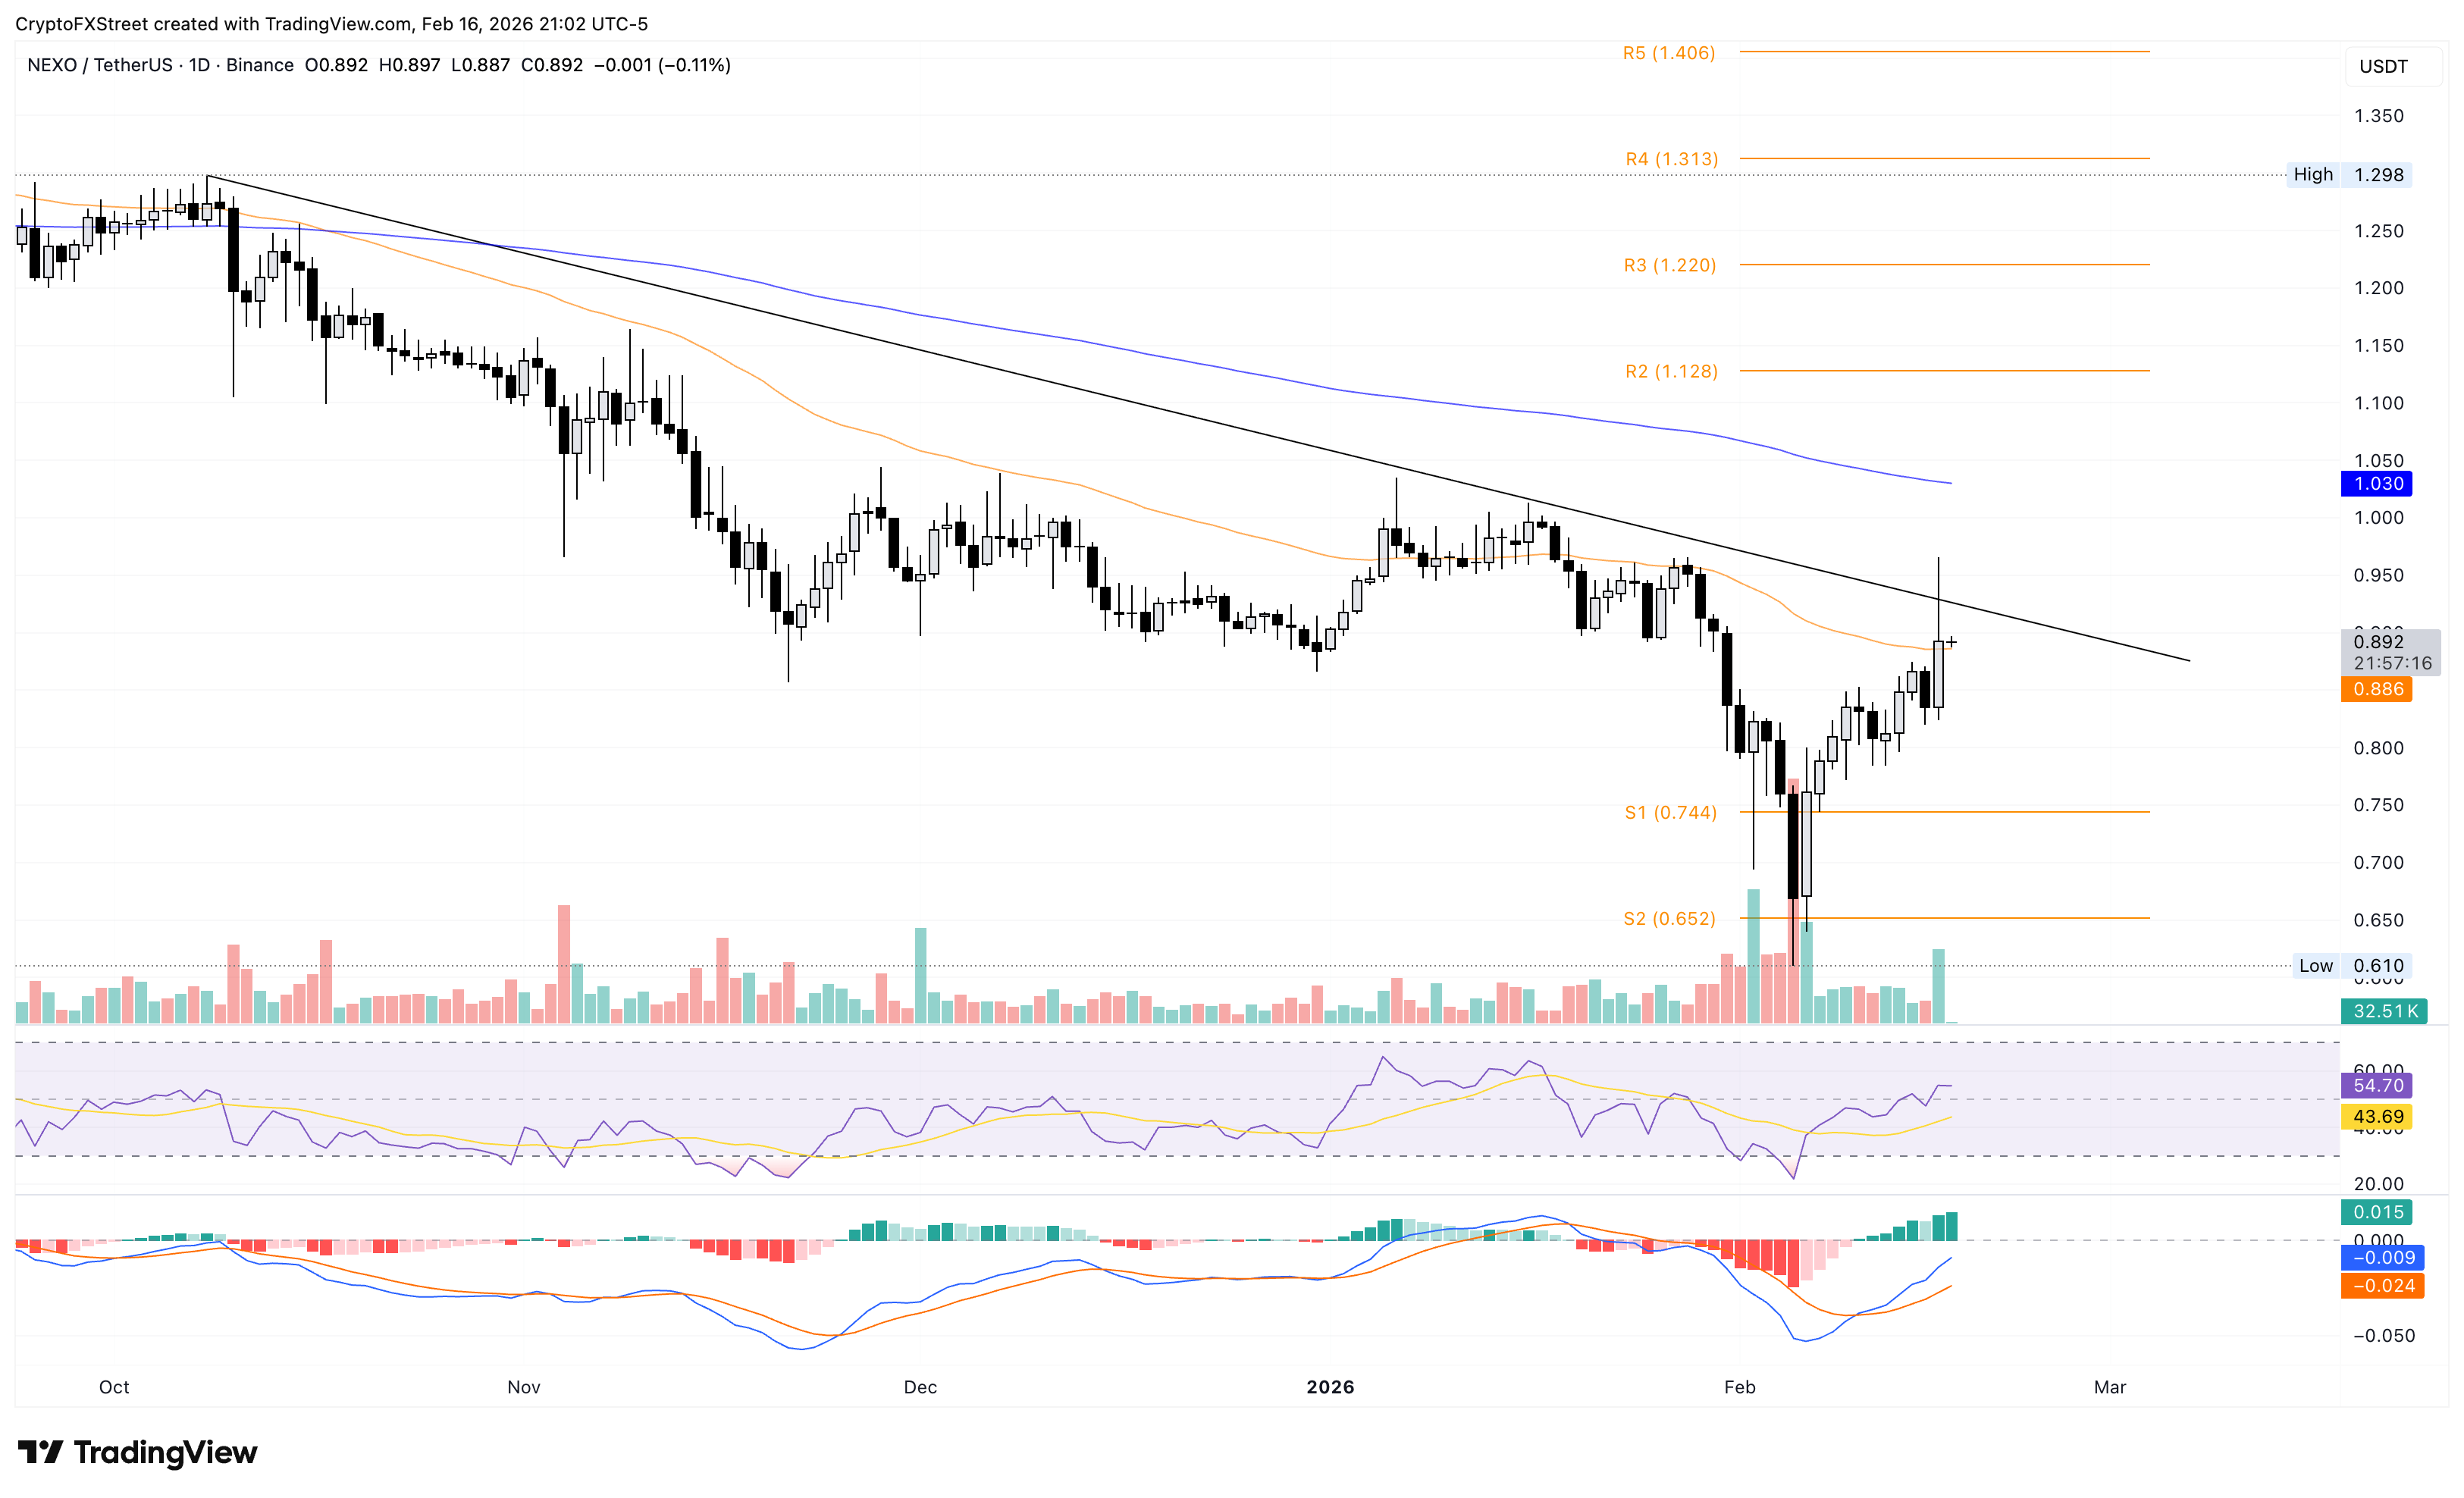
However, a bearish close below $0.886 could result in a deeper correction to the S1 pivot point at $0.744.

超过一百万用户依赖 FXStreet 获取实时市场数据、图表工具、专家洞见和外汇新闻。其全面的经济日历和教育网络研讨会帮助交易者保持信息领先、做出审慎决策。FXStreet 拥有约 60 人的团队,分布在巴塞罗那总部及全球各地区。
阅读更多


