

US Dollar Index Price Forecast: Waning hawkish Fed bets back more downside
- The USD Index is under pressure near 100.48 as traders dial down hawkish Fed bets.
- Both the US retail and wholesale inflation cooled down in June.
- Middle East hostilities could limit the downside in the US Dollar.
The US Dollar (USD) remains under pressure as traders have repriced the Federal Reserve’s (Fed) interest rate hike expectations. At press time, the US Dollar Index (DXY), which gauges the Greenback’s value against six major currencies, holds onto Wednesday’s losses near 100.48.
US Dollar Price This week
The table below shows the percentage change of US Dollar (USD) against listed major currencies this week. US Dollar was the weakest against the New Zealand Dollar.
| USD | EUR | GBP | JPY | CAD | AUD | NZD | CHF | |
|---|---|---|---|---|---|---|---|---|
| USD | -0.59% | -1.09% | 0.15% | -0.82% | -0.77% | -1.61% | -0.25% | |
| EUR | 0.59% | -0.51% | 0.76% | -0.23% | -0.23% | -1.03% | 0.35% | |
| GBP | 1.09% | 0.51% | 1.23% | 0.28% | 0.29% | -0.52% | 0.90% | |
| JPY | -0.15% | -0.76% | -1.23% | -1.06% | -0.93% | -1.81% | -0.46% | |
| CAD | 0.82% | 0.23% | -0.28% | 1.06% | 0.13% | -0.76% | 0.61% | |
| AUD | 0.77% | 0.23% | -0.29% | 0.93% | -0.13% | -0.81% | 0.48% | |
| NZD | 1.61% | 1.03% | 0.52% | 1.81% | 0.76% | 0.81% | 1.43% | |
| CHF | 0.25% | -0.35% | -0.90% | 0.46% | -0.61% | -0.48% | -1.43% |
The heat map shows percentage changes of major currencies against each other. The base currency is picked from the left column, while the quote currency is picked from the top row. For example, if you pick the US Dollar from the left column and move along the horizontal line to the Japanese Yen, the percentage change displayed in the box will represent USD (base)/JPY (quote).
The CME FedWatch tool shows that the odds of the Fed delivering an interest rate hike in the meeting later this month have dropped significantly to 10.2% from 31% recorded a week ago.
Market participants have scaled back hawkish Fed bets as the United States (US) Consumer Price Index (CPI) and the Producer Price Index (PPI) reports for June have shown that inflationary pressures have cooled down.
Meanwhile, investors await speeches from Fed officials regarding how the central bank will conduct monetary policy going forward amid signs of slowing price growth.
Going forward, investors will focus on the US Retail Sales data for June, which will be published at 12:30 GMT.
On the geopolitical front, elevated energy prices due to renewed Middle East hostilities could limit the downside in the US Dollar.
US Dollar Index technical analysis
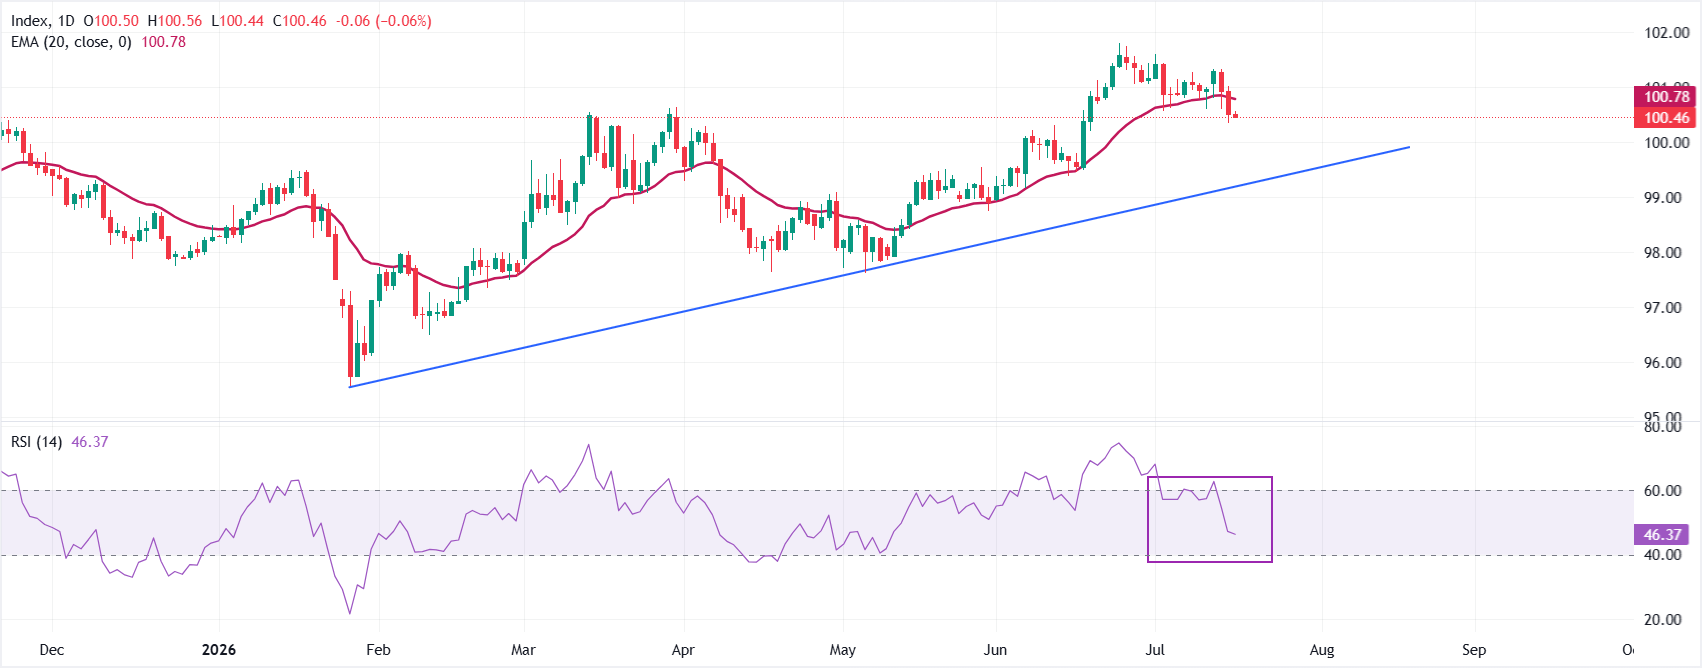
The Dollar Index Spot trades lower at around 100.46, staying under the 20-day Exponential Moving Average (EMA) at 100.78, which now acts as immediate overhead resistance and hints at a near-term bearish bias.
The Relative Strength Index (RSI) at 46.37 is drifting below the neutral 50 line, suggesting fading bullish momentum rather than outright oversold conditions as the index consolidates below the short-term trend gauge.
On the topside, initial resistance is located at the 20-day EMA near 100.78, and a sustained break above this barrier would be needed for further upside towards the June 24 high at 101.80. On the downside, the first meaningful support sits at the psychological level of 100.00, followed by the broken-but-still-relevant rising trend-line area around 99.19.
(The technical analysis of this story was written with the help of an AI tool. Know more.)
Fed FAQs
Monetary policy in the US is shaped by the Federal Reserve (Fed). The Fed has two mandates: to achieve price stability and foster full employment. Its primary tool to achieve these goals is by adjusting interest rates. When prices are rising too quickly and inflation is above the Fed’s 2% target, it raises interest rates, increasing borrowing costs throughout the economy. This results in a stronger US Dollar (USD) as it makes the US a more attractive place for international investors to park their money. When inflation falls below 2% or the Unemployment Rate is too high, the Fed may lower interest rates to encourage borrowing, which weighs on the Greenback.
The Federal Reserve (Fed) holds eight policy meetings a year, where the Federal Open Market Committee (FOMC) assesses economic conditions and makes monetary policy decisions. The FOMC is attended by twelve Fed officials – the seven members of the Board of Governors, the president of the Federal Reserve Bank of New York, and four of the remaining eleven regional Reserve Bank presidents, who serve one-year terms on a rotating basis.
In extreme situations, the Federal Reserve may resort to a policy named Quantitative Easing (QE). QE is the process by which the Fed substantially increases the flow of credit in a stuck financial system. It is a non-standard policy measure used during crises or when inflation is extremely low. It was the Fed’s weapon of choice during the Great Financial Crisis in 2008. It involves the Fed printing more Dollars and using them to buy high grade bonds from financial institutions. QE usually weakens the US Dollar.
Quantitative tightening (QT) is the reverse process of QE, whereby the Federal Reserve stops buying bonds from financial institutions and does not reinvest the principal from the bonds it holds maturing, to purchase new bonds. It is usually positive for the value of the US Dollar.














