
USD/CAD Price Forecast: Holds onto Friday’s gains near 1.3800
作者 Sagar Dua
发布日期: 22 Dec 2025 | 修改日期: 22 Dec 2025


热门文章

The USD/CAD pair trades firmly near Friday’s high around 1.3800 during the early European trading session on Monday. The Loonie pair demonstrates strength as the Canadian Dollar (CAD) underperforms amid growing household spending concerns.
- USD/CAD demonstrates strength near 1.3800 amid weakness in the Canadian Dollar.
- Canadian Retail Sales declined unexpectedly by 0.2% in October.
- Investors await the preliminary US Q3 GDP data.
The USD/CAD pair trades firmly near Friday’s high around 1.3800 during the early European trading session on Monday. The Loonie pair demonstrates strength as the Canadian Dollar (CAD) underperforms amid growing household spending concerns.
On Friday, Statistics Canada reported that Retail Sales, a key measure of consumer spending, declined 0.2% on a month in October, while they were expected to remain flat. In September, the consumer spending measure also declined by 0.9%.
Falling household demand could underpin the need for more interest rate cuts by the Bank of Canada (BoC) in the near term.
Meanwhile, the US Dollar (USD) trades slightly lower ahead of the flash United States (US) Q3 Gross Domestic Product (GDP) data, which will be released on Tuesday. The US economy is expected to have grown at a moderate pace of 3.2%.
USD/CAD technical analysis
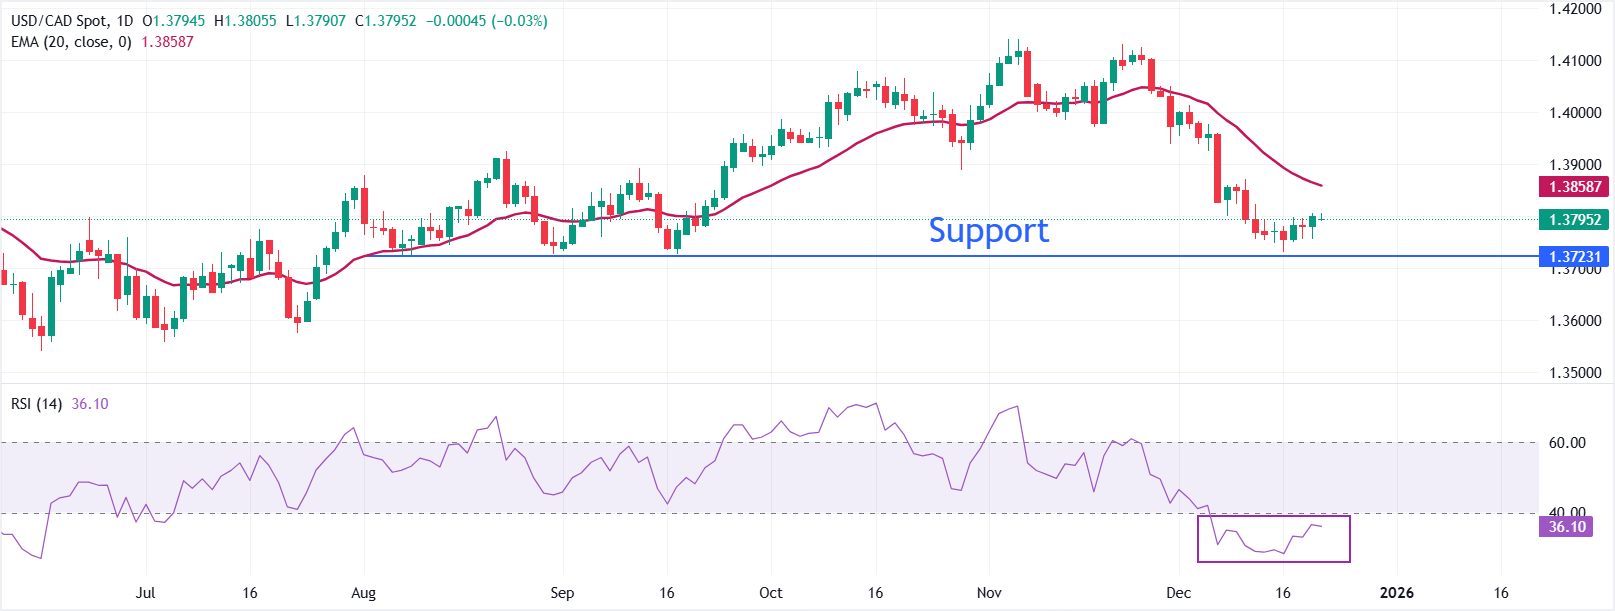
USD/CAD clings to gains near 1.3800 on Monday. The pair holds beneath a descending 20-day Exponential Moving Average (EMA), keeping the short-term bias tilted lower as bounces remain contained by the average. The EMA’s steady downturn underscores persistent supply on upticks. The 14-day Relative Strength Index (RSI) sits at 36, near oversold after a modest bounce from last week’s extremes, while momentum remains fragile.
A sustained recovery would require a daily close above the 20-day EMA to ease downside pressure that could increase the odds of an upside move towards the round-level figure of 1.3900. Until then, the downbeat setup persists and could strengthen if the spot breaks below the August 7 low of 1.3720.
(The technical analysis of this story was written with the help of an AI tool.)
Economic Indicator
Gross Domestic Product Annualized
The real Gross Domestic Product (GDP) Annualized, released quarterly by the US Bureau of Economic Analysis, measures the value of the final goods and services produced in the United States in a given period of time. Changes in GDP are the most popular indicator of the nation’s overall economic health. The data is expressed at an annualized rate, which means that the rate has been adjusted to reflect the amount GDP would have changed over a year’s time, had it continued to grow at that specific rate. Generally speaking, a high reading is seen as bullish for the US Dollar (USD), while a low reading is seen as bearish.
Read more.Next release: Tue Dec 23, 2025 13:30 (Prel)
Frequency: Quarterly
Consensus: 3.2%
Previous: 3.8%
Source: US Bureau of Economic Analysis
The US Bureau of Economic Analysis (BEA) releases the Gross Domestic Product (GDP) growth on an annualized basis for each quarter. After publishing the first estimate, the BEA revises the data two more times, with the third release representing the final reading. Usually, the first estimate is the main market mover and a positive surprise is seen as a USD-positive development while a disappointing print is likely to weigh on the greenback. Market participants usually dismiss the second and third releases as they are generally not significant enough to meaningfully alter the growth picture.

超过一百万用户依赖 FXStreet 获取实时市场数据、图表工具、专家洞见和外汇新闻。其全面的经济日历和教育网络研讨会帮助交易者保持信息领先、做出审慎决策。FXStreet 拥有约 60 人的团队,分布在巴塞罗那总部及全球各地区。
阅读更多


