
USD/CAD Price Forecast: Hovers around nine-day EMA above 1.3650
作者 Akhtar Faruqui
发布日期: 3 Feb 2026 | 修改日期: 3 Feb 2026


热门文章

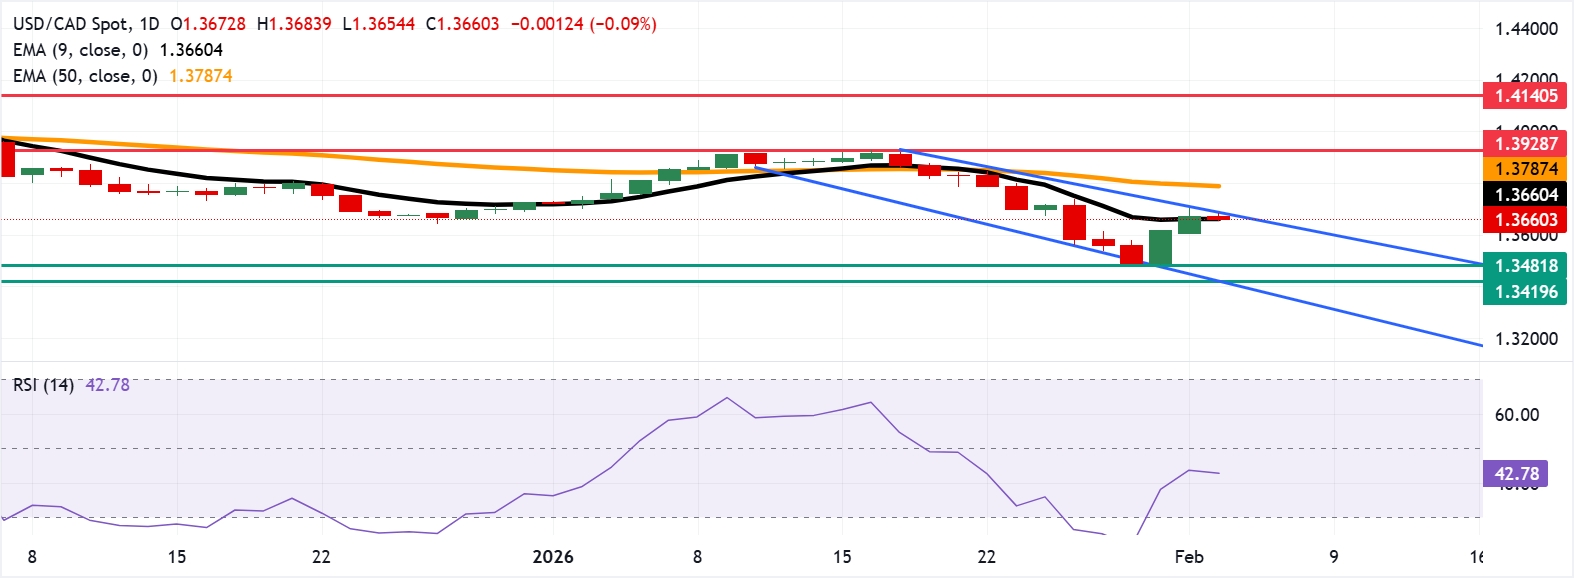
USD/CAD depreciates after two days of gains, trading around 1.3660 during the early European hours on Tuesday. The technical analysis of the daily chart shows the pair remains close to the upper boundary of the descending channel, suggesting a potential for bullish reversal.
- USD/CAD may decline toward initial support at 1.3481, its lowest level since October 2024.
- The nine-day Exponential Moving Average is flat and aligned with the spot, signaling consolidation.
- Primary resistance stands at the nine-day EMA near 1.3660, aligned with the ascending channel’s upper boundary.
USD/CAD depreciates after two days of gains, trading around 1.3660 during the early European hours on Tuesday. The technical analysis of the daily chart shows the pair remains close to the upper boundary of the descending channel, suggesting a potential for bullish reversal.
The USD/CAD pair holds below the 50-day Exponential Moving Average (EMA), maintaining a bearish medium-term bias. The nine-day EMA is flat and convergent with the spot price, pointing to consolidation. Until price reclaims the medium-term average, rallies could fade ahead of resistance.
The 14-day Relative Strength Index (RSI) at 43 (neutral-bearish) remains under 50, confirming subdued momentum.
The USD/CAD pair may fall toward the initial support at 1.3481, the lowest since October 2024, recorded on January 30, followed by the confluence around the lower descending channel boundary at 1.3450 and 1.3419, the lowest since February 2024.
On the upside, the primary resistance lies at the nine-day EMA of 1.3660, aligned with the upper boundary of the ascending channel around 1.3700. A daily close above the confluence would open recovery scope and support the USD/CAD pair to approach the 50-day EMA at 1.3787. Further advances would expose the nine-week high of 1.3928, reached on January 16.
(The technical analysis of this story was written with the help of an AI tool.)
Canadian Dollar Price Today
The table below shows the percentage change of Canadian Dollar (CAD) against listed major currencies today. Canadian Dollar was the strongest against the US Dollar.
| USD | EUR | GBP | JPY | CAD | AUD | NZD | CHF | |
|---|---|---|---|---|---|---|---|---|
| USD | -0.21% | -0.14% | -0.06% | -0.08% | -0.97% | -0.63% | -0.24% | |
| EUR | 0.21% | 0.08% | 0.15% | 0.12% | -0.77% | -0.42% | -0.03% | |
| GBP | 0.14% | -0.08% | 0.09% | 0.05% | -0.84% | -0.49% | -0.10% | |
| JPY | 0.06% | -0.15% | -0.09% | -0.01% | -0.90% | -0.56% | -0.17% | |
| CAD | 0.08% | -0.12% | -0.05% | 0.01% | -0.89% | -0.55% | -0.15% | |
| AUD | 0.97% | 0.77% | 0.84% | 0.90% | 0.89% | 0.35% | 0.74% | |
| NZD | 0.63% | 0.42% | 0.49% | 0.56% | 0.55% | -0.35% | 0.39% | |
| CHF | 0.24% | 0.03% | 0.10% | 0.17% | 0.15% | -0.74% | -0.39% |
The heat map shows percentage changes of major currencies against each other. The base currency is picked from the left column, while the quote currency is picked from the top row. For example, if you pick the Canadian Dollar from the left column and move along the horizontal line to the US Dollar, the percentage change displayed in the box will represent CAD (base)/USD (quote).

超过一百万用户依赖 FXStreet 获取实时市场数据、图表工具、专家洞见和外汇新闻。其全面的经济日历和教育网络研讨会帮助交易者保持信息领先、做出审慎决策。FXStreet 拥有约 60 人的团队,分布在巴塞罗那总部及全球各地区。
阅读更多


