
USD/CHF Price Forecast: Dollar holds above 0.7800 with bullish momentum building up
作者 Guillermo Alcala
更新: 14 May 2026


热门文章

The US Dollar (USD) is trading flat, right above 0.7800 against the Swiss Franc on Thursday as investors bid their time awaiting the outcome of US President Trump’s visit to China.
- USD/CHF holds above 0.7800 after bouncing from 0.7760 lows.
- Investors are waiting for the outcome of the Trump-Xi meeting in Beijing.
- The technical picture shows a falling wedge formation, hinting at a bullish outcome.
The US Dollar (USD) is trading flat, right above 0.7800 against the Swiss Franc on Thursday as investors bid their time awaiting the outcome of US President Trump’s visit to China. The pair, however, shows a growing bullish momentum, as safe-haven flows amid the stalemate in Iran and higher US Treasury yields are underpinning speculative demand for the Greenback.
Trump affirmed that it has been a fantastic day, with positive and productive meetings, and that the topics discussed in a two-hour talk with Chinese President Xi Jinping are good for China and the US. Jinping said that ties between both countries are stable and that he had an in-depth exchange of views with Trump today.
On the macroeconomic front, the Swiss calendar is thin this week, but US inflation figures released earlier revealed that the impact of the energy shock has been stronger-than-expected in April. These releases have boosted expectations that the Federal Reserve (Fed) will be forced to hike rates in the second half of the year, which is pushing US Treasury yields and the US Dollar higher.
Technical Analysis: A falling wedge pattern hints at a bullish outcome
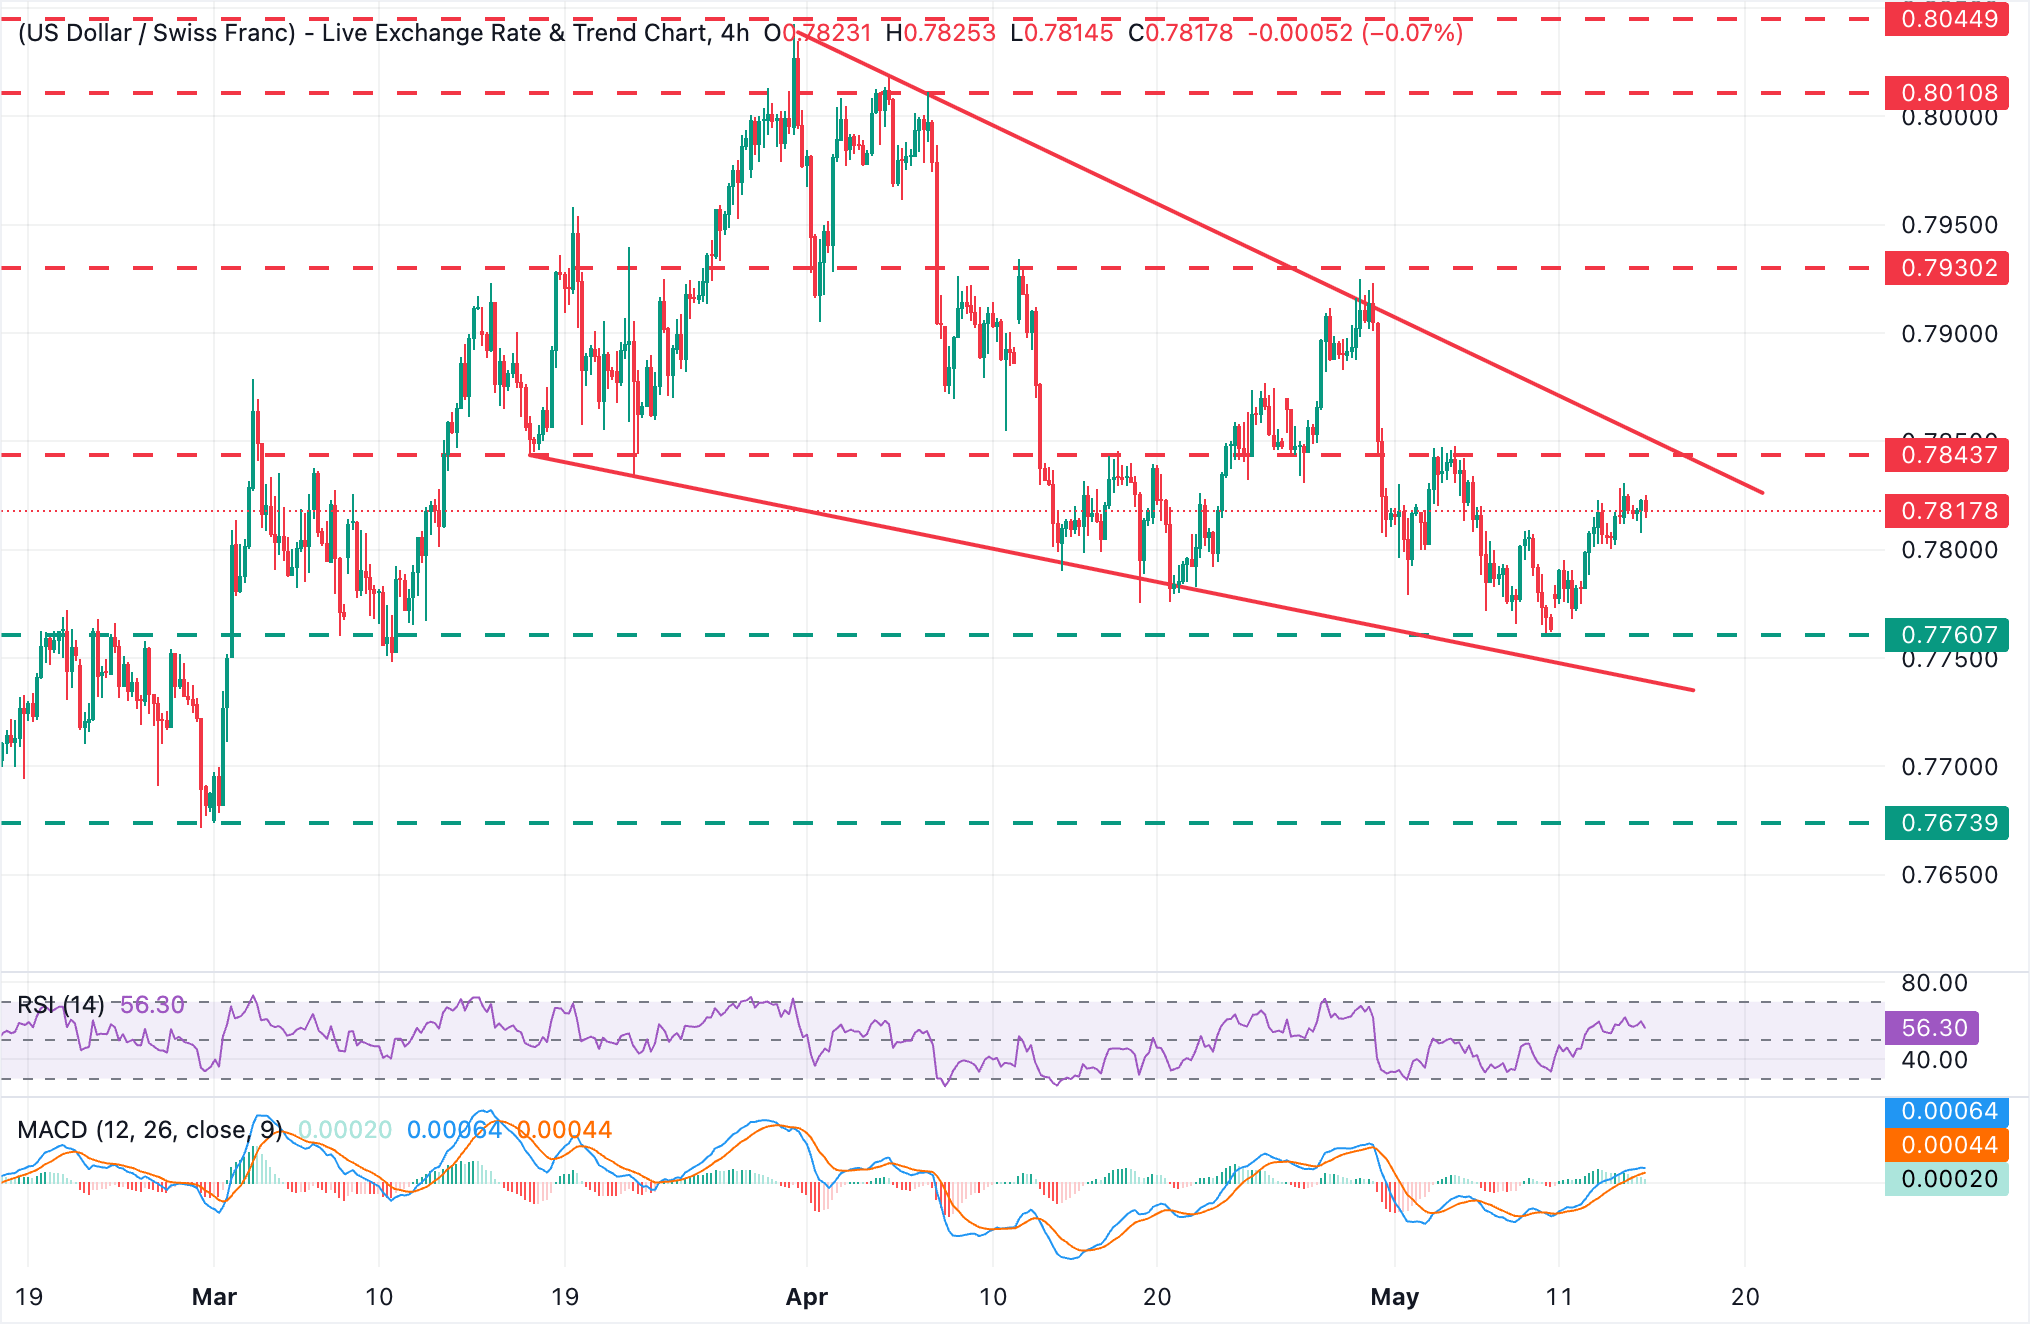
The 4-hour chart shows the USD/CHF pair trading within a falling wedge formation, a figure that often anticipates a bullish outcome. The bullish divergence in the RSI and the stronger momentum indicators are also pointing that way.
The Relative Strength Index (RSI) is hovering around 56, and the Moving Average Convergence Divergence (MACD) lines are slightly positive, although these indicators are showing a stabilizing downside pressure rather than a sustained upwards reversal.
Bulls should break above the confluence of the May 4 high and the top of the falling wedge, at the 0.7845 area, to confirm a bullish reversal, and shift focus towards April 12 and 30 highs, around 0.7930. On the downside, immediate support emerges at the May 8 low of 0.7760, and the bottom of the wedge, now around 0.7740, which are likely to test bears ahead of early March lows, near 0.7670.
(The technical analysis of this story was written with the help of an AI tool.)
US Dollar Price This week
The table below shows the percentage change of US Dollar (USD) against listed major currencies this week. US Dollar was the strongest against the Japanese Yen.
| USD | EUR | GBP | JPY | CAD | AUD | NZD | CHF | |
|---|---|---|---|---|---|---|---|---|
| USD | 0.37% | 0.33% | 0.82% | 0.28% | -0.27% | 0.10% | 0.50% | |
| EUR | -0.37% | -0.05% | 0.50% | -0.11% | -0.65% | -0.31% | 0.12% | |
| GBP | -0.33% | 0.05% | 0.04% | -0.05% | -0.62% | -0.25% | 0.17% | |
| JPY | -0.82% | -0.50% | -0.04% | -0.61% | -1.10% | -0.73% | -0.29% | |
| CAD | -0.28% | 0.11% | 0.05% | 0.61% | -0.44% | -0.11% | 0.22% | |
| AUD | 0.27% | 0.65% | 0.62% | 1.10% | 0.44% | 0.38% | 0.78% | |
| NZD | -0.10% | 0.31% | 0.25% | 0.73% | 0.11% | -0.38% | 0.40% | |
| CHF | -0.50% | -0.12% | -0.17% | 0.29% | -0.22% | -0.78% | -0.40% |
The heat map shows percentage changes of major currencies against each other. The base currency is picked from the left column, while the quote currency is picked from the top row. For example, if you pick the US Dollar from the left column and move along the horizontal line to the Japanese Yen, the percentage change displayed in the box will represent USD (base)/JPY (quote).

超过一百万用户依赖 FXStreet 获取实时市场数据、图表工具、专家洞见和外汇新闻。其全面的经济日历和教育网络研讨会帮助交易者保持信息领先、做出审慎决策。FXStreet 拥有约 60 人的团队,分布在巴塞罗那总部及全球各地区。
阅读更多


