
USD/CHF Price Forecast: Slides below 200-day SMA, bears gain steam
作者 Christian Borjon Valencia
更新: 8 Apr 2026


热门文章

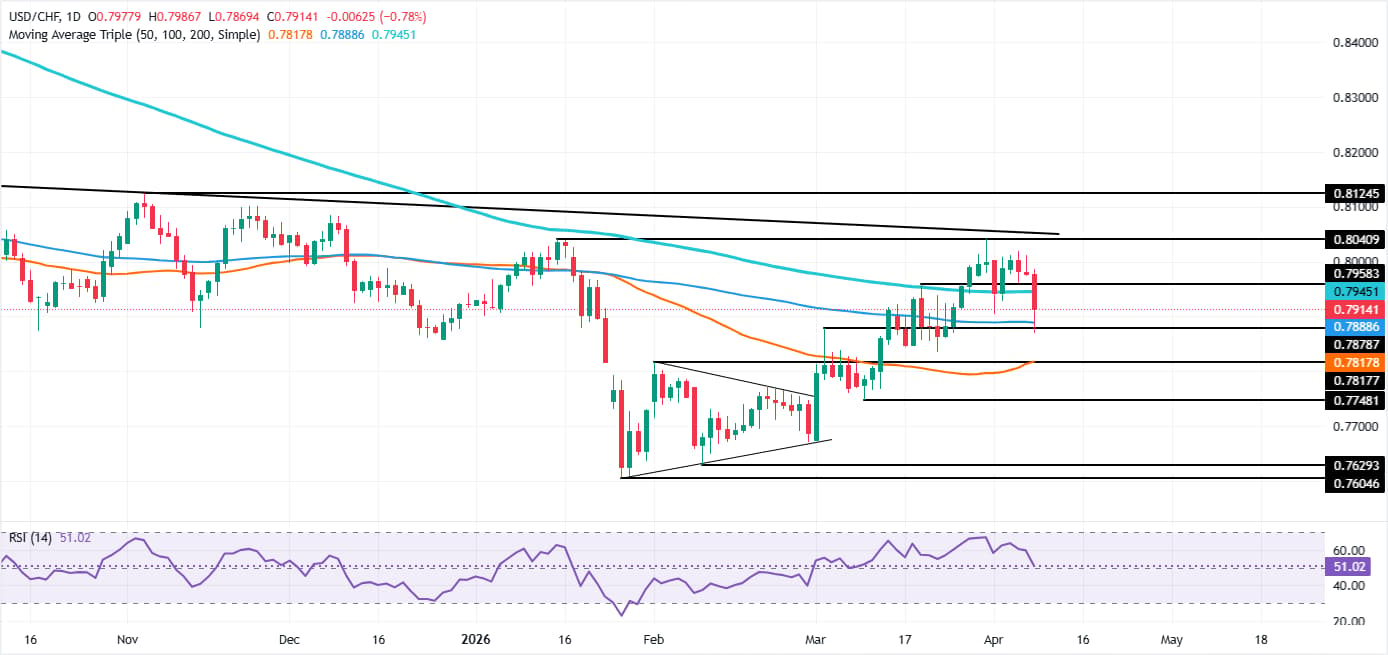
The USD/CHF retreats some 0.85% on Wednesday after failing to clear the April 7 daily high of 0.8010, and as the pair slides beneath the 200-day SMA of 0.7940, as market sentiment gets lifted by a two-week ceasefire in the Middle East conflict.
- USD/CHF drops below 200-day SMA as risk sentiment improves sharply.
- RSI turns lower, signaling growing bearish momentum in near term.
- Failure to reclaim 0.7940 exposes 0.7812 support and deeper downside.
The USD/CHF retreats some 0.85% on Wednesday after failing to clear the April 7 daily high of 0.8010, and as the pair slides beneath the 200-day SMA of 0.7940, as market sentiment gets lifted by a two-week ceasefire in the Middle East conflict. The pair trades at 0.7909 after reaching a high of 0.7980.
USD/CHF Price Forecast: Technical Outlook
Despite retreating, the USD/CHF remains upward-biased, bouncing off key support at the March 3 daily high, which turned into support at 0.7879, reclaiming the 100-day Simple Moving Average (SMA) at 0.7886, and climbing above 0.7900.
The Relative Strength Index (RSI) is above the neutral level but is plunging and poised to turn bearish, an indication that sellers are gaining momentum. Should price action follow suit the RSI, the USD/CHF could challenge the 50-day SMA at 0.7812 in the short term.
Otherwise, if USD/CHF climbs back above the 200-day SMA at 0.7940, a move back towards 0.8000 is on the cards..
USD/CHF Price Chart — Daily
Swiss Franc Price Today
The table below shows the percentage change of Swiss Franc (CHF) against listed major currencies today. Swiss Franc was the strongest against the US Dollar.
| USD | EUR | GBP | JPY | CAD | AUD | NZD | CHF | |
|---|---|---|---|---|---|---|---|---|
| USD | -0.63% | -0.83% | -0.63% | -0.27% | -0.98% | -1.52% | -0.80% | |
| EUR | 0.63% | -0.21% | 0.00% | 0.36% | -0.35% | -0.94% | -0.19% | |
| GBP | 0.83% | 0.21% | 0.21% | 0.58% | -0.11% | -0.68% | 0.03% | |
| JPY | 0.63% | 0.00% | -0.21% | 0.36% | -0.31% | -0.88% | -0.17% | |
| CAD | 0.27% | -0.36% | -0.58% | -0.36% | -0.68% | -1.24% | -0.54% | |
| AUD | 0.98% | 0.35% | 0.11% | 0.31% | 0.68% | -0.57% | 0.14% | |
| NZD | 1.52% | 0.94% | 0.68% | 0.88% | 1.24% | 0.57% | 0.72% | |
| CHF | 0.80% | 0.19% | -0.03% | 0.17% | 0.54% | -0.14% | -0.72% |
The heat map shows percentage changes of major currencies against each other. The base currency is picked from the left column, while the quote currency is picked from the top row. For example, if you pick the Swiss Franc from the left column and move along the horizontal line to the US Dollar, the percentage change displayed in the box will represent CHF (base)/USD (quote).

超过一百万用户依赖 FXStreet 获取实时市场数据、图表工具、专家洞见和外汇新闻。其全面的经济日历和教育网络研讨会帮助交易者保持信息领先、做出审慎决策。FXStreet 拥有约 60 人的团队,分布在巴塞罗那总部及全球各地区。
阅读更多


