
USD/JPY Price Forecast: Symmetrical Triangle breakdown below 159.00 warrants more downside
作者 Sagar Dua
更新: 8 Apr 2026


热门文章

The USD/JPY pair trades 0.9% lower to near 158.20 during the European trading session on Wednesday. The pair faces intense selling pressure as the US Dollar (USD) underperforms across the board, following the announcement of a two-week ceasefire between the United States (US) and Iran.
- USD/JPY plunges to near 158.20 as the US-Iran two-week ceasefire has diminished the US Dollar’s safe-haven demand.
- US President Trump suspends planned attacks on Iran as it agrees to the reopening of the Hormuz.
- Traders pare hawkish Fed bets as inflation expectations are anchored due to agreement on Hormuz reopening.
The USD/JPY pair trades 0.9% lower to near 158.20 during the European trading session on Wednesday. The pair faces intense selling pressure as the US Dollar (USD) underperforms across the board, following the announcement of a two-week ceasefire between the United States (US) and Iran.
US Dollar Price Today
The table below shows the percentage change of US Dollar (USD) against listed major currencies today. US Dollar was the weakest against the New Zealand Dollar.
| USD | EUR | GBP | JPY | CAD | AUD | NZD | CHF | |
|---|---|---|---|---|---|---|---|---|
| USD | -0.84% | -0.96% | -0.89% | -0.28% | -1.22% | -1.62% | -1.27% | |
| EUR | 0.84% | -0.14% | -0.06% | 0.55% | -0.36% | -0.82% | -0.45% | |
| GBP | 0.96% | 0.14% | 0.06% | 0.70% | -0.21% | -0.66% | -0.31% | |
| JPY | 0.89% | 0.06% | -0.06% | 0.61% | -0.30% | -0.72% | -0.38% | |
| CAD | 0.28% | -0.55% | -0.70% | -0.61% | -0.91% | -1.32% | -0.99% | |
| AUD | 1.22% | 0.36% | 0.21% | 0.30% | 0.91% | -0.42% | -0.09% | |
| NZD | 1.62% | 0.82% | 0.66% | 0.72% | 1.32% | 0.42% | 0.34% | |
| CHF | 1.27% | 0.45% | 0.31% | 0.38% | 0.99% | 0.09% | -0.34% |
The heat map shows percentage changes of major currencies against each other. The base currency is picked from the left column, while the quote currency is picked from the top row. For example, if you pick the US Dollar from the left column and move along the horizontal line to the Japanese Yen, the percentage change displayed in the box will represent USD (base)/JPY (quote).
As of writing, the US Dollar Index (DXY), which tracks the Greenback’s value against six major currencies, is down 0.75% to near 98.75.
Earlier in the day, US President Donald Trump announced that he had suspended planned attacks on Iranian civilian infrastructure for two weeks, as Tehran agreed to the reopening of the Strait of Hormuz, a passage to almost 20% of global energy supply.
Meanwhile, disappeared hawkish Federal Reserve (Fed) bets due to anchoring global inflation expectations, following a temporary truce between the US and Iran, have also weighed on the US Dollar.
According to the CME FedWatch tool, traders have priced out hopes of an interest rate hike this year, a sharp turnaround from expectations of two hikes built after the war started.
USD/JPY technical analysis
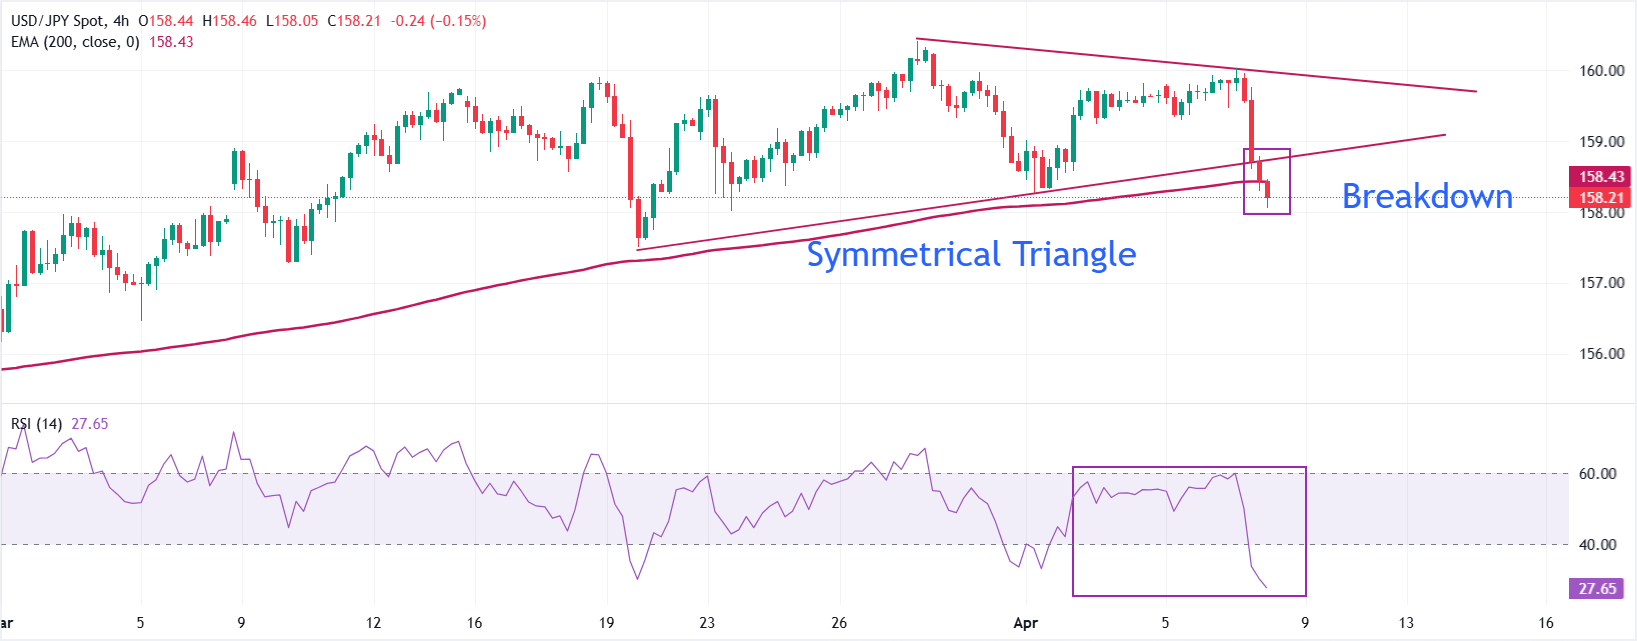
USD/JPY plummets to near 158.20 during the day. The near-term trend of the pair has turned bearish, following a breakdown of the Symmetrical Triangle formation on a four-hour timeframe. Price now holds below the broken ascending support line from 157.46, reinforcing the loss of upside structure, while the 200-period EMA near 158.40 caps intraday rebounds as dynamic resistance.
The 14-day Relative Strength Index (RSI) has dropped to 28, entering oversold territory and signaling strong bearish momentum, though stretched conditions could slow immediate downside extension.
Initial resistance emerges at the confluence of the 200-period EMA and former support trend-line area around 158.40, with the descending trend line adding another barrier closer to 159.00. A recovery through 159.00 would open 159.60 as the next resistance band and neutralize the current downside pressure.
On the downside, minor support is seen at 157.50, and a clear break below this would confirm a deeper bearish phase toward 157.00. Oversold RSI suggests that any bounce into 158.40–159.00 is likely to be treated as a selling area while price holds below the descending trend line.
(The technical analysis of this story was written with the help of an AI tool.)
Risk sentiment FAQs
In the world of financial jargon the two widely used terms “risk-on” and “risk off'' refer to the level of risk that investors are willing to stomach during the period referenced. In a “risk-on” market, investors are optimistic about the future and more willing to buy risky assets. In a “risk-off” market investors start to ‘play it safe’ because they are worried about the future, and therefore buy less risky assets that are more certain of bringing a return, even if it is relatively modest.
Typically, during periods of “risk-on”, stock markets will rise, most commodities – except Gold – will also gain in value, since they benefit from a positive growth outlook. The currencies of nations that are heavy commodity exporters strengthen because of increased demand, and Cryptocurrencies rise. In a “risk-off” market, Bonds go up – especially major government Bonds – Gold shines, and safe-haven currencies such as the Japanese Yen, Swiss Franc and US Dollar all benefit.
The Australian Dollar (AUD), the Canadian Dollar (CAD), the New Zealand Dollar (NZD) and minor FX like the Ruble (RUB) and the South African Rand (ZAR), all tend to rise in markets that are “risk-on”. This is because the economies of these currencies are heavily reliant on commodity exports for growth, and commodities tend to rise in price during risk-on periods. This is because investors foresee greater demand for raw materials in the future due to heightened economic activity.
The major currencies that tend to rise during periods of “risk-off” are the US Dollar (USD), the Japanese Yen (JPY) and the Swiss Franc (CHF). The US Dollar, because it is the world’s reserve currency, and because in times of crisis investors buy US government debt, which is seen as safe because the largest economy in the world is unlikely to default. The Yen, from increased demand for Japanese government bonds, because a high proportion are held by domestic investors who are unlikely to dump them – even in a crisis. The Swiss Franc, because strict Swiss banking laws offer investors enhanced capital protection.

超过一百万用户依赖 FXStreet 获取实时市场数据、图表工具、专家洞见和外汇新闻。其全面的经济日历和教育网络研讨会帮助交易者保持信息领先、做出审慎决策。FXStreet 拥有约 60 人的团队,分布在巴塞罗那总部及全球各地区。
阅读更多


