
WTI Crude Oil hesitates at $67.00 as Iran tensions offset tariff drag
作者 Joshua Gibson
发布日期: 24 Feb 2026 | 修改日期: 24 Feb 2026


热门文章

West Texas Intermediate (WTI) Crude Oil is caught between competing forces this week.
- Crude Oil pulls back from six-month highs as geopolitical risk premium meets fresh trade uncertainty.
- US-Iran tensions continue to underpin Crude Oil after Trump gave Tehran a 10 to 15-day ultimatum, with the USS Gerald Ford carrier group heading to the Persian Gulf and Iran conducting live-fire exercises in the Strait of Hormuz.
- Trump's proposed 15% global tariff under Section 122 of the Trade Act after the Supreme Court struck down his IEEPA tariffs, raises demand-side concerns that partially offset the geopolitical supply risk.
West Texas Intermediate (WTI) Crude Oil is caught between competing forces this week. On the supply side, escalating US-Iran tensions continue to support prices after Vice President Vance accused Tehran of failing to address Washington's red lines on its nuclear program, and reports suggest the US military is prepared for potential strikes. Iran's partial closure of the Strait of Hormuz for naval exercises has added to supply disruption fears, given that roughly 20 million barrels per day transit the waterway. On the demand side, the Supreme Court's 6-3 ruling last Friday struck down the administration's IEEPA tariffs, but Trump quickly moved to announce a potential 15% global tariff under Section 122 of the Trade Act, keeping trade policy uncertainty elevated. Last week's US Energy Information Administration (EIA) data showed an unexpected draw of 9 million barrels against expectations for a build, while OPEC+ continues to hold production steady through the first quarter, both of which provide a supportive floor.
Pullback from $67.00 as Stochastic presses into the overbought zone
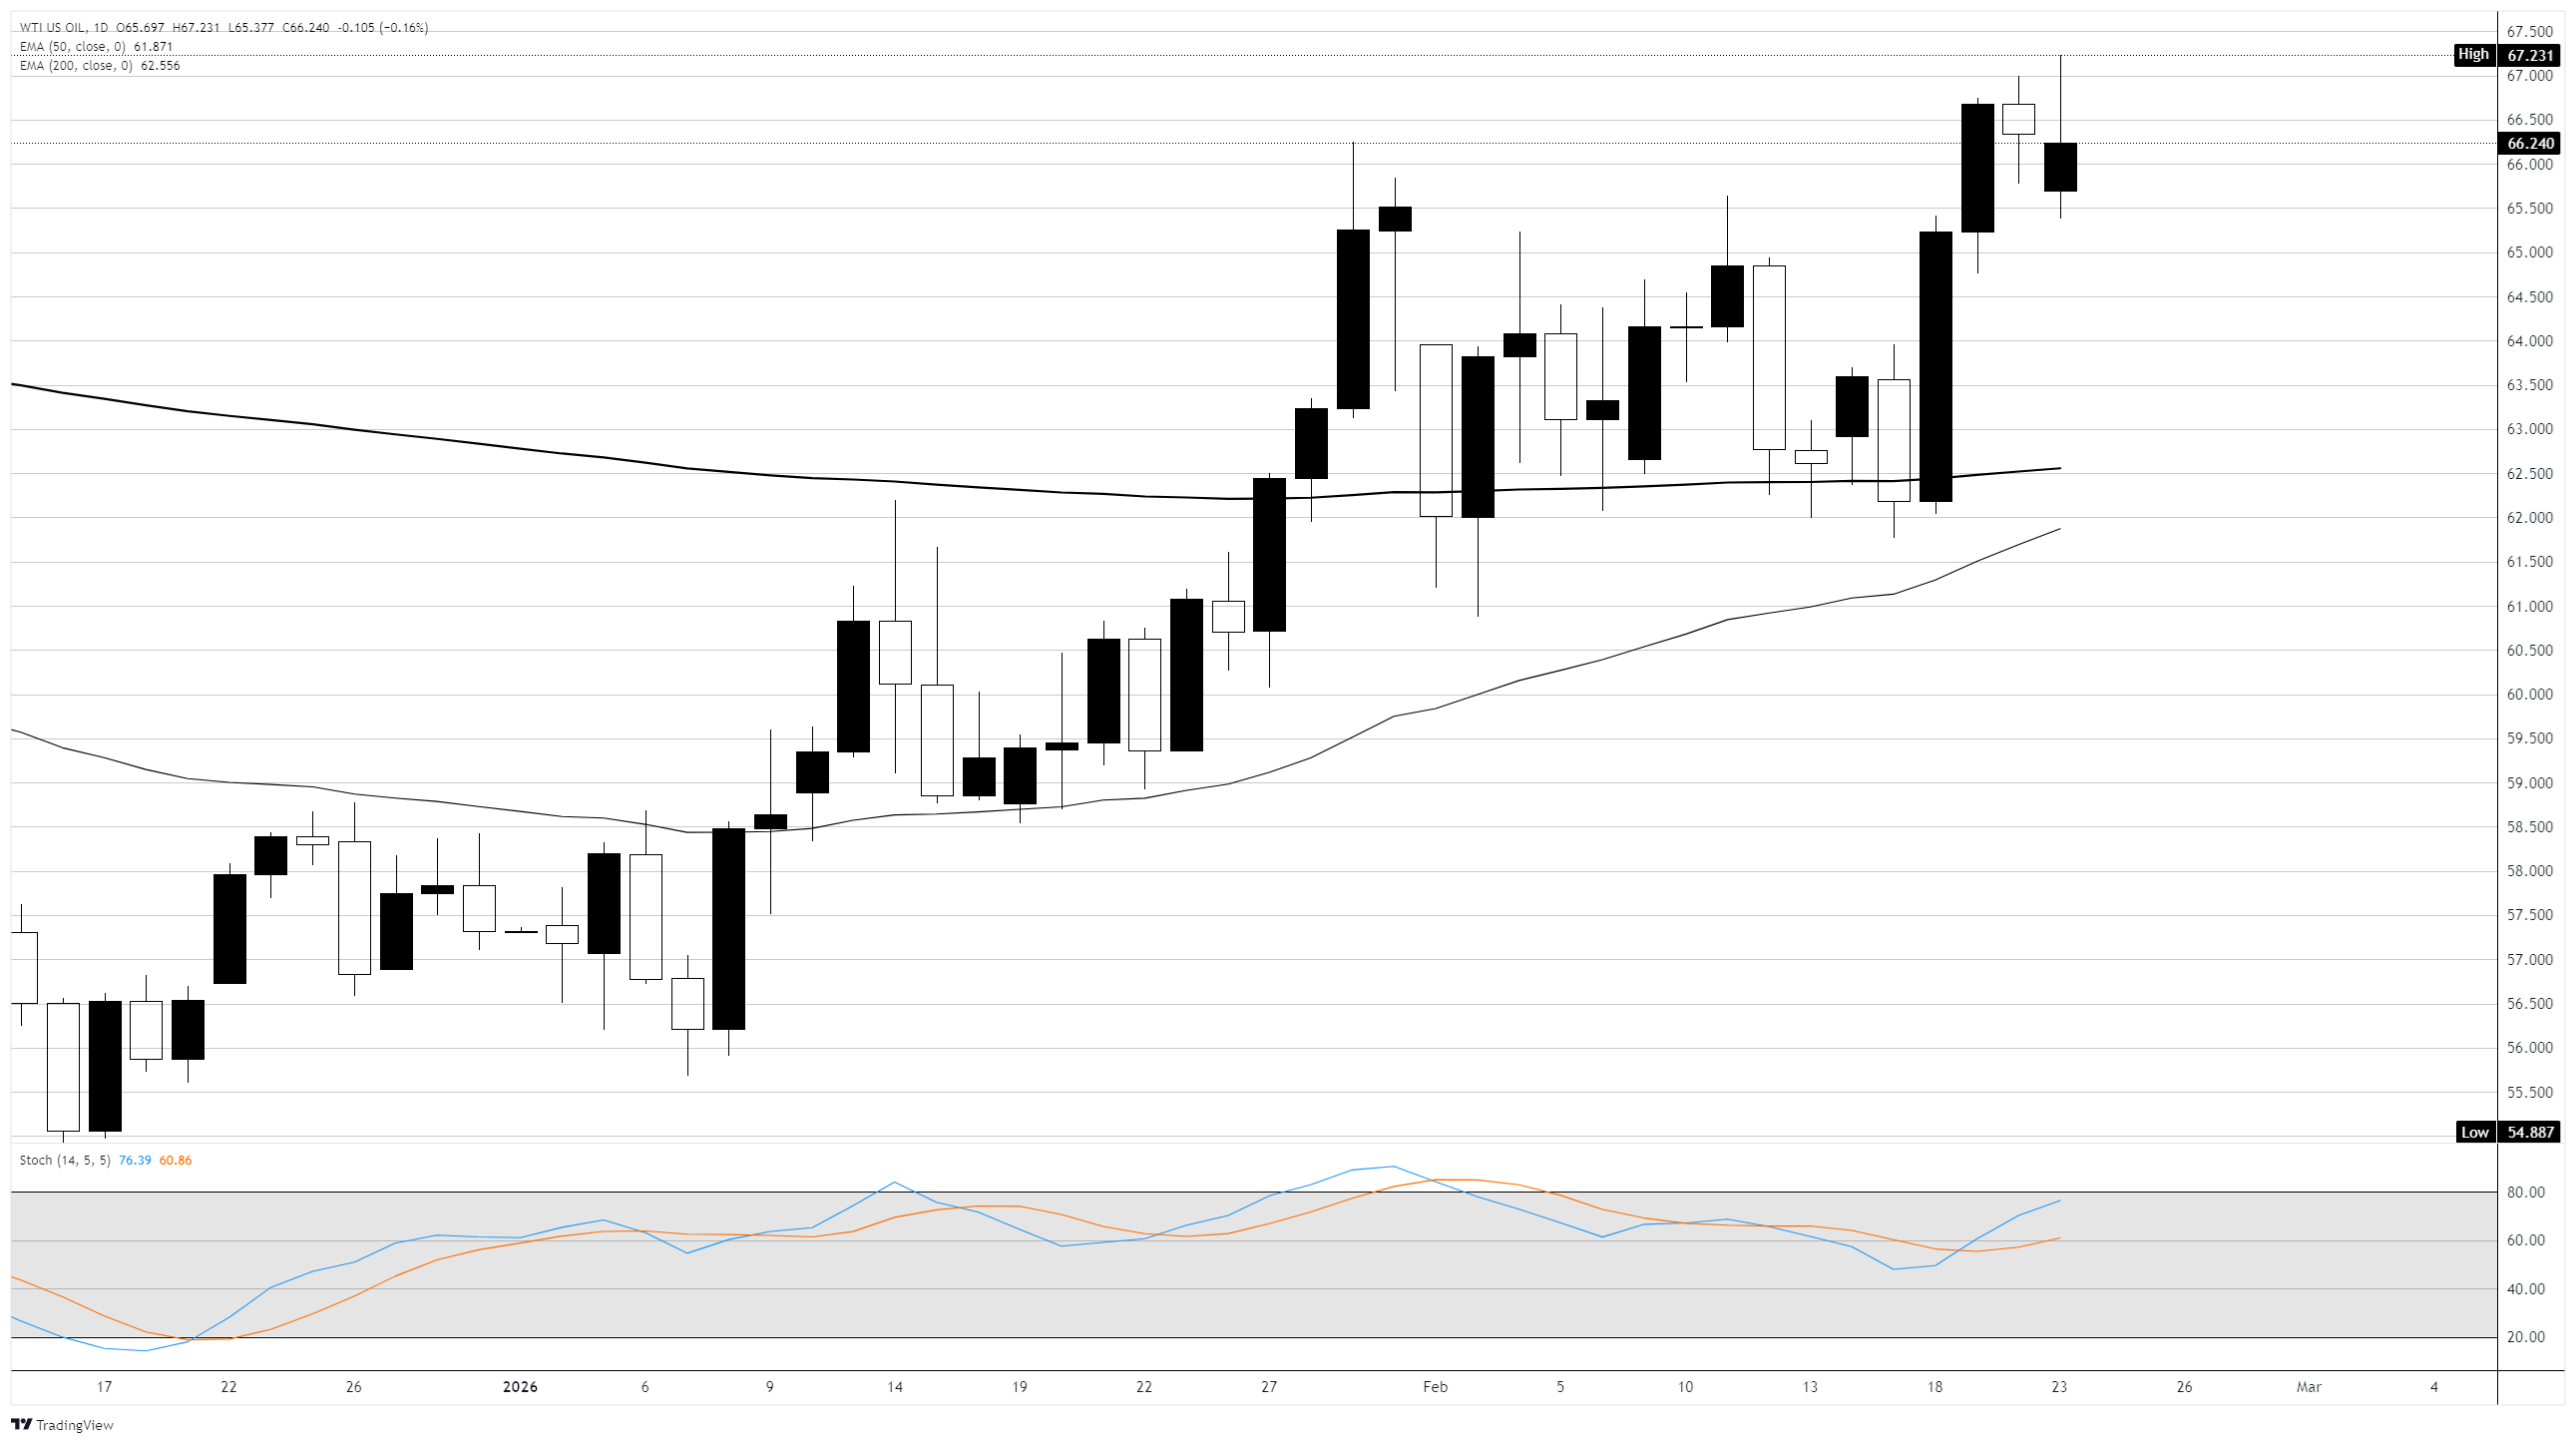
On the daily chart, WTI fell 0.18% on Monday, despit a recent bullish crossover of the 50-day above the 200-day, confirming a shift in the broader trend structure. The rally from the January swing low near $55.68 has been sharp, gaining over 20% in under two months. The Stochastic Oscillator is pressing into the overbought zone with the fast line leading the slow line higher, though the spread between the two is beginning to narrow, suggesting momentum could be peaking. Monday's candle printed a small body with an upper wick near $67.23, pointing to selling pressure at the round number. Immediate resistance sits at $67.00 to $67.23, with a sustained break above targeting the $70.00 psychological level; support is at $65.00 and then the $63.00 zone, where recent consolidation occurred.
Crude Oil daily chart
WTI Oil FAQs
WTI Oil is a type of Crude Oil sold on international markets. The WTI stands for West Texas Intermediate, one of three major types including Brent and Dubai Crude. WTI is also referred to as “light” and “sweet” because of its relatively low gravity and sulfur content respectively. It is considered a high quality Oil that is easily refined. It is sourced in the United States and distributed via the Cushing hub, which is considered “The Pipeline Crossroads of the World”. It is a benchmark for the Oil market and WTI price is frequently quoted in the media.
Like all assets, supply and demand are the key drivers of WTI Oil price. As such, global growth can be a driver of increased demand and vice versa for weak global growth. Political instability, wars, and sanctions can disrupt supply and impact prices. The decisions of OPEC, a group of major Oil-producing countries, is another key driver of price. The value of the US Dollar influences the price of WTI Crude Oil, since Oil is predominantly traded in US Dollars, thus a weaker US Dollar can make Oil more affordable and vice versa.
The weekly Oil inventory reports published by the American Petroleum Institute (API) and the Energy Information Agency (EIA) impact the price of WTI Oil. Changes in inventories reflect fluctuating supply and demand. If the data shows a drop in inventories it can indicate increased demand, pushing up Oil price. Higher inventories can reflect increased supply, pushing down prices. API’s report is published every Tuesday and EIA’s the day after. Their results are usually similar, falling within 1% of each other 75% of the time. The EIA data is considered more reliable, since it is a government agency.
OPEC (Organization of the Petroleum Exporting Countries) is a group of 12 Oil-producing nations who collectively decide production quotas for member countries at twice-yearly meetings. Their decisions often impact WTI Oil prices. When OPEC decides to lower quotas, it can tighten supply, pushing up Oil prices. When OPEC increases production, it has the opposite effect. OPEC+ refers to an expanded group that includes ten extra non-OPEC members, the most notable of which is Russia.

超过一百万用户依赖 FXStreet 获取实时市场数据、图表工具、专家洞见和外汇新闻。其全面的经济日历和教育网络研讨会帮助交易者保持信息领先、做出审慎决策。FXStreet 拥有约 60 人的团队,分布在巴塞罗那总部及全球各地区。
阅读更多


