
WTI Price Forecast: Bullish 21-day and 50-day SMA crossover keeps upside bias intact
作者 Vishal Chaturvedi
发布日期: 3 Feb 2026 | 修改日期: 3 Feb 2026


热门文章

West Texas Intermediate (WTI) Crude Oil stages a technical rebound on Tuesday, as buyers step in ahead of the $60 psychological level. At the time of writing, WTI is trading around $62.45 per barrel, up about 0.70% on the day after reversing its earlier intraday losses.
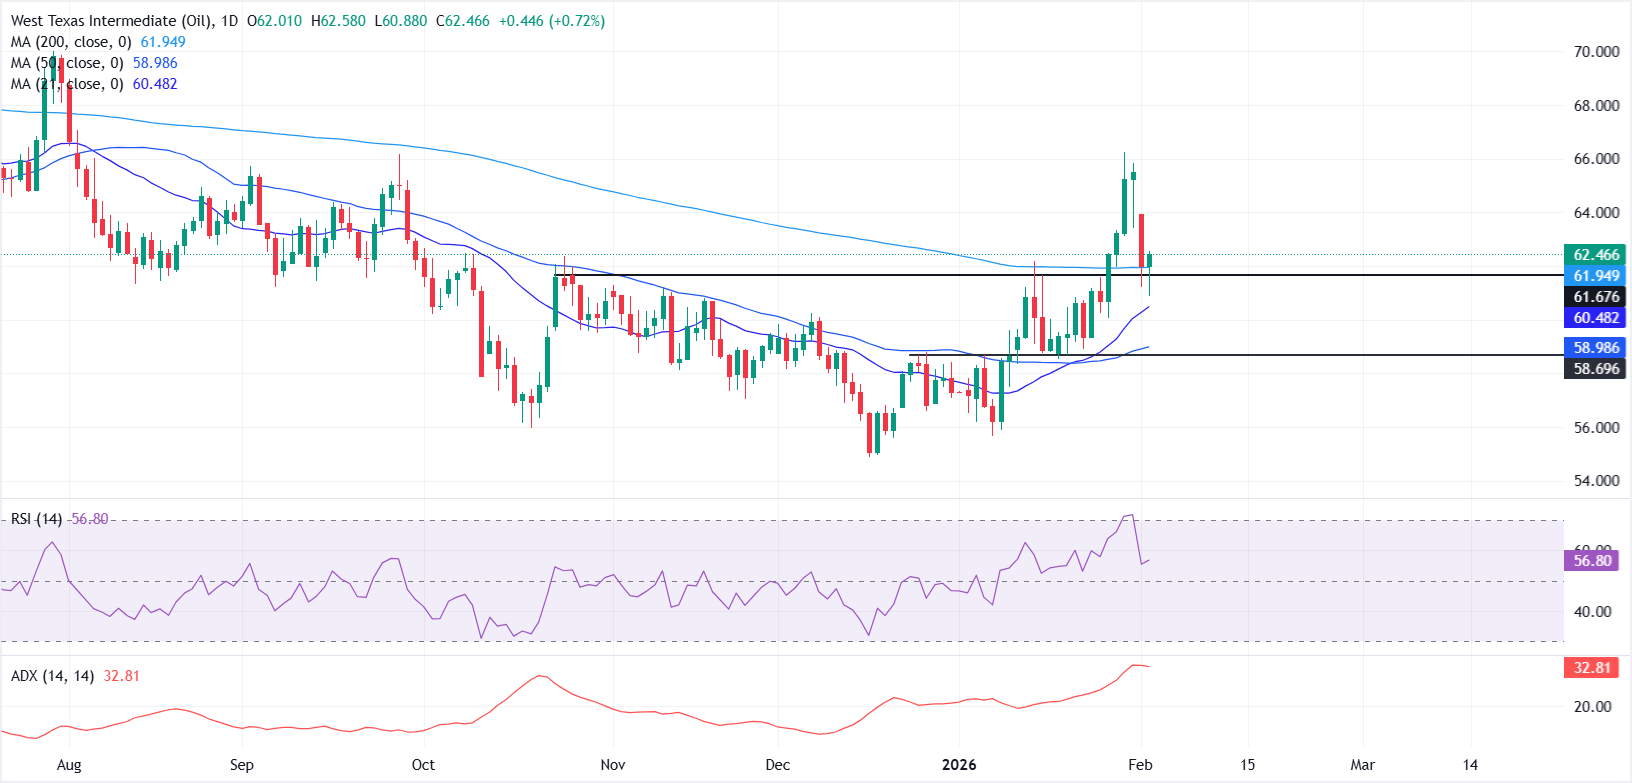
- WTI rebounds, with intraday buying lifting price back above the 200-day SMA near $61.95.
- The daily chart remains constructive, with a bullish crossover between the 21-day and 50-day SMAs.
- The ADX at 32.81 continues to point to a firm and strengthening trend.
West Texas Intermediate (WTI) Crude Oil stages a technical rebound on Tuesday, as buyers step in ahead of the $60 psychological level. At the time of writing, WTI is trading around $62.45 per barrel, up about 0.70% on the day after reversing its earlier intraday losses.
The US benchmark plunged nearly 5.3% on Monday as easing tensions between the United States and Iran weighed on prices and trimmed the geopolitical risk premium.
Sentiment improved after the US and Iran signalled a willingness to return to talks, easing fears of military escalation. Iranian President Masoud Pezeshkian said on Tuesday that he had instructed his foreign minister to pursue “fair and equitable negotiations”, with talks over Iran’s nuclear programme due later this week.
From a technical perspective, the daily chart points to a steadily improving structure, with a clear sequence of higher highs and higher lows in place after prices bottomed near $55 in mid-December.
WTI has reclaimed its key moving averages, with the 21-day SMA crossing above the 50-day SMA, while both remain below the flattening 200-day SMA. Price is now trading above all three averages, reinforcing a near-term bullish bias.
A sustained hold above the 200-day SMA at $61.95 would keep upside risks firmly in focus and could open the door for a retest of the multi-month high near $66, set on January 29.
On the downside, a slip back below $61.95 may trigger a pullback toward the 21-day SMA at $60.47, while a deeper break would expose the 50-day SMA near $58.98.
Momentum indicators remain supportive. The Average Directional Index (ADX) at 32.81 signals a firm and strengthening trend. The Relative Strength Index (RSI) is holding in bullish territory and remains comfortably above the 50 level, suggesting that upside momentum is still intact after easing from recently overbought conditions.
WTI Oil FAQs
WTI Oil is a type of Crude Oil sold on international markets. The WTI stands for West Texas Intermediate, one of three major types including Brent and Dubai Crude. WTI is also referred to as “light” and “sweet” because of its relatively low gravity and sulfur content respectively. It is considered a high quality Oil that is easily refined. It is sourced in the United States and distributed via the Cushing hub, which is considered “The Pipeline Crossroads of the World”. It is a benchmark for the Oil market and WTI price is frequently quoted in the media.
Like all assets, supply and demand are the key drivers of WTI Oil price. As such, global growth can be a driver of increased demand and vice versa for weak global growth. Political instability, wars, and sanctions can disrupt supply and impact prices. The decisions of OPEC, a group of major Oil-producing countries, is another key driver of price. The value of the US Dollar influences the price of WTI Crude Oil, since Oil is predominantly traded in US Dollars, thus a weaker US Dollar can make Oil more affordable and vice versa.
The weekly Oil inventory reports published by the American Petroleum Institute (API) and the Energy Information Agency (EIA) impact the price of WTI Oil. Changes in inventories reflect fluctuating supply and demand. If the data shows a drop in inventories it can indicate increased demand, pushing up Oil price. Higher inventories can reflect increased supply, pushing down prices. API’s report is published every Tuesday and EIA’s the day after. Their results are usually similar, falling within 1% of each other 75% of the time. The EIA data is considered more reliable, since it is a government agency.
OPEC (Organization of the Petroleum Exporting Countries) is a group of 12 Oil-producing nations who collectively decide production quotas for member countries at twice-yearly meetings. Their decisions often impact WTI Oil prices. When OPEC decides to lower quotas, it can tighten supply, pushing up Oil prices. When OPEC increases production, it has the opposite effect. OPEC+ refers to an expanded group that includes ten extra non-OPEC members, the most notable of which is Russia.

超过一百万用户依赖 FXStreet 获取实时市场数据、图表工具、专家洞见和外汇新闻。其全面的经济日历和教育网络研讨会帮助交易者保持信息领先、做出审慎决策。FXStreet 拥有约 60 人的团队,分布在巴塞罗那总部及全球各地区。
阅读更多


