
Zcash Price Forecast: ZEC declines as technical rejection and mixed market sentiment weigh
作者 Manish Chhetri
发布日期: 29 Jan 2026 | 修改日期: 29 Jan 2026


热门文章

Zcash (ZEC) price continues to trade in the red, below $366 on Thursday, after failing to break through the previously broken trendline in the past couple of days. On-chain and derivatives data indicate mixed sentiment among traders, further limiting the chances of a price recovery.
- Zcash price extends its decline on Thursday for a second straight day after failing to close above the previously broken trendline.
- On-chain data shows mixed sentiment, with increased large orders offset by growing sell-side dominance.
- Derivatives data indicate a cautious outlook, as funding rates turn positive but short bets continue to build.
Zcash (ZEC) price continues to trade in the red, below $366 on Thursday, after failing to break through the previously broken trendline in the past couple of days. On-chain and derivatives data indicate mixed sentiment among traders, further limiting the chances of a price recovery.
Mixed sentiment caps recovery
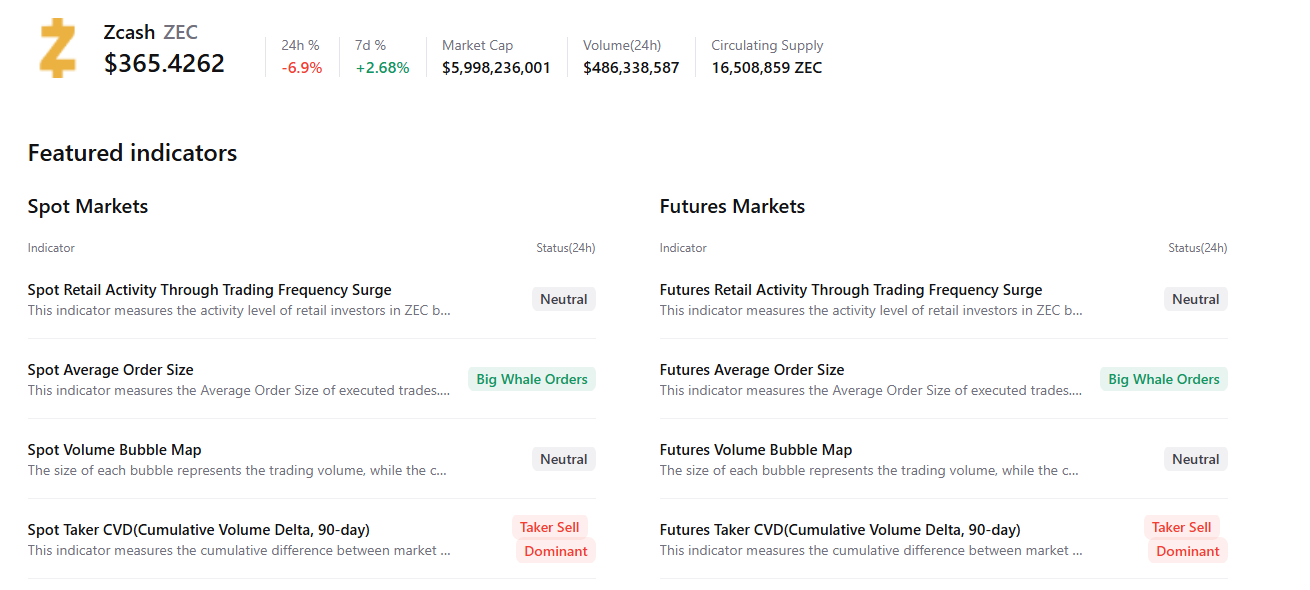
CryptoQuant’s summary data suggests ZCash sentiment among traders is mixed. While there are large whale orders in both the spot and futures markets, suggesting bullish interest, rising sell-side dominance indicates that selling pressure remains elevated. This combination suggests indecision among investors and limits the chances of a sustained recovery.
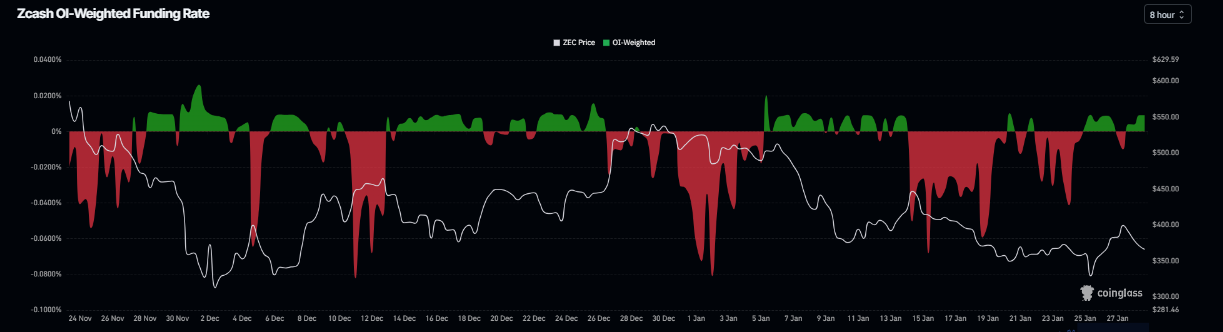
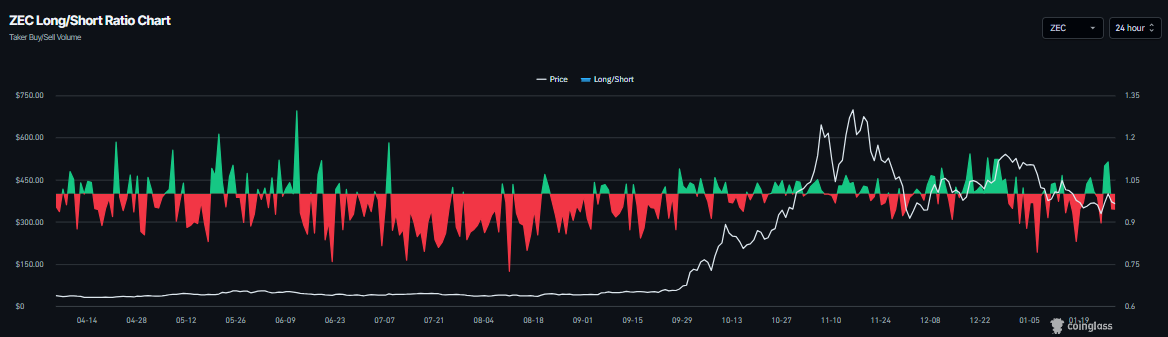
Similarly, the derivatives market is cautious. CoinGlass data shows ZEC’s funding rate flipped positive on Wednesday and is at 0.0091% on Thursday, indicating that long positions are paying shorts and hinting at a bullish sentiment. However, the long-to-short ratio has slipped to 0.94, signaling a rise in short bets. This divergence highlights growing uncertainty in the derivatives market and weakens bullish conviction.
Zcash Price Forecast: ZEC faces rejection from key levels
On the technical side, ZEC's near-term outlook leans bearish. The token started the week on a positive note, rallied 21% by Tuesday, and retested the previously broken ascending trendline (drawn by joining multiple lows since October).
On Wednesday, ZEC failed to break through this resistance level and declined by 7.2%. This resistance level is very strong, as the trendline level roughly coincides with the 50-day Exponential Moving Average (EMA) at $411.08, the volume profile Point of Control (POC), the price level with the highest traded volume since mid-October and the 61.8% Fibonacci retracement level at $400.02.
If ZEC continues its correction, it could extend the decline toward Sunday’s low of $325. A close below this could extend further losses toward the December 3 low of $301.14.
The Relative Strength Index (RSI) read 43, below the neutral level of 50, indicating that bearish momentum is gaining traction. In addition, the Moving Average Convergence Divergence (MACD) lines are converging, with fading green histogram bars above the neutral value, signaling a slight fading bullish strength.
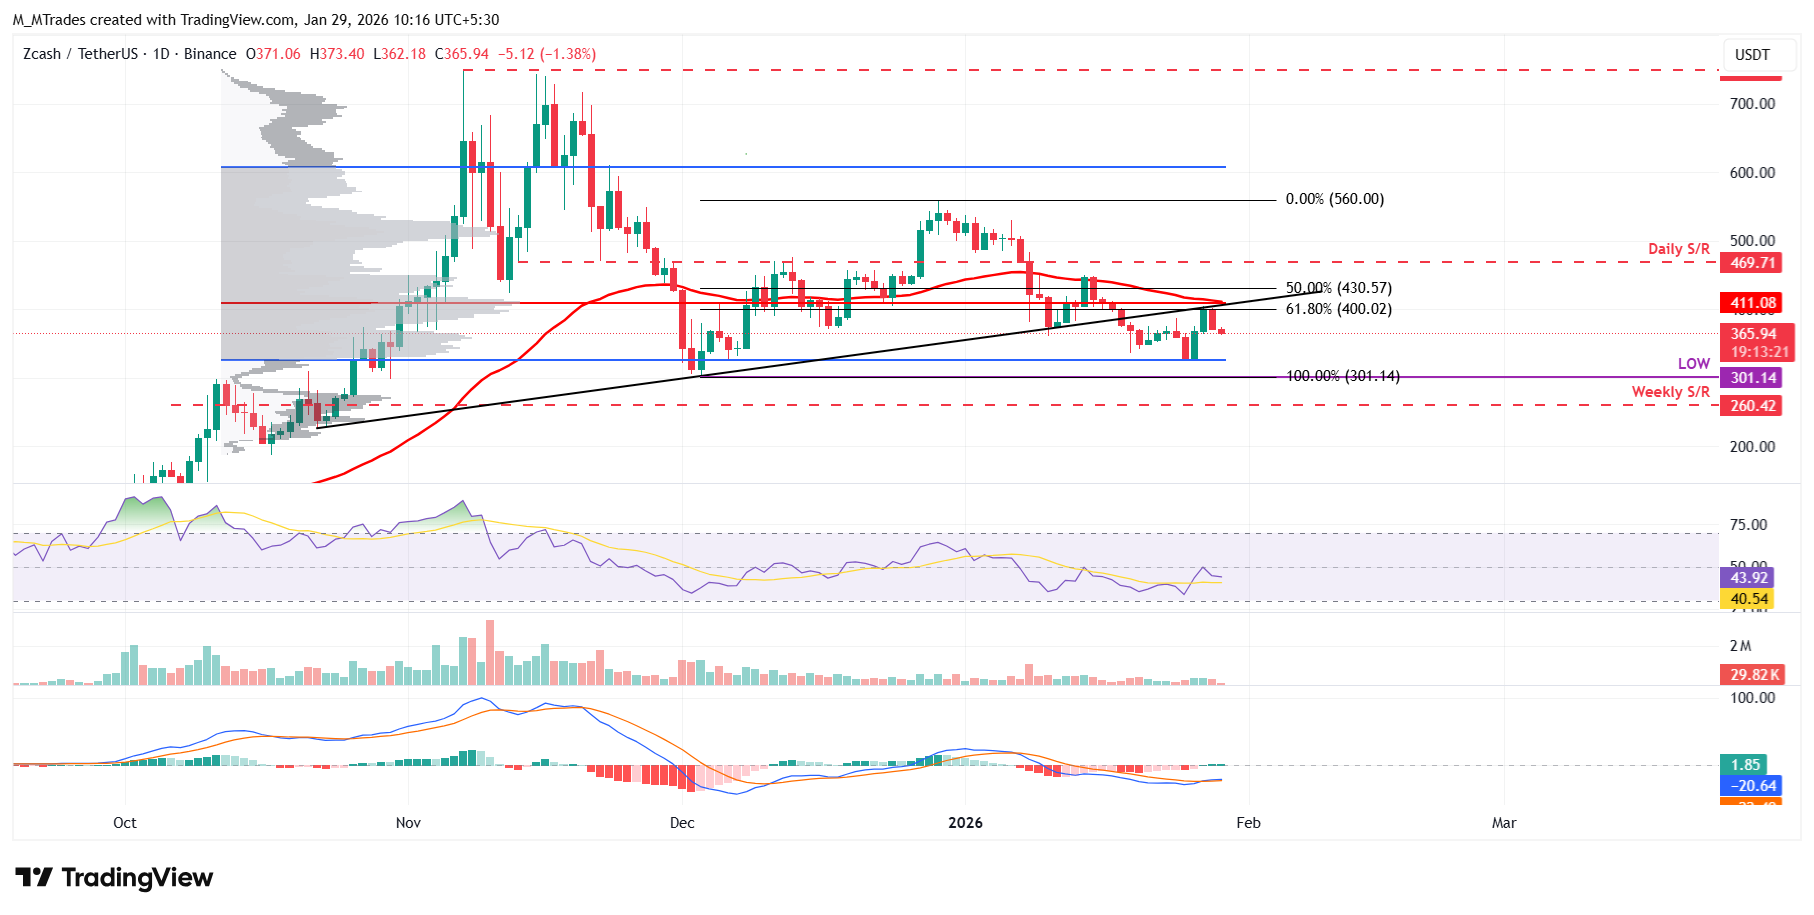
On the other hand, if ZEC recovers and closes above the 50-day EMA at $411.08 on a daily basis, it could extend the rally toward the 50% retracement level at $430.57.

超过一百万用户依赖 FXStreet 获取实时市场数据、图表工具、专家洞见和外汇新闻。其全面的经济日历和教育网络研讨会帮助交易者保持信息领先、做出审慎决策。FXStreet 拥有约 60 人的团队,分布在巴塞罗那总部及全球各地区。
阅读更多


