
Trade The World
AUD/JPY Price Forecast: Falls to near 96.00 as sentiment remains neutral
作者 Akhtar Faruqui
发布日期: 31 Jul 2025 | 修改日期: 31 Jul 2025


POPULAR ARTICLES

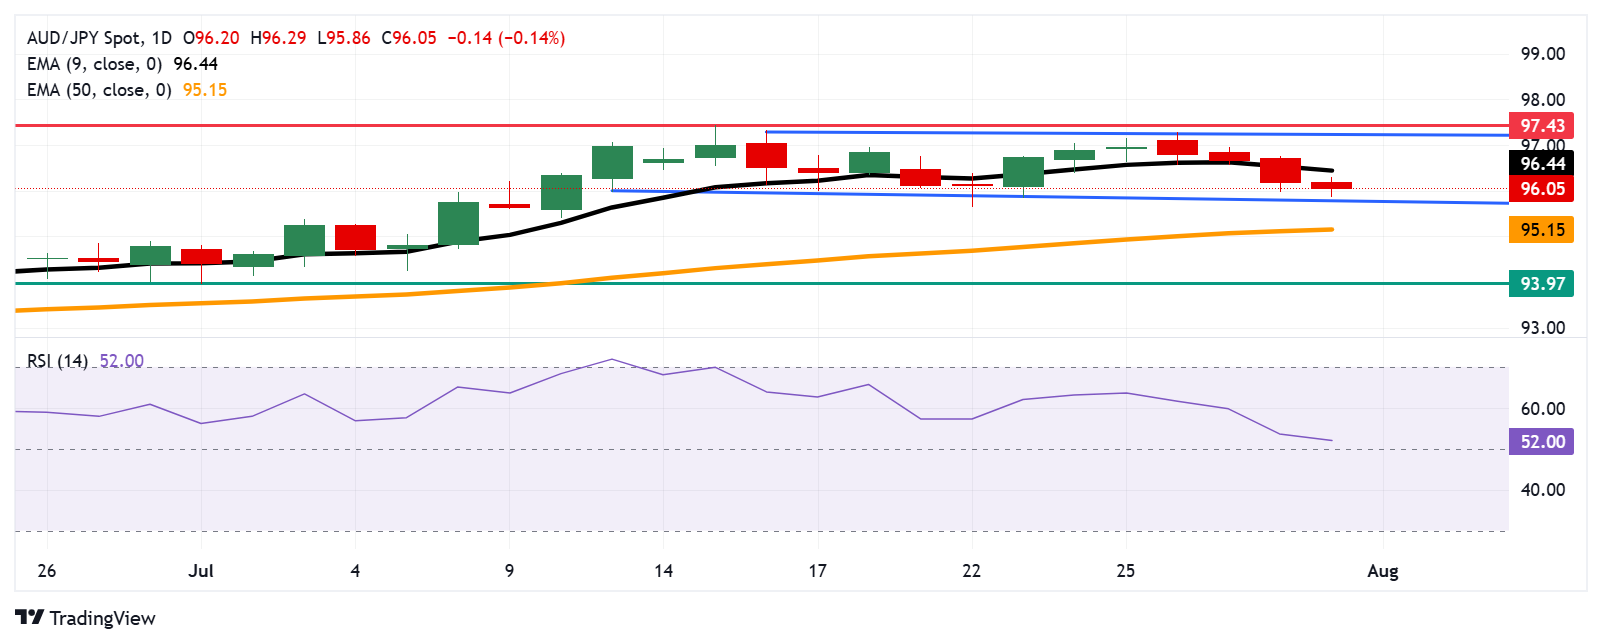
AUD/JPY loses ground for the fourth successive session, trading around 96.10 during the Asian hours on Thursday. The technical analysis of the daily chart shows that the currency cross moves sideways within the rectangular pattern, suggesting a prevailing neutral sentiment.
- AUD/JPY may find primary resistance at the nine-day EMA at 96.44.
- The 14-day Relative Strength Index remains above the 50 mark, suggesting a bullish bias is active.
- The immediate support appears at the rectangle’s lower boundary around 95.80.
AUD/JPY loses ground for the fourth successive session, trading around 96.10 during the Asian hours on Thursday. The technical analysis of the daily chart shows that the currency cross moves sideways within the rectangular pattern, suggesting a prevailing neutral sentiment.
The 14-day Relative Strength Index (RSI) is positioned slightly above the 50 mark, suggesting a bullish bias is active. However, the AUD/JPY cross has moved below the nine-day Exponential Moving Average (EMA), indicating short-term price momentum is weakening.
On the upside, the AUD/JPY cross may target the nine-day EMA at 96.44. A break above this level would improve the short-term price momentum and support the pair to approach the upper boundary of the rectangle around 97.30, followed by the six-month high at 97.43, which was recorded on July 15.
The AUD/JPY cross may find immediate support at the rectangle’s lower boundary around 95.80. A break below the rectangle could cause the emergence of the bearish bias and put downward pressure on the currency cross to navigate the region around the 50-day EMA at 95.15. Further declines would prompt the cross to approach the monthly low at 93.97, which was recorded on July 1.
AUD/JPY: Daily Chart
Australian Dollar PRICE Today
The table below shows the percentage change of Australian Dollar (AUD) against listed major currencies today. Australian Dollar was the weakest against the Japanese Yen.
| USD | EUR | GBP | JPY | CAD | AUD | NZD | CHF | |
|---|---|---|---|---|---|---|---|---|
| USD | -0.16% | -0.16% | -0.42% | -0.03% | -0.31% | -0.37% | -0.17% | |
| EUR | 0.16% | -0.01% | -0.26% | 0.14% | -0.18% | -0.21% | -0.00% | |
| GBP | 0.16% | 0.01% | -0.24% | 0.15% | -0.17% | -0.20% | 0.01% | |
| JPY | 0.42% | 0.26% | 0.24% | 0.40% | 0.12% | 0.11% | 0.29% | |
| CAD | 0.03% | -0.14% | -0.15% | -0.40% | -0.22% | -0.35% | -0.14% | |
| AUD | 0.31% | 0.18% | 0.17% | -0.12% | 0.22% | -0.03% | 0.17% | |
| NZD | 0.37% | 0.21% | 0.20% | -0.11% | 0.35% | 0.03% | 0.21% | |
| CHF | 0.17% | 0.00% | -0.01% | -0.29% | 0.14% | -0.17% | -0.21% |
The heat map shows percentage changes of major currencies against each other. The base currency is picked from the left column, while the quote currency is picked from the top row. For example, if you pick the Australian Dollar from the left column and move along the horizontal line to the US Dollar, the percentage change displayed in the box will represent AUD (base)/USD (quote).

FXStreet
超过一百万用户依赖 FXStreet 获取实时市场数据、图表工具、专家洞见和外汇新闻。其全面的经济日历和教育网络研讨会帮助交易者保持信息领先、做出审慎决策。FXStreet 拥有约 60 人的团队,分布在巴塞罗那总部及全球各地区。
Read More


