
Trade The World
Bitcoin Cash Price Forecast: BCH risks drop to $450 amid rising profit-taking, bearish market signals
作者 Manish Chhetri
发布日期: 16 Oct 2025 | 修改日期: 16 Oct 2025


POPULAR ARTICLES

Bitcoin Cash (BCH) trades in red below $520 at the time of writing on Thursday, after facing rejection from a previously broken trendline earlier this week. Rising profit-taking activity and bearish derivatives data indicate that selling pressure may persist in the short term.
- Bitcoin Cash trades in red on Thursday after facing rejection from a previously broken trendline earlier this week.
- On-chain and derivatives data point to further downside, with profit-taking activity increasing and funding rates turning negative.
- The technical outlook suggests a potential drop toward the $450 level as momentum indicators flash bearish signals.
Bitcoin Cash (BCH) trades in red below $520 at the time of writing on Thursday, after facing rejection from a previously broken trendline earlier this week. Rising profit-taking activity and bearish derivatives data indicate that selling pressure may persist in the short term. BCH could be poised for a deeper correction toward the $450 mark as funding rates are turning negative and momentum indicators point lower.
BCH’s on-chain and derivatives data lean bearish
Santiment's Network Realized Profit/Loss (NPL) metric indicates that Bitcoin Cash holders are booking some profits this week.
As shown in the chart below, the metric experienced multiple spikes on Wednesday and Thursday. These spikes indicate that holders are, on average, selling their bags at a significant profit, thereby increasing the selling pressure.
 [13-1760608598249-1760608598250.56.20, 16 Oct, 2025].png)
BCH age consumed chart. Source: Santiment
On the derivatives side, Bitcoin Cash also supports a bearish outlook. CoinGlass’s OI-Weighted Funding Rate data shows that the number of traders betting that the BCH price will slide further is higher than those anticipating a price increase.
The metric has flipped to a negative rate and reads -0.0007% on Thursday. The negative ratio suggests that shorts are paying longs, indicating a bearish sentiment for BCH.
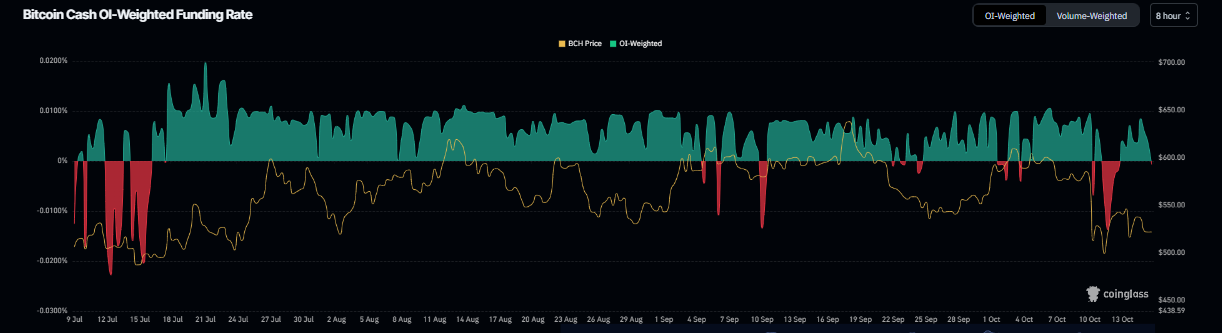
BCH funding rate chart. Source: Coinglass
Bitcoin Cash Price Forecast: BCH risks potential drop to $450
Bitcoin Cash price faced rejection from the previously broken ascending trendline (drawn by connecting multiple lows since mid-April) on Tuesday and declined nearly 5% by the next day. At the time of writing on Thursday, it trades down around $251.
If BCH continues its correction and closes below the 200-day Exponential Moving Average (EMA) at $506.4, it could extend the decline toward the next support level at $450.2.
The Relative Strength Index (RSI) indicator at 39 on the daily chart suggests that bearish momentum is gaining traction. Additionally, the Moving Average Convergence Divergence (MACD) showed a bearish crossover last week, which remains in effect, further supporting the bearish view.
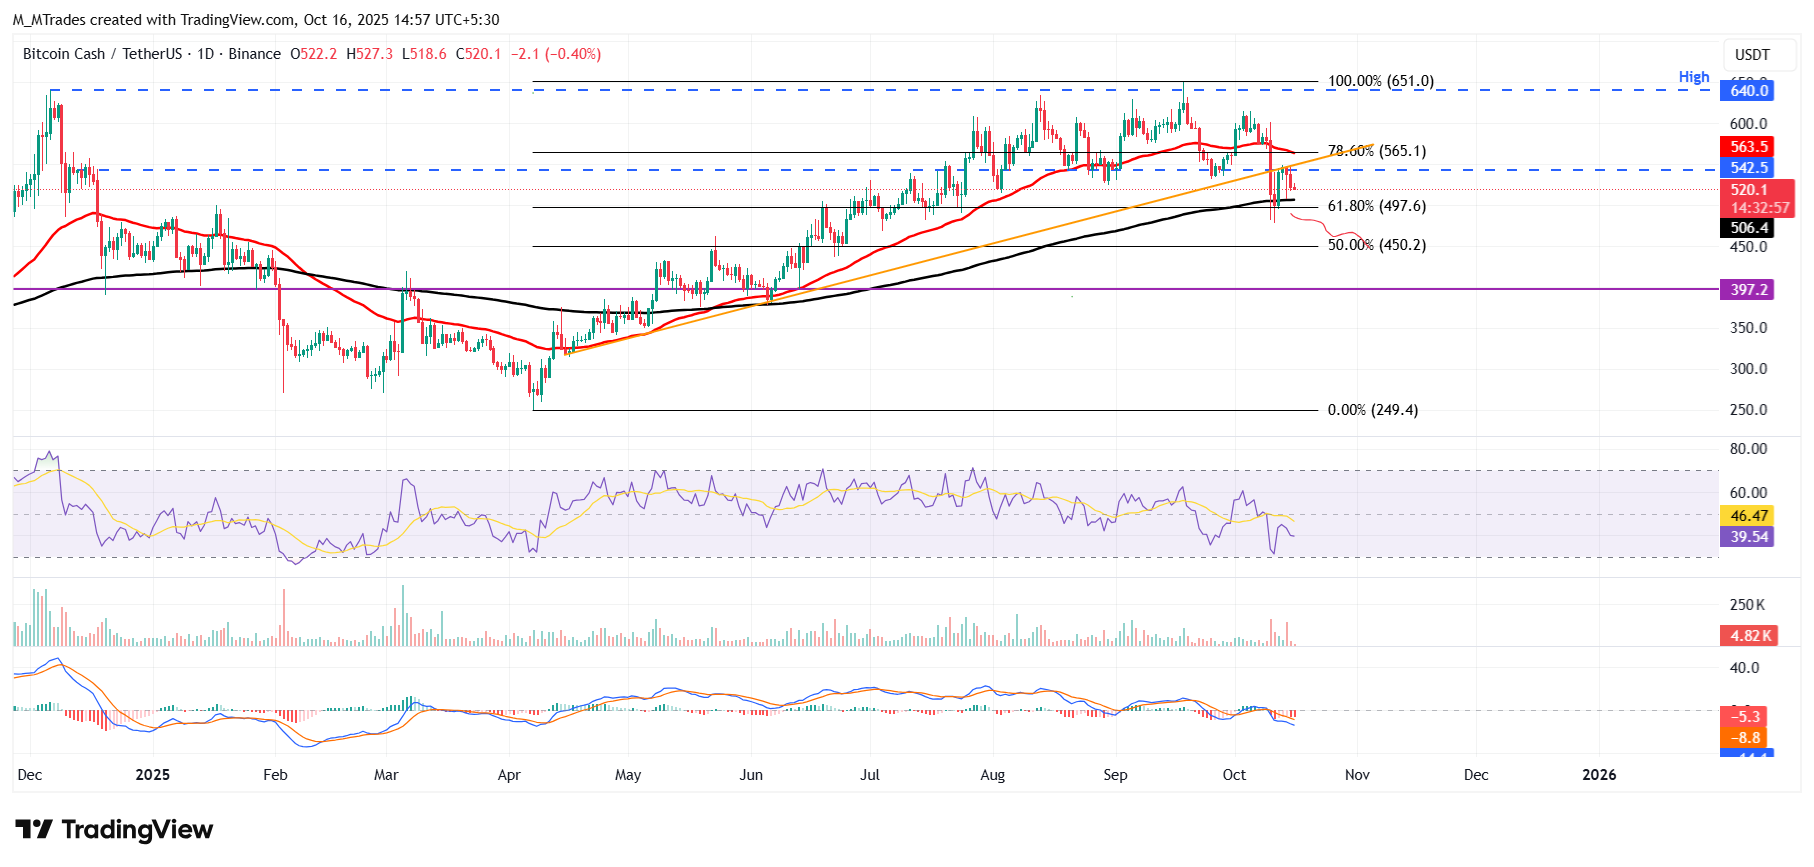
BCH/USDT daily chart
However, if BCH recovers, it could extend the recovery toward the daily resistance level at $542.5.

FXStreet
超过一百万用户依赖 FXStreet 获取实时市场数据、图表工具、专家洞见和外汇新闻。其全面的经济日历和教育网络研讨会帮助交易者保持信息领先、做出审慎决策。FXStreet 拥有约 60 人的团队,分布在巴塞罗那总部及全球各地区。
Read More


