
Trade The World
Bitcoin Cash Price Forecast: BCH risks drop to $450 as bearish sentiment deepens
作者 Manish Chhetri
发布日期: 4 Nov 2025 | 修改日期: 4 Nov 2025


POPULAR ARTICLES

Bitcoin Cash (BCH) price is hovering around $508 at the time of writing on Tuesday, after being rejected by the previously broken trendline. Weak on-chain and derivatives metrics, coupled with declining market sentiment, suggest a deeper correction as bears set their sights on the $450 support zone.
- Bitcoin Cash price hovers around $508 on Tuesday after being rejected by the previously broken trendline.
- On-chain and derivatives metrics point to a bearish outlook, with falling social dominance, declining open interest, and negative funding rates.
- Technical indicators suggest further downside potential, with bears eyeing the $450 support level.
Bitcoin Cash (BCH) price is hovering around $508 at the time of writing on Tuesday, after being rejected by the previously broken trendline. Weak on-chain and derivatives metrics, coupled with declining market sentiment, suggest a deeper correction as bears set their sights on the $450 support zone.
On-chain and derivatives data signal bearish momentum for Bitcoin Cash
Santiment’s Social Dominance metric for BCH highlights its bearish outlook. The index measures the share of BCH-related discussions across the cryptocurrency media. It has dropped from 0.76% on October 25 to 0.15% on Tuesday, its lowest level this year and the lowest since July 2023. This fall indicates waning investor interest and reduced community engagement around Bitcoin Cash.
 [08-1762226123269-1762226123270.27.49, 04 Nov, 2025].png)
BCH Social Dominance chart. Source: Santiment
On the derivatives side, Coinglass’s futures Open Interest for Bitcoin Cash drops to $148.18 million on Tuesday, compared to $200 million on October 4. This drop in OI, which has been falling since September, signals waning investor participation and reinforces a weakening market sentiment for the BCH.
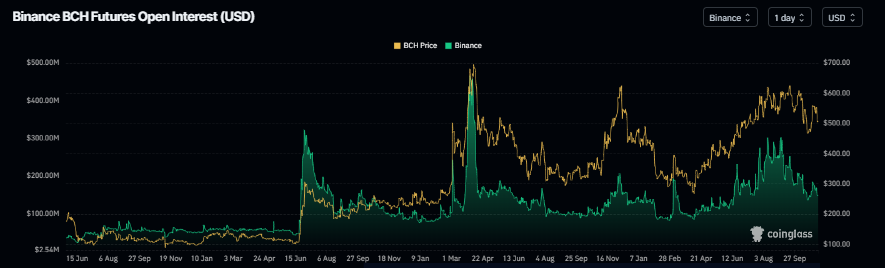
Bitcoin Cash open interest chart. Source: Coinglass
Coinglass’s OI-Weighted Funding Rate data shows that the number of traders betting that the price of BCH will slide further is higher than that anticipating a price increase. The metric flipped to a negative rate on Tuesday, to 0.0039%, indicating that shorts are paying longs. Historically, as shown in the chart below, when the funding rates have flipped from positive to negative, the BCH price has fallen sharply.
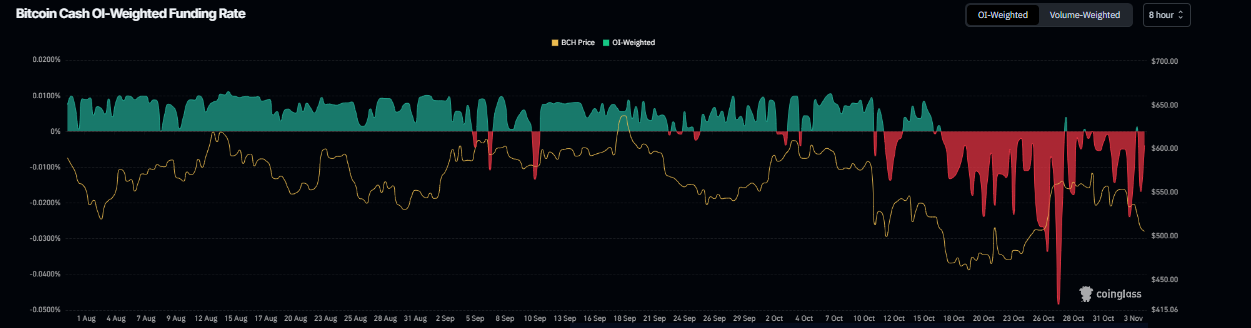
BCH funding rate chart. Source: Coinglass
Bitcoin Cash Price Forecast: BCH bears targeting a drop toward $450
Bitcoin Cash price faced rejection at the previously broken trendline last week and declined by 4%. This trendline roughly coincides with the 78.6% Fibonacci retracement level (drawn from the April low of $249.4 to the September high of $651) at $565.1, making this a key resistance zone. On Monday, BCH continued its correction, declining by more than 5%. At the time of writing on Tuesday, BCH hovers around $508.
If BCH closes below the 61.8% Fibonacci level at $497.6, it could extend the decline toward the next support level at $450.2.
The Relative Strength Index (RSI) on the daily chart reads 43, below the neutral level of 50, indicating bearish momentum gaining traction. The Moving Average Convergence Divergence (MACD) lines are also converging, with decreasing green histogram bars signaling fading bullish momentum.
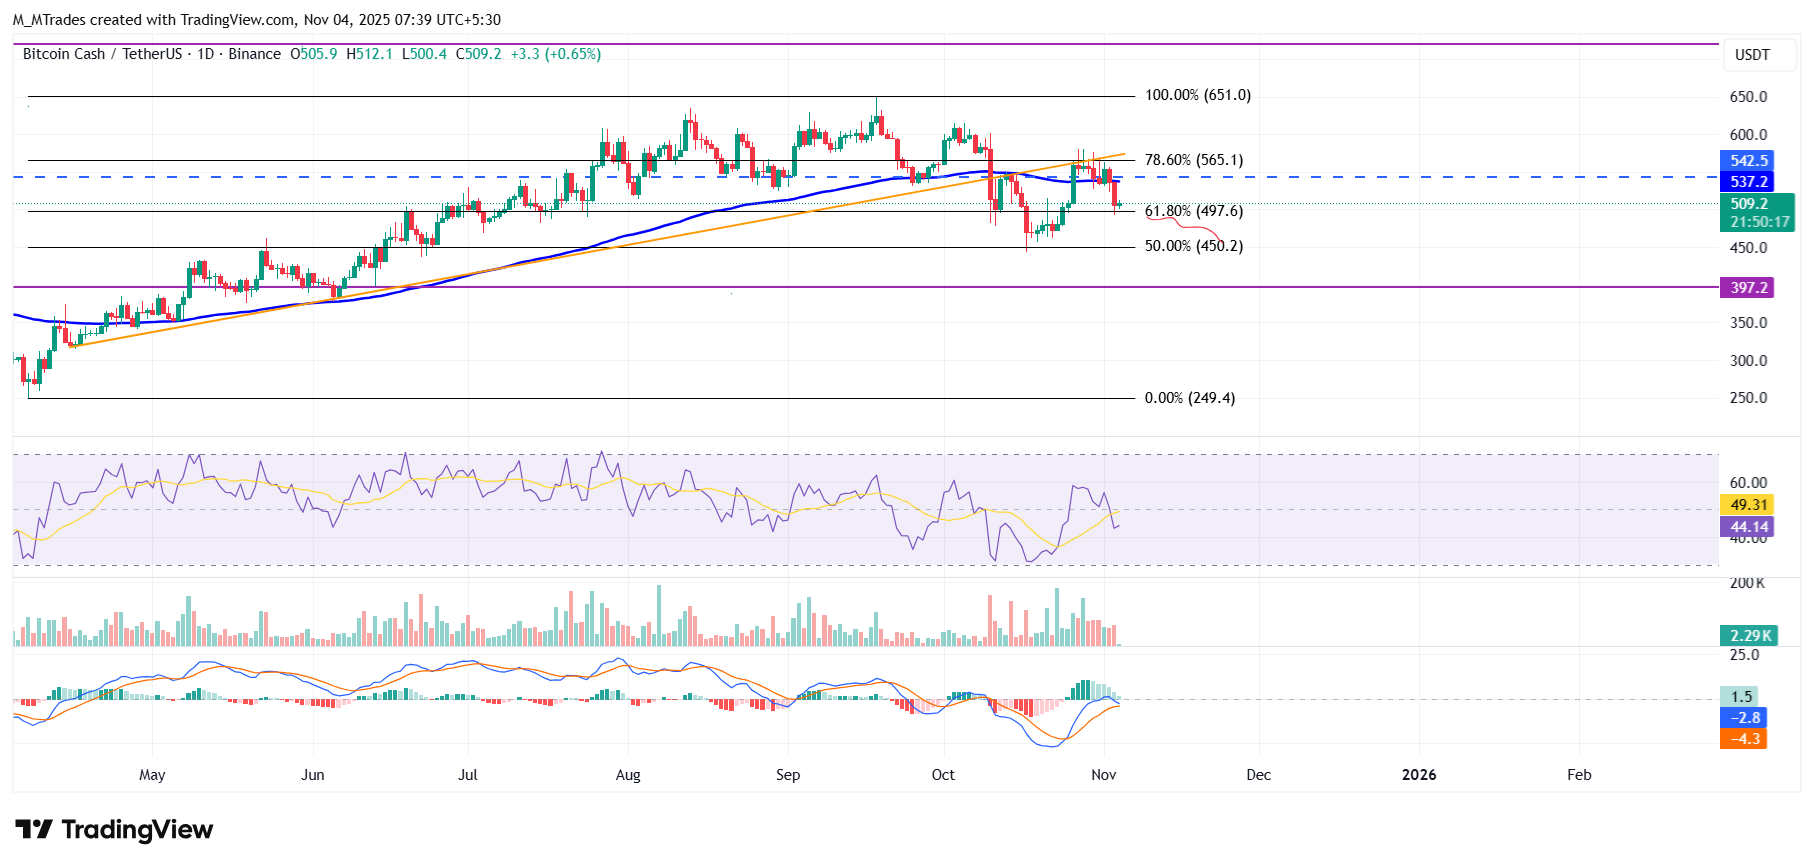
BCH/USDT daily chart
On the other hand, if BCH finds support around the $497.6 level and recovers, it could extend the recovery toward the 100-day EMA at $537.1.

FXStreet
超过一百万用户依赖 FXStreet 获取实时市场数据、图表工具、专家洞见和外汇新闻。其全面的经济日历和教育网络研讨会帮助交易者保持信息领先、做出审慎决策。FXStreet 拥有约 60 人的团队,分布在巴塞罗那总部及全球各地区。
Read More


