
Trade The World
Cardano Price Forecast: ADA on-chain and derivatives data show signs of early recovery
作者 Manish Chhetri
发布日期: 27 Nov 2025 | 修改日期: 27 Nov 2025


POPULAR ARTICLES

Cardano (ADA) is trading around $0.43 at the time of writing on Thursday, after recovering nearly 7% so far this week. The recovery is further supported by ADA’s large whale orders and buy-side dominance, which have risen alongside positive funding rates.
- Cardano price hovers around $0.43 on Thursday after recovering nearly 7% so far this week.
- On-chain and derivatives data back a bullish sentiment with large whale orders, buy-side dominance, and a positive funding rate.
- The technical outlook suggests a further recovery, with ADA targeting $0.50.
Cardano (ADA) is trading around $0.43 at the time of writing on Thursday, after recovering nearly 7% so far this week. The recovery is further supported by ADA’s large whale orders and buy-side dominance, which have risen alongside positive funding rates. On the technical side, ADA's price action suggests a further rebound targeting levels above the $0.50 mark.
Cardano’s on-chain and derivatives data show bullish bias
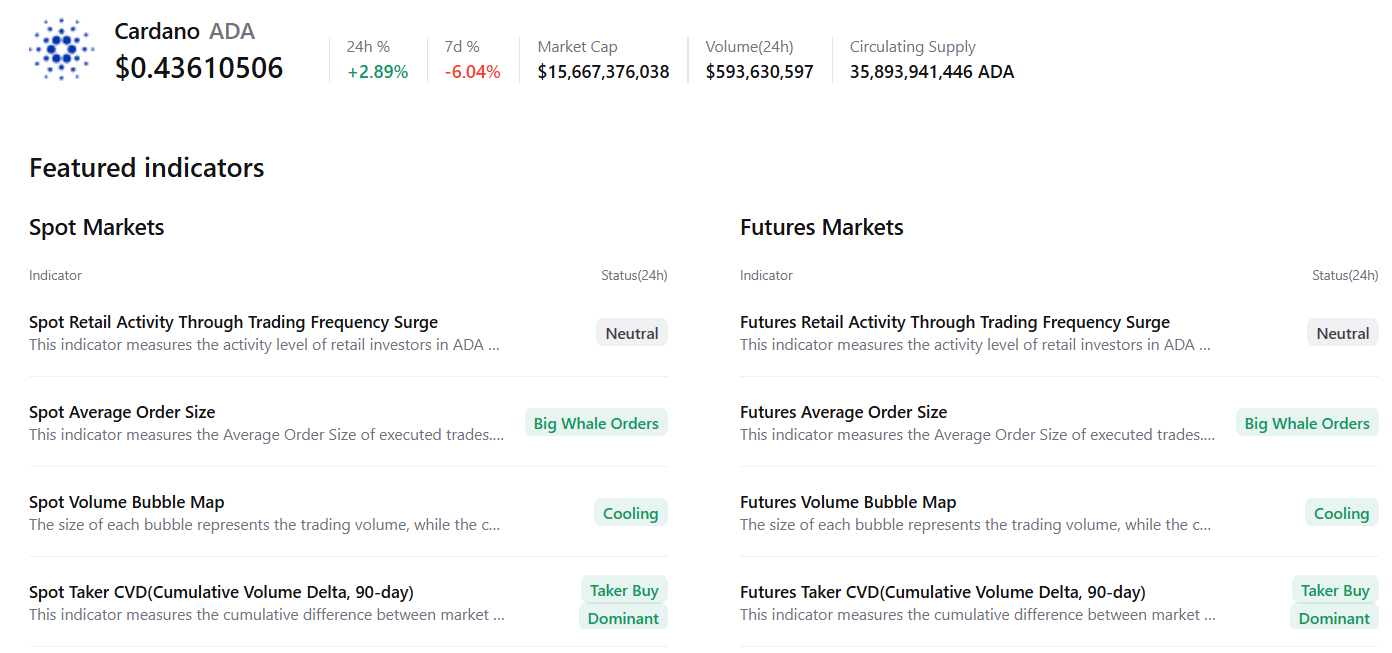
CryptoQuant’s summary data underpins the bullish outlook, as Cardano’s spot and futures markets show large whale orders, cooling conditions, and buy dominance. These factors signal a potential recovery in the upcoming days.
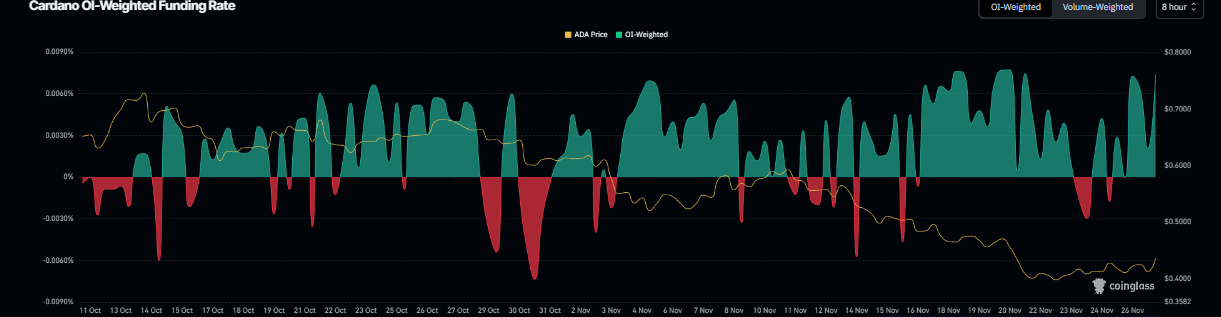
On the derivatives side, Cardano’s funding rate data also support signs of recovery. According to Coinglass’s OI-Weighted Funding Rate data, the number of traders betting that the price of ADA will slide further is lower than those anticipating a price increase.
The metric has flipped to a positive rate on Wednesday and stands at 0.0074% on Thursday, indicating that longs are paying shorts. Historically, as shown in the chart below, when the funding rates have flipped from negative to positive, Cardano’s price has rallied sharply.
Cardano Price Forecast: ADA finds support around key support zone
Cardano price retested and found support around the lower trendline of a falling wedge pattern (drawn by connecting multiple highs and lows with two trendlines) on Saturday, and recovered by 9% over the next four days. At the time of writing on Thursday, ADA hovers around $0.43.
If ADA continues its recovery, it could extend the rally toward the next daily resistance at $0.49. A successful close above this level could extend additional gains toward the next 50-day Exponential Moving Average (EMA) at $0.56.
The Relative Strength Index (RSI) on the daily chart reads 34, after slipping below the oversold threshold last week, and is currently pointing upward, suggesting that downside pressure may be moderating as bearish momentum shows early signs of exhaustion. The Moving Average Convergence Divergence (MACD) showed a bullish crossover on Thursday, providing a buy signal and further supporting the potential continuation of the recovery.
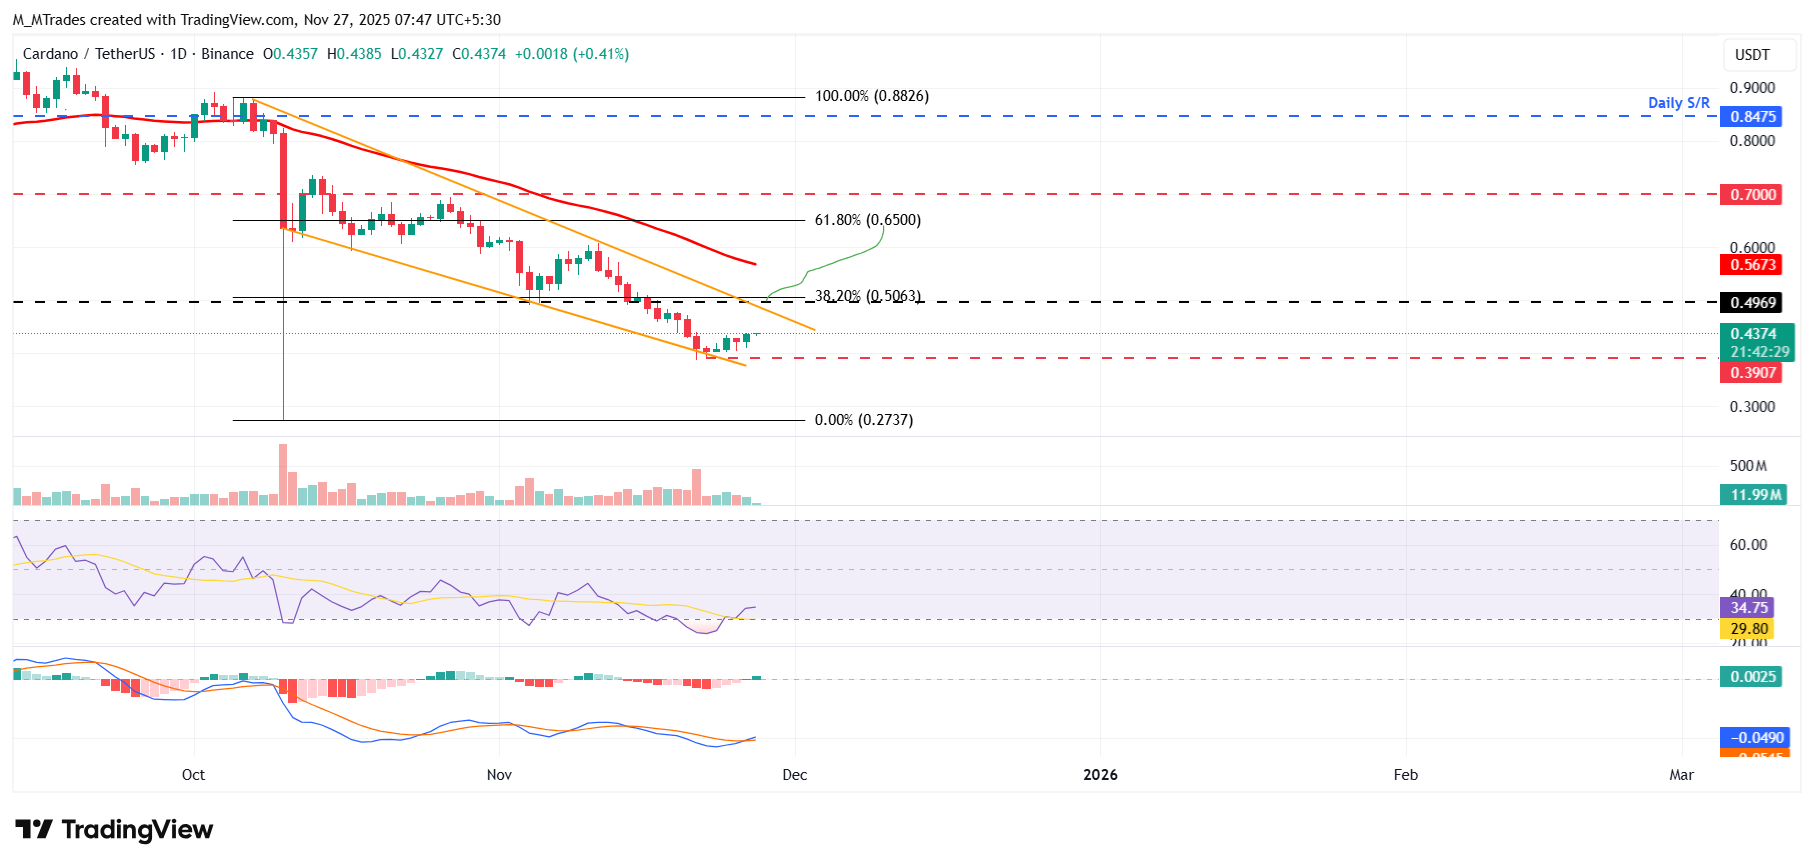
If ADA continues its decline, it could extend the drop toward the lower wedge boundary at around $0.39.

FXStreet
超过一百万用户依赖 FXStreet 获取实时市场数据、图表工具、专家洞见和外汇新闻。其全面的经济日历和教育网络研讨会帮助交易者保持信息领先、做出审慎决策。FXStreet 拥有约 60 人的团队,分布在巴塞罗那总部及全球各地区。
Read More


