
Crypto Today: Bitcoin, Ethereum and XRP extend correction as rising geopolitical tensions fade risky sentiment
作者 Manish Chhetri
发布日期: 20 Jan 2026 | 修改日期: 20 Jan 2026


热门文章

Bitcoin (BTC), Ethereum (ETH), and Ripple (XRP) prices are extending their losses on Tuesday as risk-on sentiment fades amid rising geopolitical tensions over Greenland.
- Bitcoin price extends its correction, slipping below $91,000 on Tuesday amid rising geopolitical tensions over Greenland.
- Ethereum trades in red around $3,100, slipping below the 50-day EMA and keeping downside risks intact.
- XRP is sliding below its daily support at $1.96, risking a deeper correction.
Bitcoin (BTC), Ethereum (ETH), and Ripple (XRP) prices are extending their losses on Tuesday as risk-on sentiment fades amid rising geopolitical tensions over Greenland.
US President Donald Trump posted on his Truth Social account on Tuesday that he had spoken with Mark Rutte, the Secretary General of the North Atlantic Treaty Organization (NATO), regarding Greenland. Trump explained that Greenland is “imperative for national and world security” and confirmed plans for discussions involving multiple parties at the upcoming World Economic Forum in Davos, Switzerland.
These developments further intensified uncertainty and triggered a risk-off sentiment among traders, which does not bode well for risky assets.
Chart of the day: Bitcoin momentum indicators flash early bearish signals
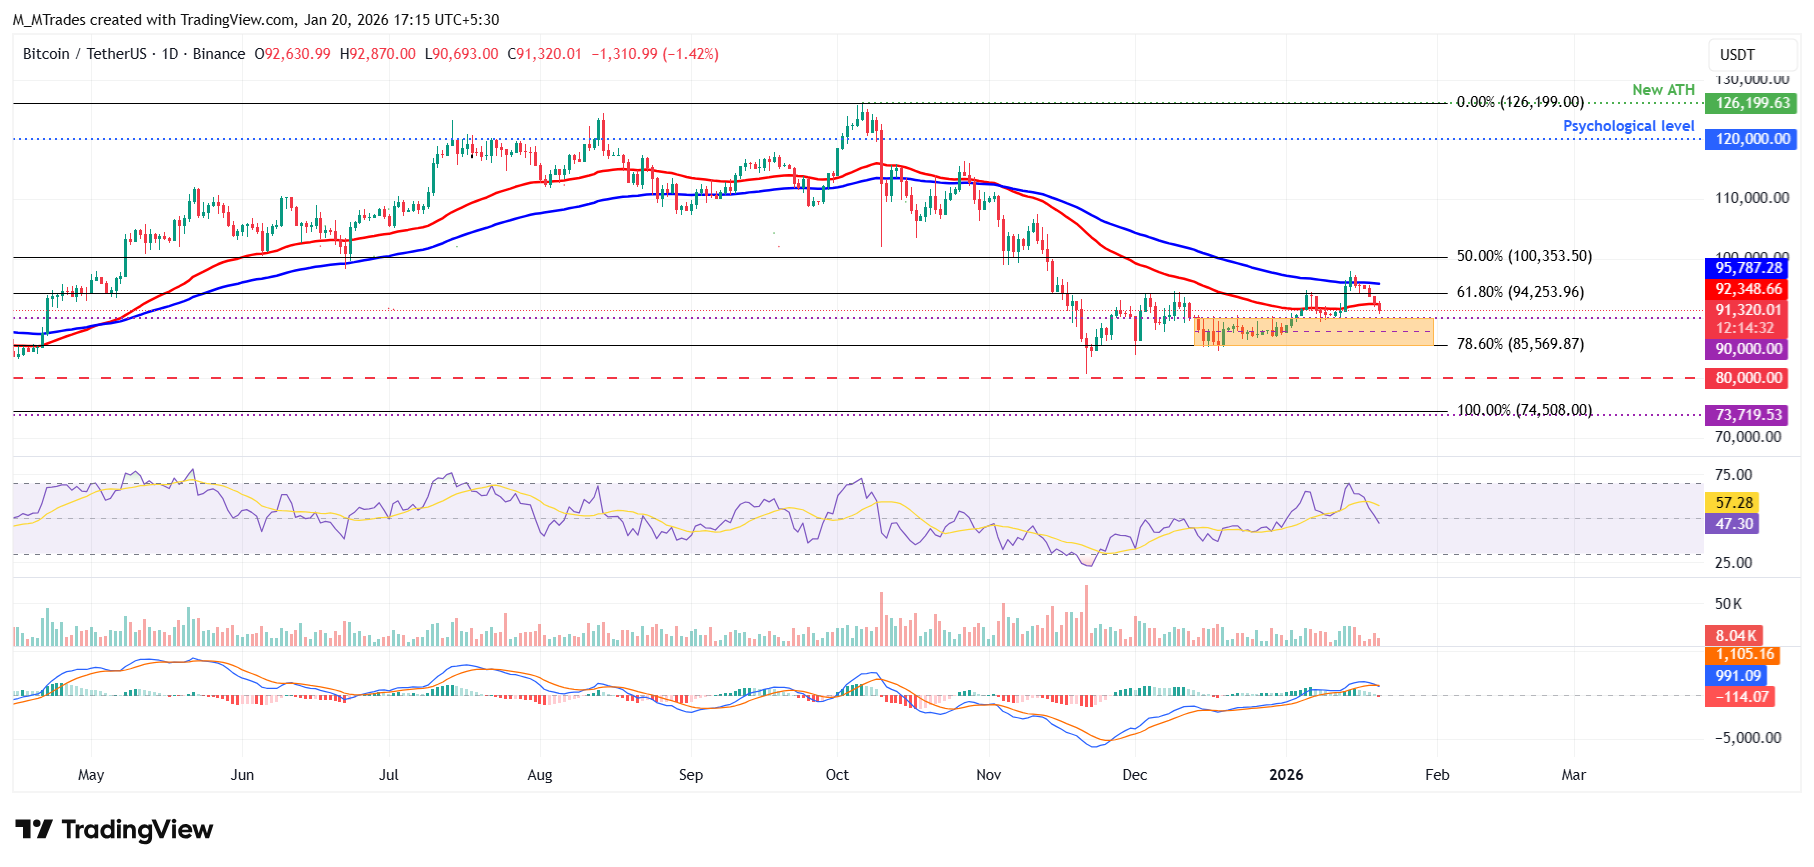
Bitcoin price failed to hold above the 100-day Exponential Moving Average (EMA) at $95,787 on Thursday and corrected by 3.35% over the next four days, retesting the 50-day Exponential Moving Average (EMA) at $92,348 on Monday. As of writing, BTC is trading down, slipping below the 50-day EMA and nearing the next immediate support at $90,000.
If BTC fails to find support around the $90,000 (previously broken upper consolidation zone), it could extend the decline toward the lower consolidation boundary at $85,569, which coincides with the 78.60% Fibonacci retracement level (from the April low of $74,508 to October’s all-time high of $126,199).
The Relative Strength Index (RSI) on the daily chart is 47, slipping below the neutral 50 level, indicating bearish momentum is gaining traction. The Moving Average Convergence Divergence (MACD) indicator also showed a bearish crossover on Tuesday, further supporting the downward view.
On the other side, if BTC recovers, it could extend the advance toward the 61.8% Fibonacci retracement level at $94,253.
Altcoins update: Ethereum and XRP bears are in control of momentum
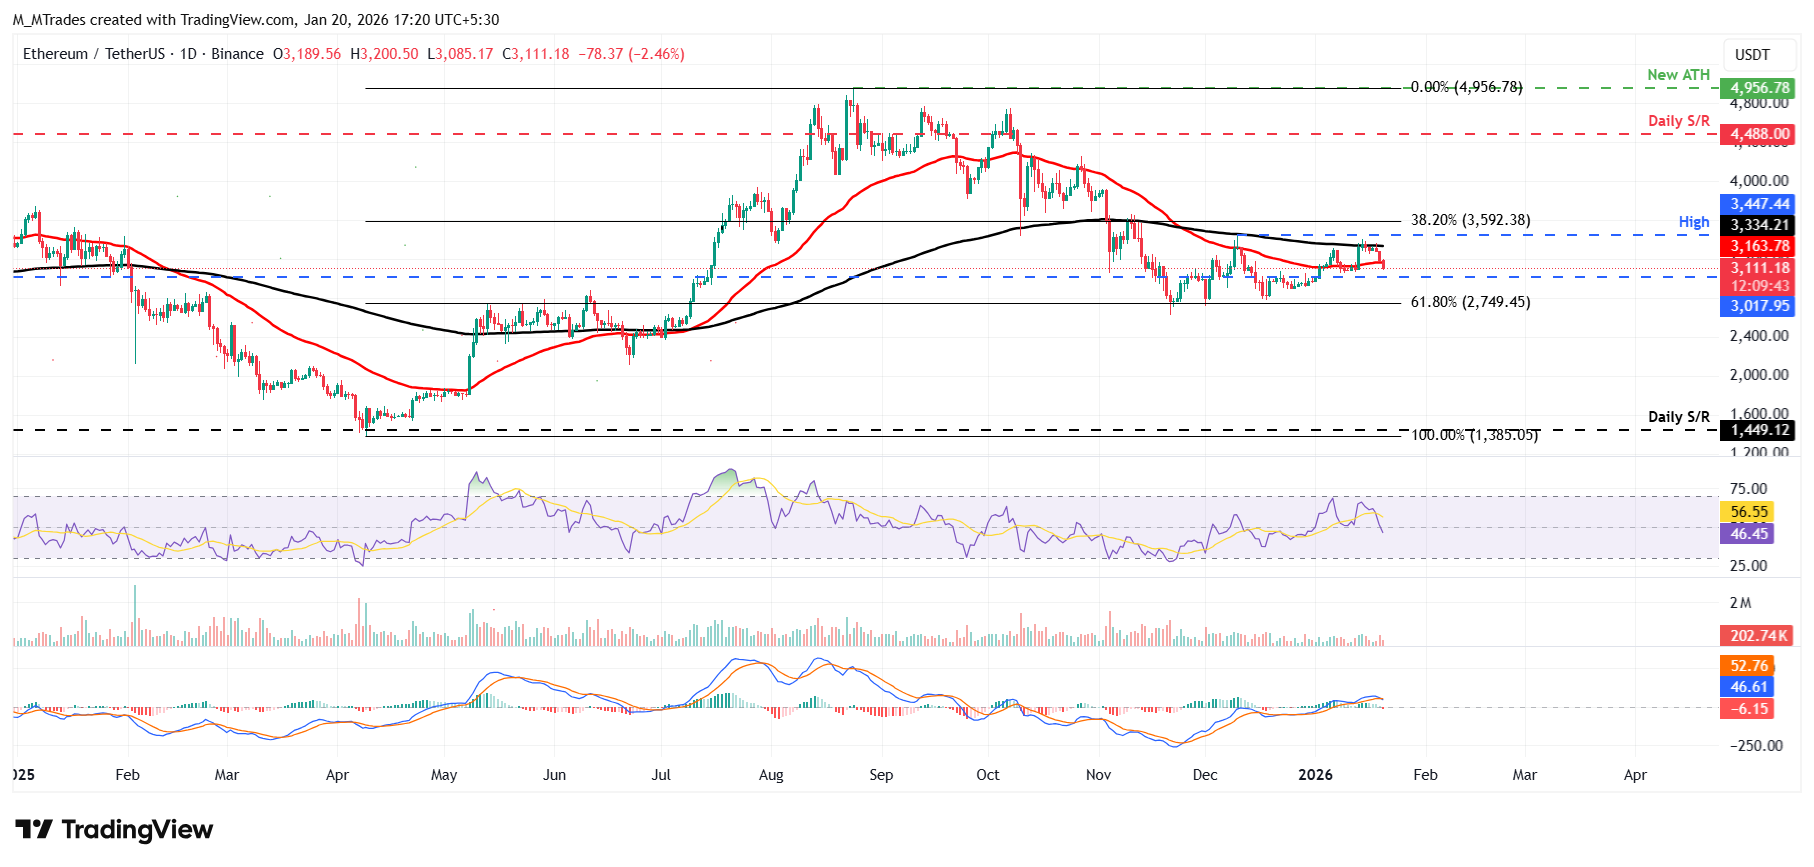
Ethereum price was rejected from the 200-day EMA at $3,334 on Thursday and declined nearly 5% through Monday, retesting the 50-day EMA at $3,163. At the time of writing, ETH is trading down, slipping below the 50-day EMA.
If ETH closes below the 50-day EMA at $3,163 on a daily basis, it could extend the decline toward the daily support at $3,017.
The RSI on the daily chart reads 46, slipping below the neutral 50 level, indicating bearish momentum is gaining traction. The MACD indicator also flagged a sell signal on Tuesday, further supporting the bearish view.
On the other hand, if ETH recovers, it could extend the advance toward the 200-day EMA at $3,334.
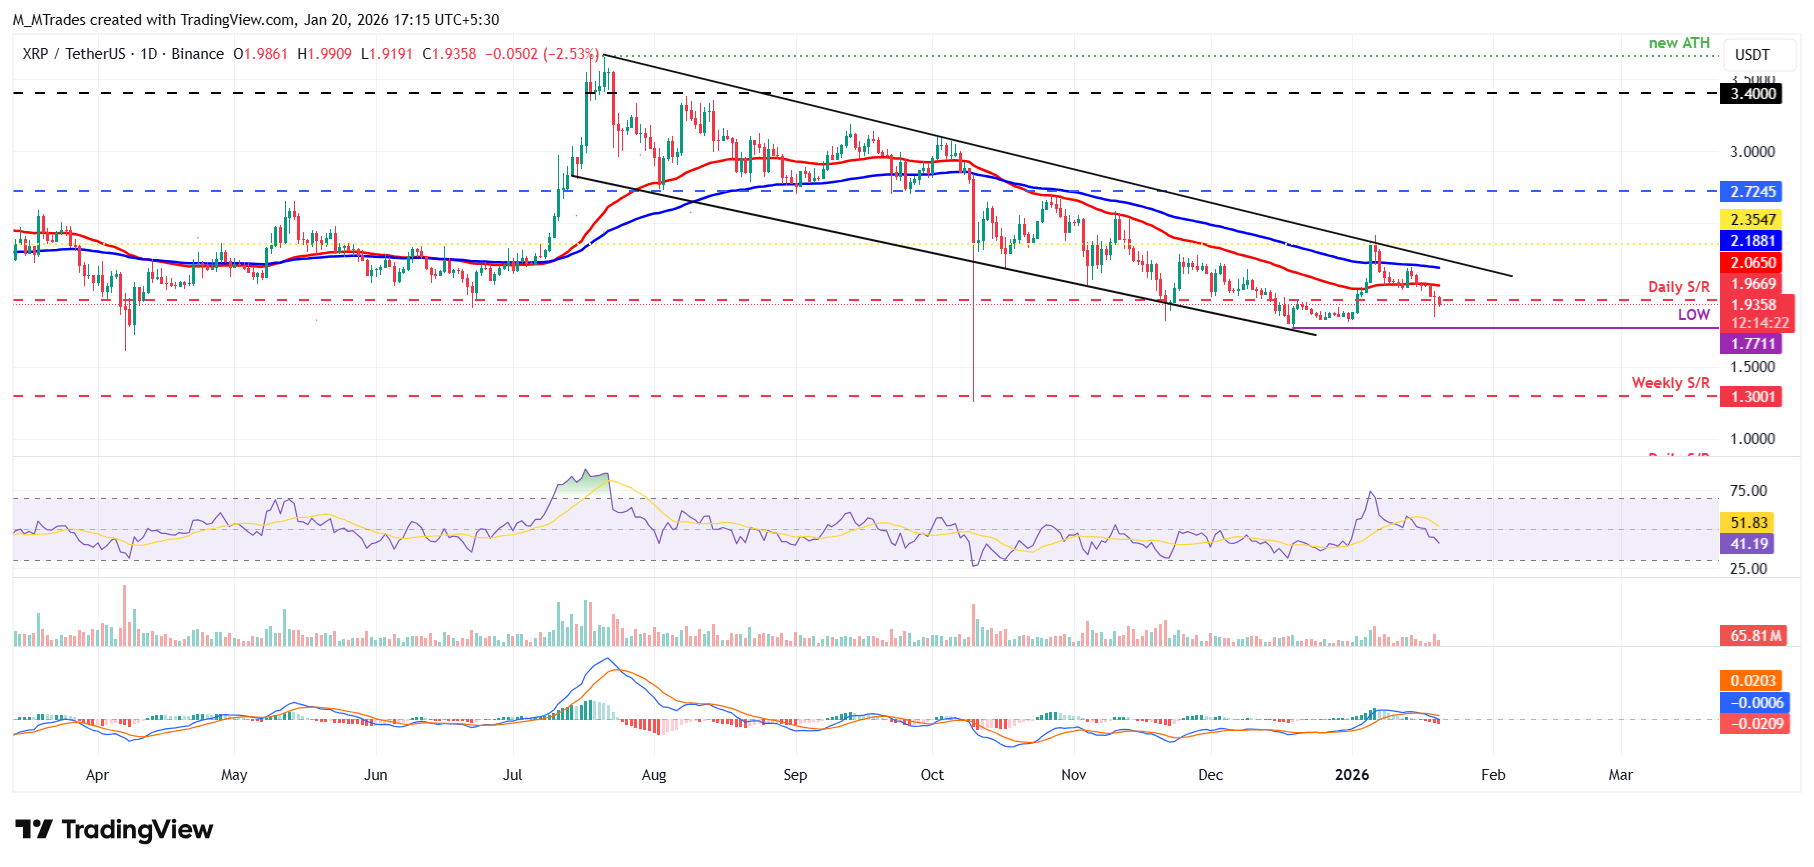
XRP price faced rejection from the 50-day EMA at $2.06 on Friday and kept declining the following days. At the present time, XRP is trading below the daily support at $1.96.
If XRP continues its correction and closes below the daily support at $1.96, it could extend the decline toward the December 19 low of $1.77.
The RSI on the daily chart reads 41, below the neutral level of 50, indicating bearish momentum gaining traction. The MACD also showed a bearish crossover on Friday, further supporting the negative outlook.
However, if XRP recovers, it could extend the advance toward the 50-day EMA at $2.06.
Cryptocurrency metrics FAQs
The developer or creator of each cryptocurrency decides on the total number of tokens that can be minted or issued. Only a certain number of these assets can be minted by mining, staking or other mechanisms. This is defined by the algorithm of the underlying blockchain technology. On the other hand, circulating supply can also be decreased via actions such as burning tokens, or mistakenly sending assets to addresses of other incompatible blockchains.
Market capitalization is the result of multiplying the circulating supply of a certain asset by the asset’s current market value.
Trading volume refers to the total number of tokens for a specific asset that has been transacted or exchanged between buyers and sellers within set trading hours, for example, 24 hours. It is used to gauge market sentiment, this metric combines all volumes on centralized exchanges and decentralized exchanges. Increasing trading volume often denotes the demand for a certain asset as more people are buying and selling the cryptocurrency.
Funding rates are a concept designed to encourage traders to take positions and ensure perpetual contract prices match spot markets. It defines a mechanism by exchanges to ensure that future prices and index prices periodic payments regularly converge. When the funding rate is positive, the price of the perpetual contract is higher than the mark price. This means traders who are bullish and have opened long positions pay traders who are in short positions. On the other hand, a negative funding rate means perpetual prices are below the mark price, and hence traders with short positions pay traders who have opened long positions.

超过一百万用户依赖 FXStreet 获取实时市场数据、图表工具、专家洞见和外汇新闻。其全面的经济日历和教育网络研讨会帮助交易者保持信息领先、做出审慎决策。FXStreet 拥有约 60 人的团队,分布在巴塞罗那总部及全球各地区。
阅读更多


