
Crypto Today: Bitcoin, Ethereum, XRP hold support amid waning retail demand
作者 John Isige
发布日期: 16 Jan 2026 | 修改日期: 16 Jan 2026


热门文章

Bitcoin (BTC) holds above support at $95,000 at the time of writing on Friday, after retracing from its recent high of $97,924 amid profit-taking and emerging regulatory headwinds in the United States (US).
- Bitcoin slips but holds above $95,000, weighed down by declining retail demand.
- Ethereum trades narrowly between the 100-day EMA support and the 200-day EMA resistance.
- XRP edges lower for the third consecutive day, driven by a persistently weakening derivatives market.
Bitcoin (BTC) holds above support at $95,000 at the time of writing on Friday, after retracing from its recent high of $97,924 amid profit-taking and emerging regulatory headwinds in the United States (US).
Ethereum (ETH) also holds above $3,300 support amid low retail demand. Meanwhile, Ripple (XRP) marks the third consecutive day of declines, weighed down by weakening technical and derivatives market structures.
Bitcoin, Ethereum, XRP struggle as retail demand falters
Bitcoin has had one of its strongest weeks in recent months, rising to a high of $97,924 on Wednesday. However, the uptrend, driven by optimism over softer-than-expected US core inflation, took a breather, forcing BTC to seek support around $95,000.
Despite steady institutional demand through spot Exchange Traded Funds (ETFs), which reached a cumulative weekly inflow of $1.81 billion on Thursday, retail interest continues to fall.
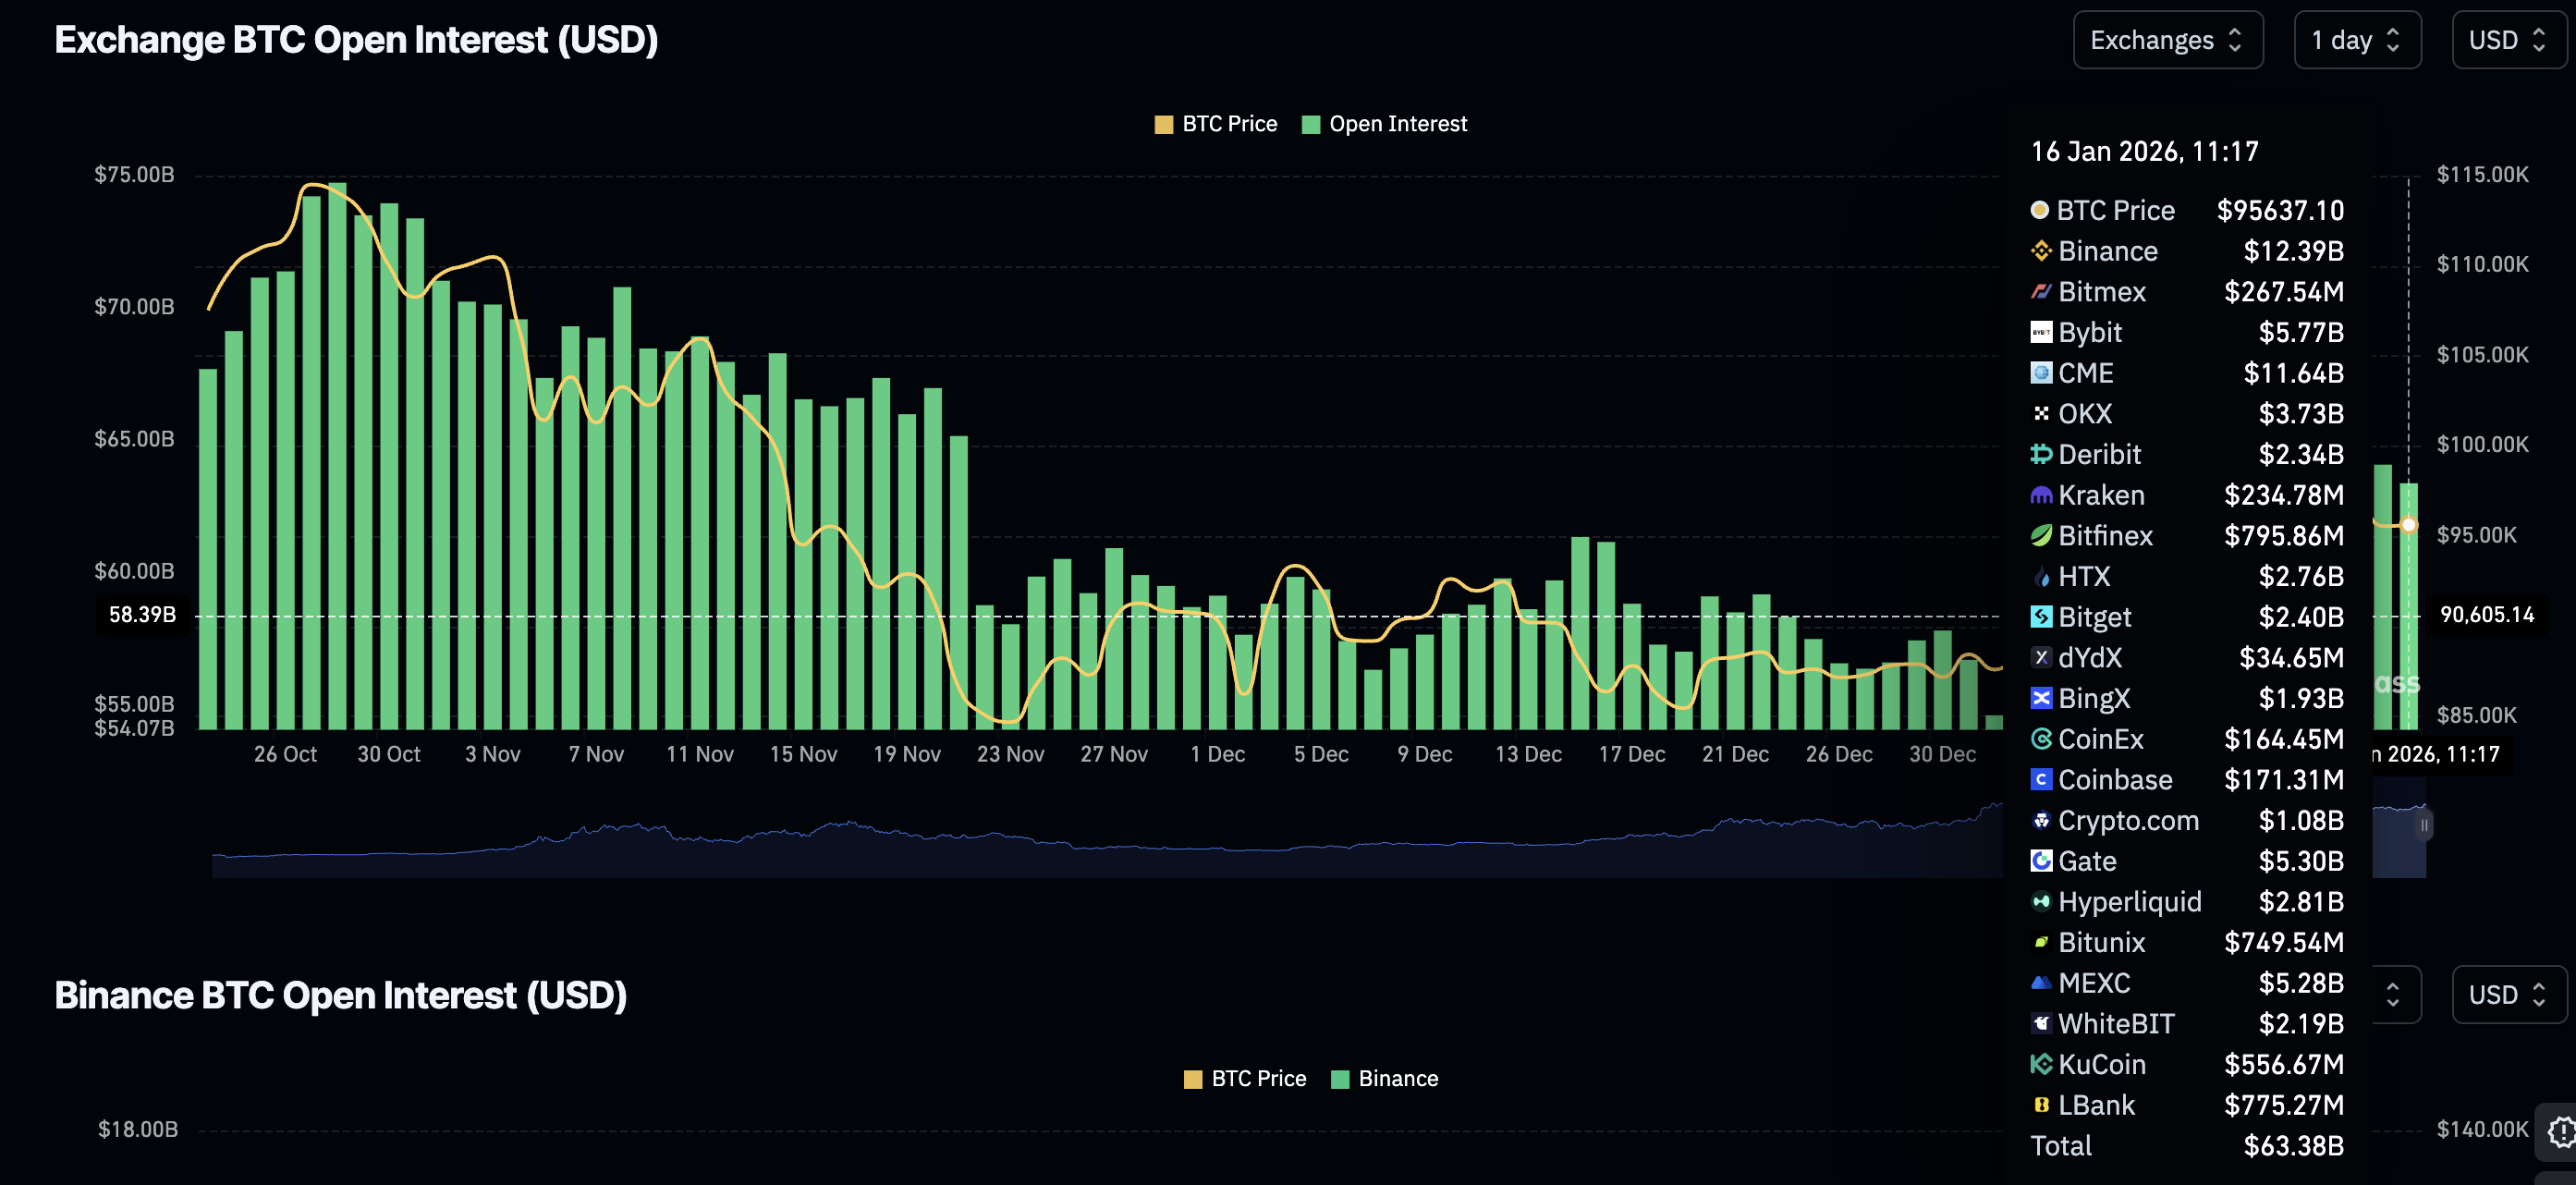
CoinGlass data shows the Bitcoin exchange Open Interest (OI) averaging $63 billion on Friday, down from $64 billion on Thursday and $66 billion on Wednesday. This persistent decline suggests investors are losing confidence in BTC’s short-term bullish outlook, potentially weakening the tailwind needed to propel prices higher.
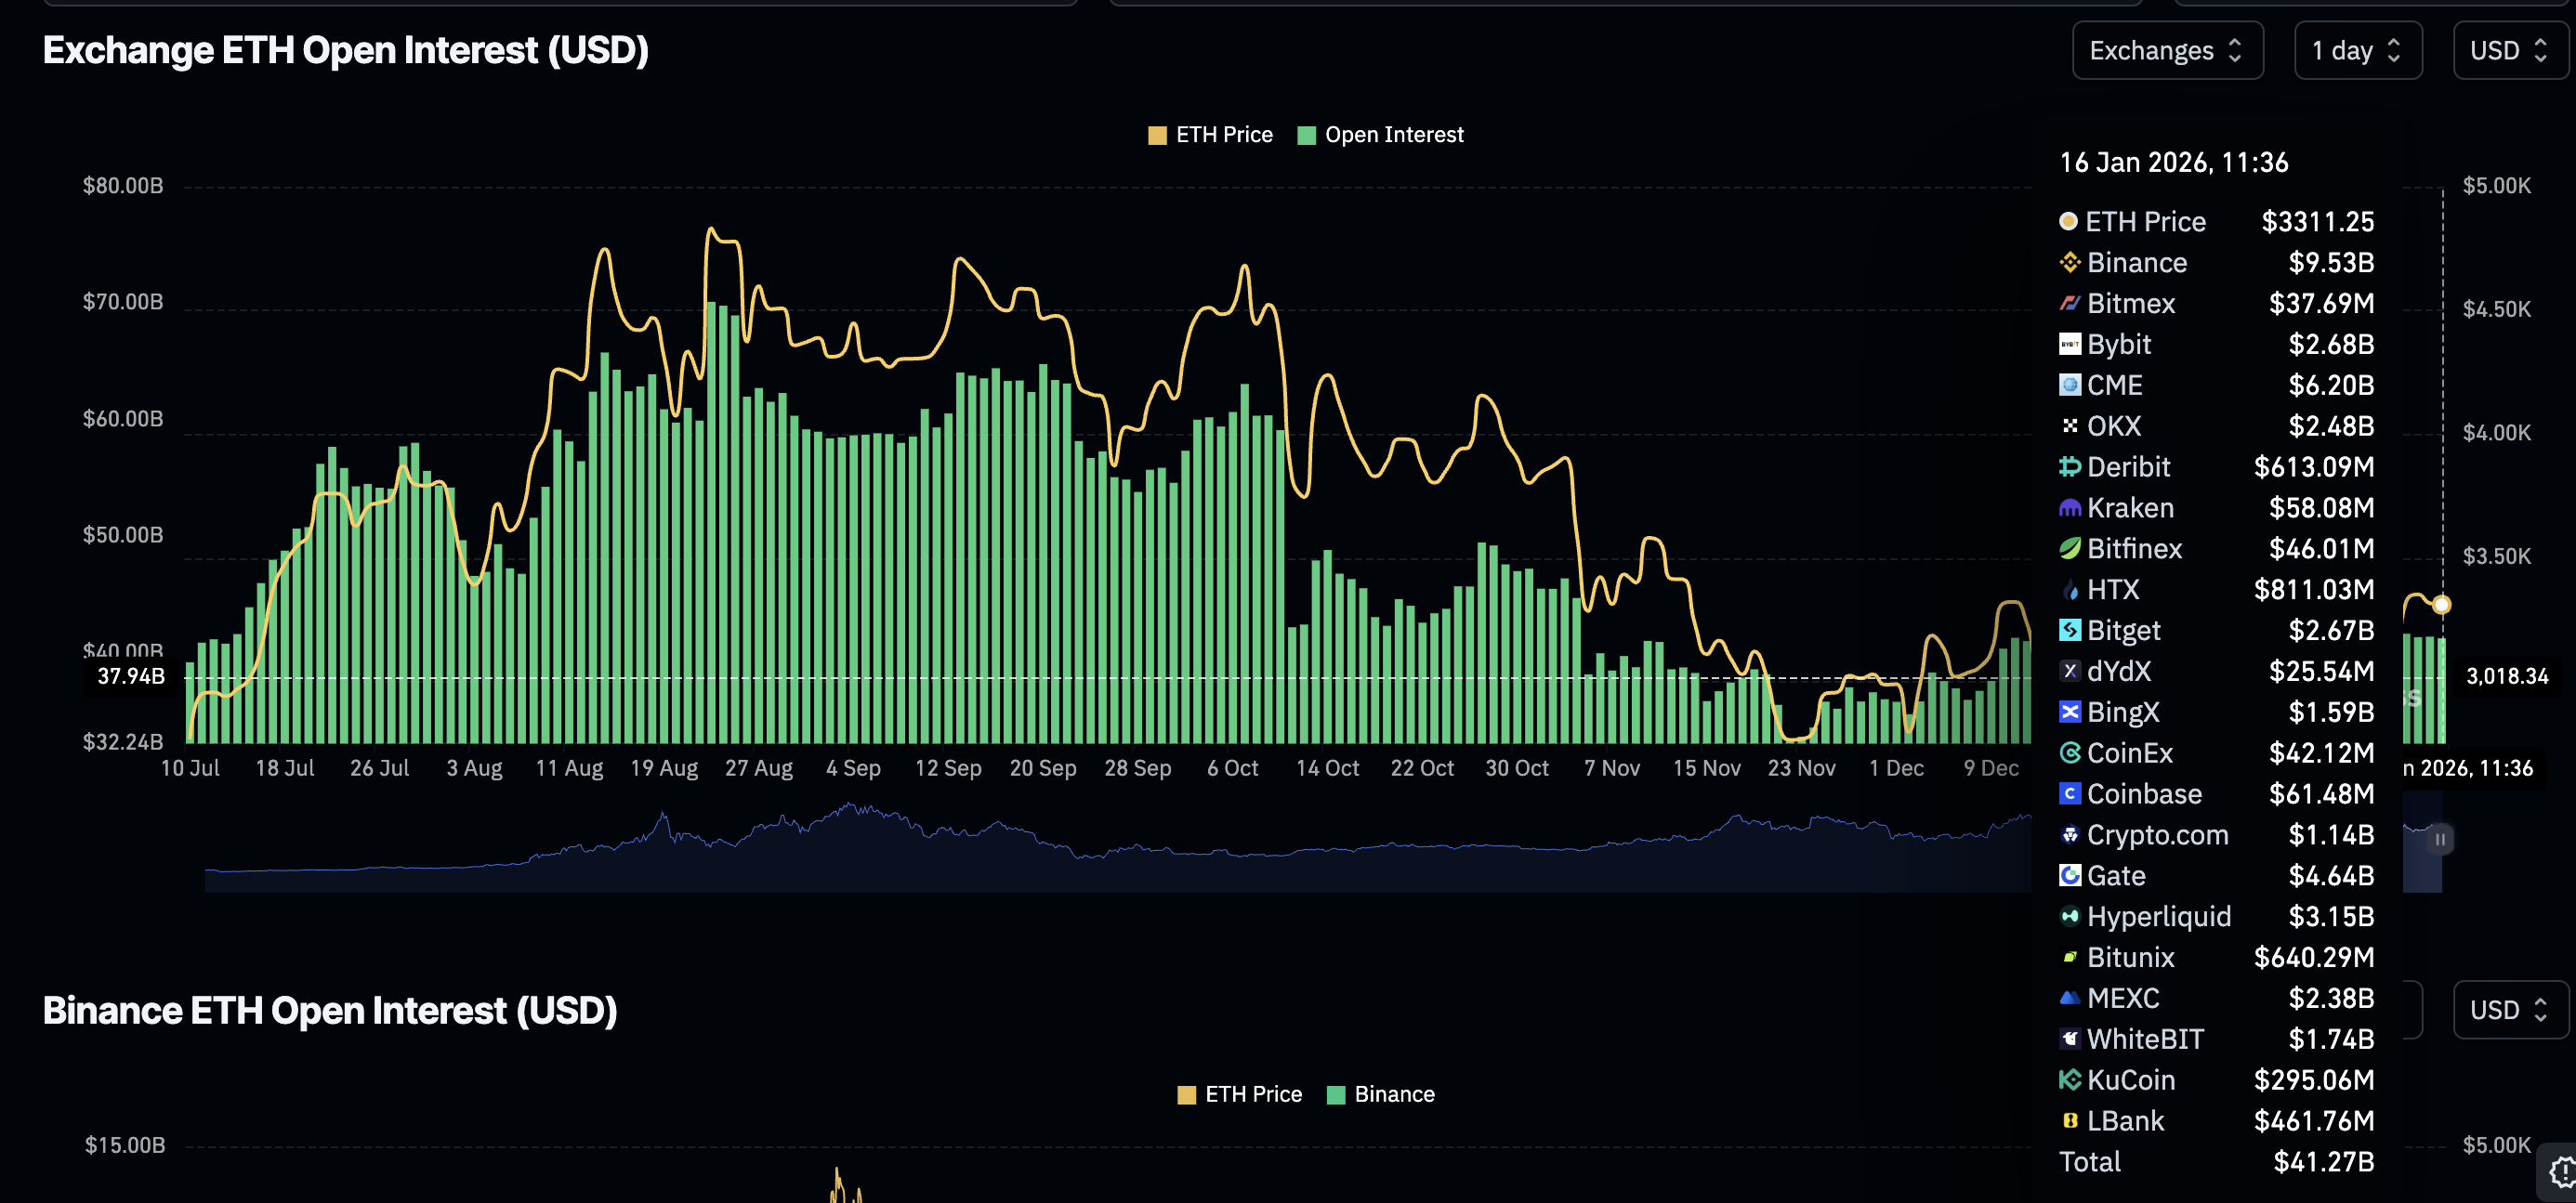
Ethereum is similarly facing an ongoing slump in demand for futures on exchanges, as reflected in OI, which represents the notional value of outstanding futures contracts. The OI averages $41.27 billion on Friday, down from $41.41 billion on Thursday.
Meanwhile, the demand for XRP derivatives has persistently cooled, falling to $3.94 billion on Friday from $3.98 billion the previous day. The OI peaked at a yearly high of $4.55 billion on January 8, a move that coincided with XRP rising to $2.42. Further decline in the OI could drive the prices lower.
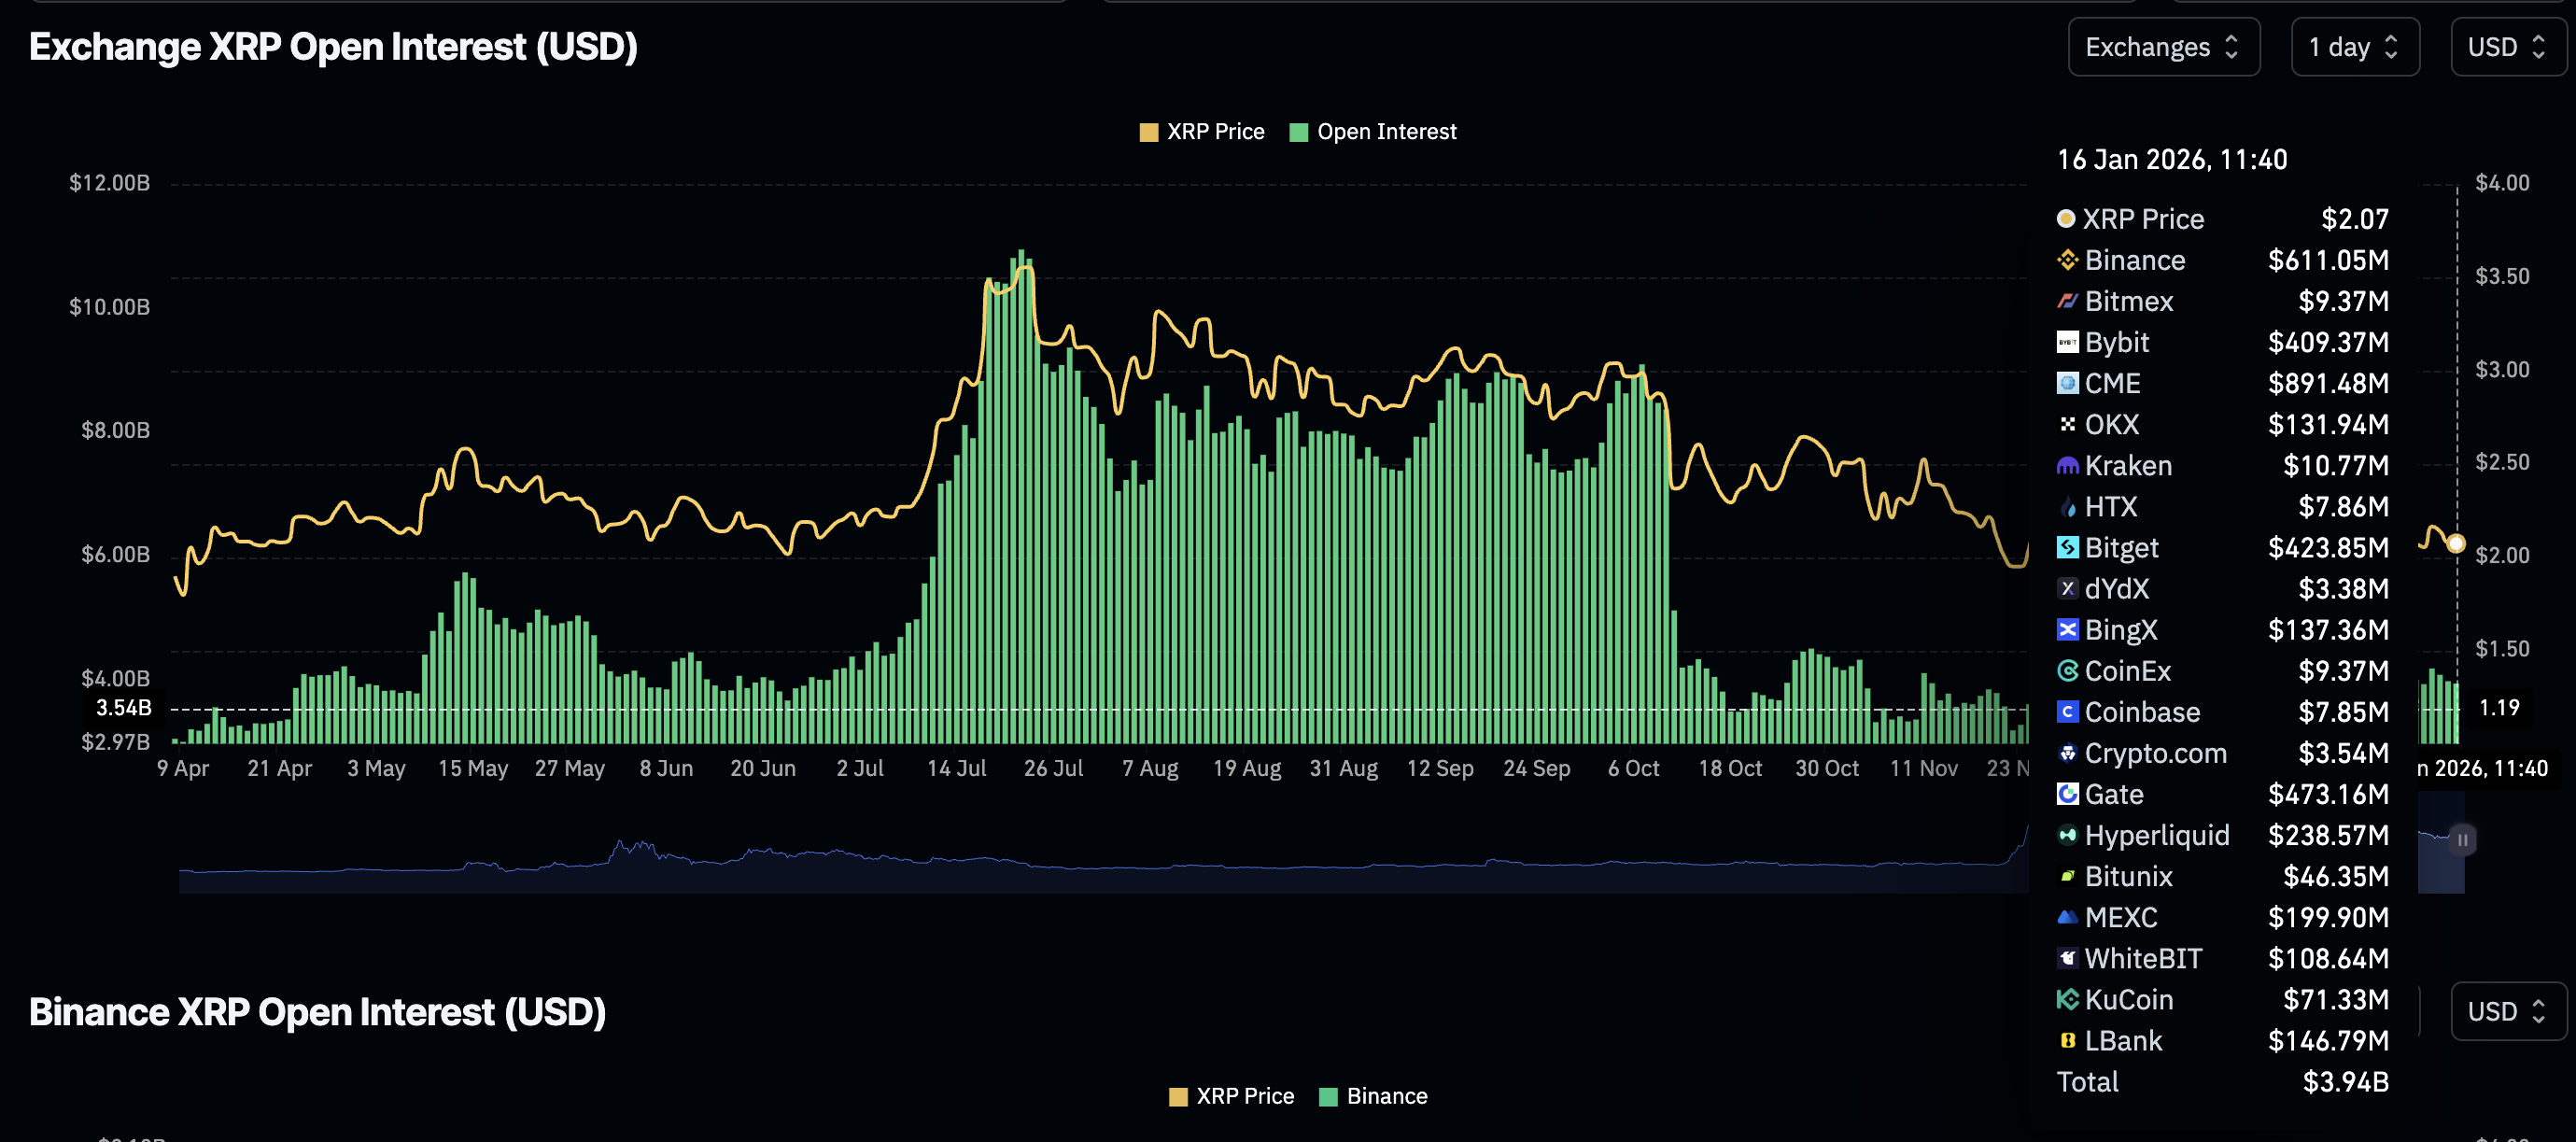
Chart of the day: Bitcoin trades under pressure
Bitcoin is trading above support at $95,000 at the time of writing on Friday, but remains below the 100-day Exponential Moving Average (EMA), which caps the upside at $96,009.
The Relative Strength Index (RSI) has stabilised at 64 on the daily chart, indicating that BTC is stable but lacks the momentum to break the 100-day EMA. Closing above this moving average would boost the short-term bullish outlook and increase the odds of a breakout toward the 200-day EMA at $99,521.
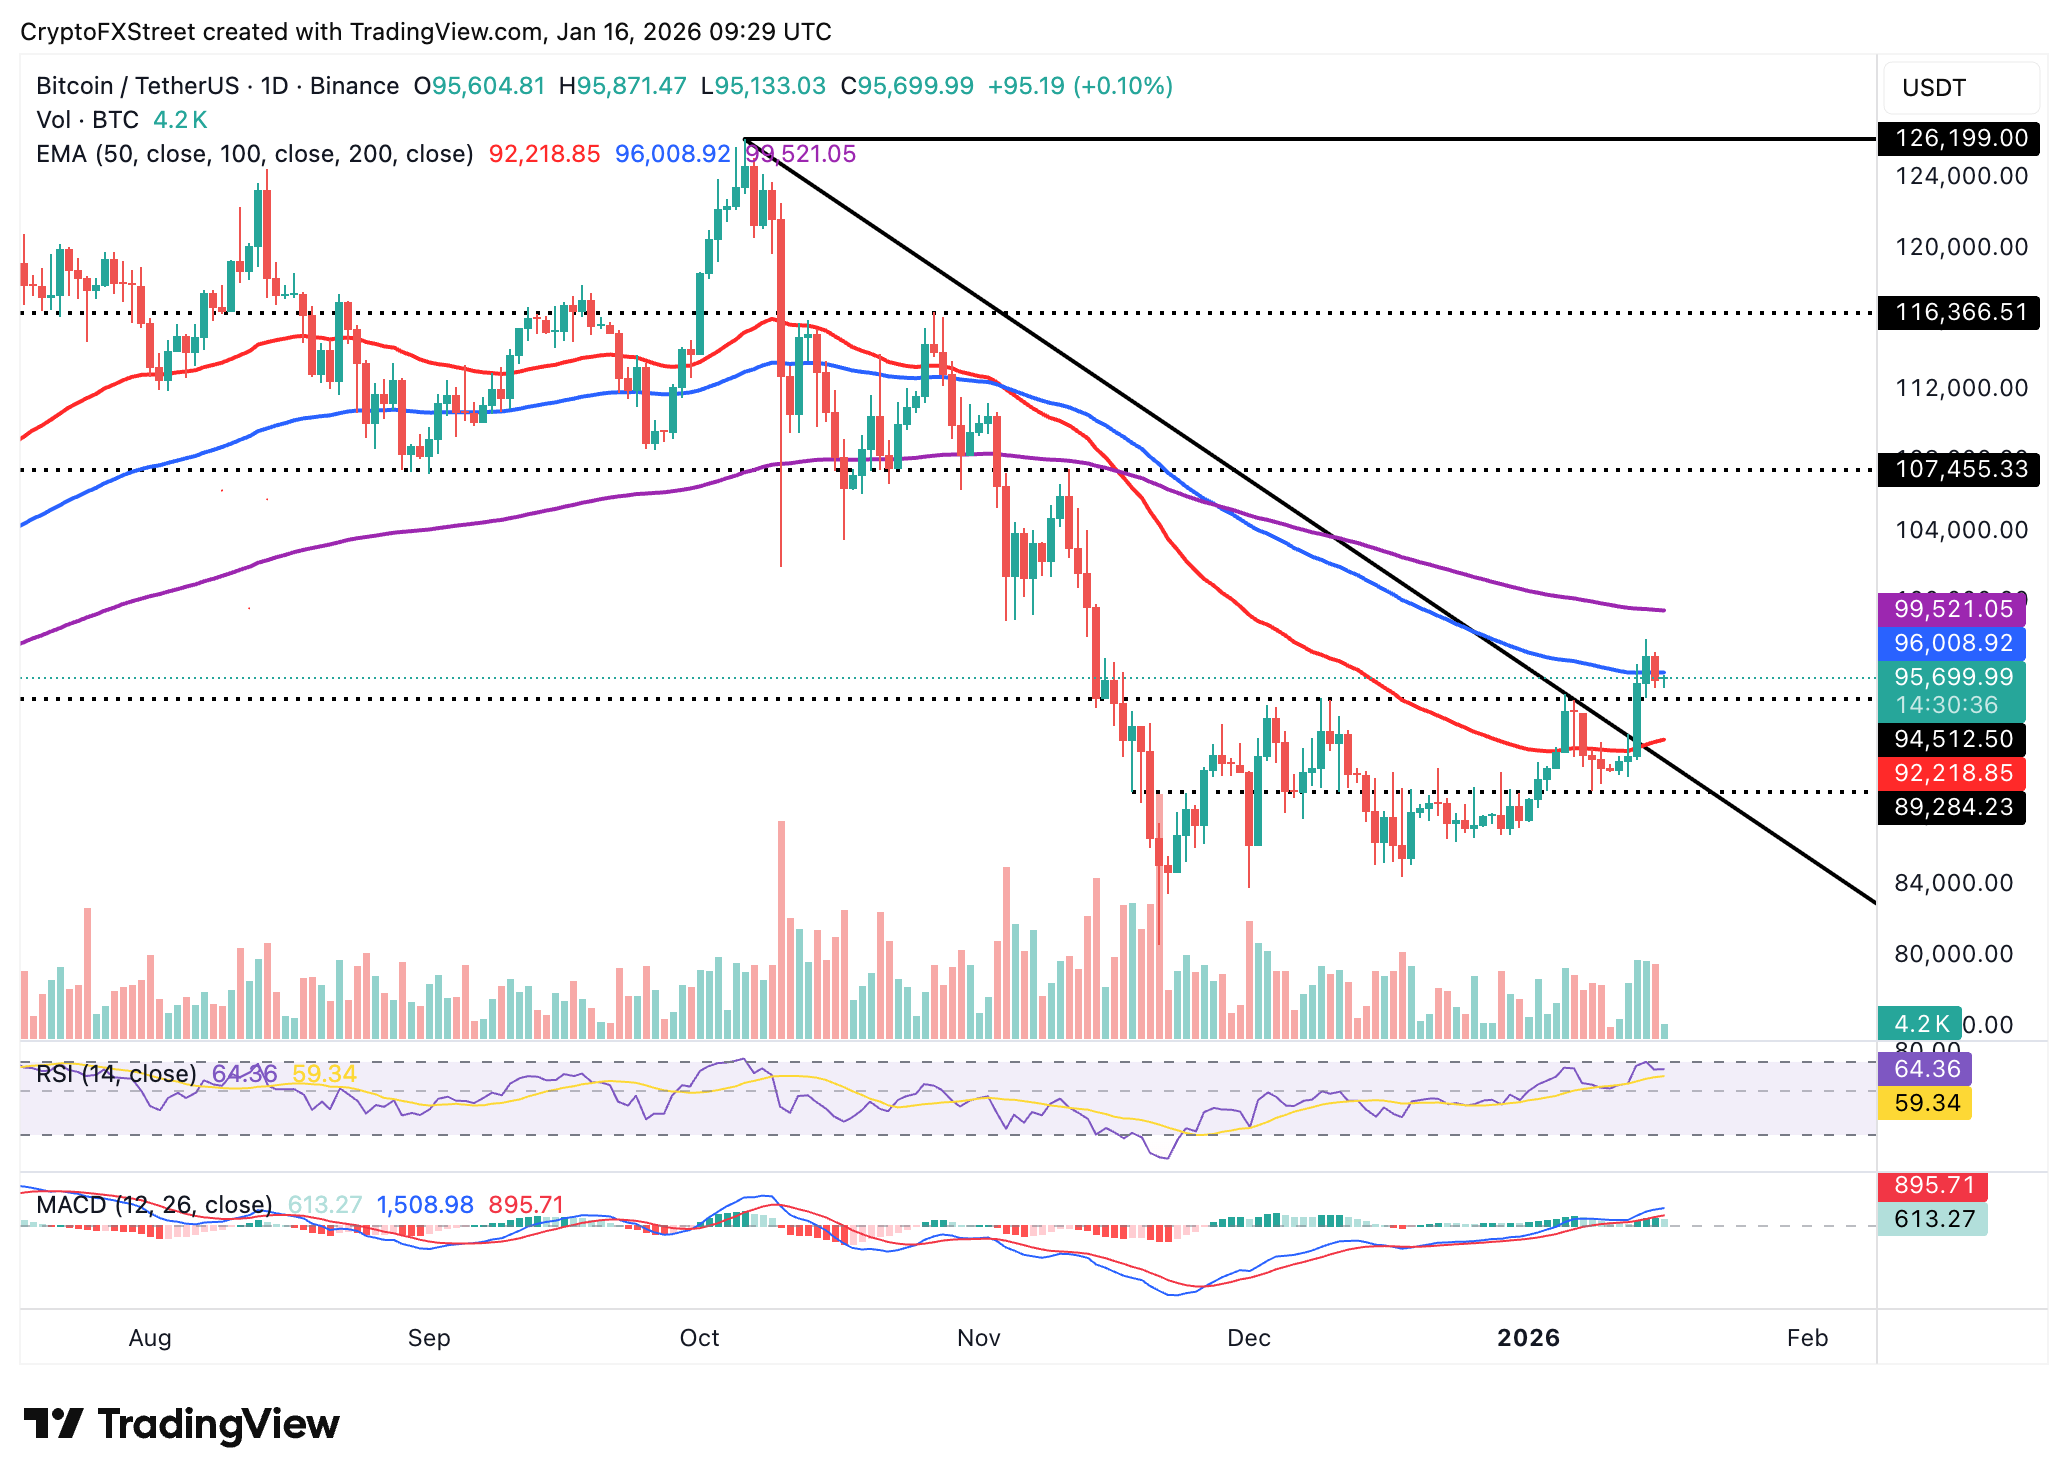
The Moving Average Convergence Divergence (MACD) indicator on the same chart remains above its signal line, reinforcing BTC’s short-term bullish thesis. The histogram bars should keep expanding above the zero line to encourage traders to increase their risk exposure.
Still, a close below the 100-day EMA and the immediate support at $95,000 may trigger an extended sell-off amid profit-taking. The 50-day EMA is poised to absorb the potential selling pressure at $92,219.
Altcoins technical outlook: Ethereum, XRP slide as bearish grip tightens
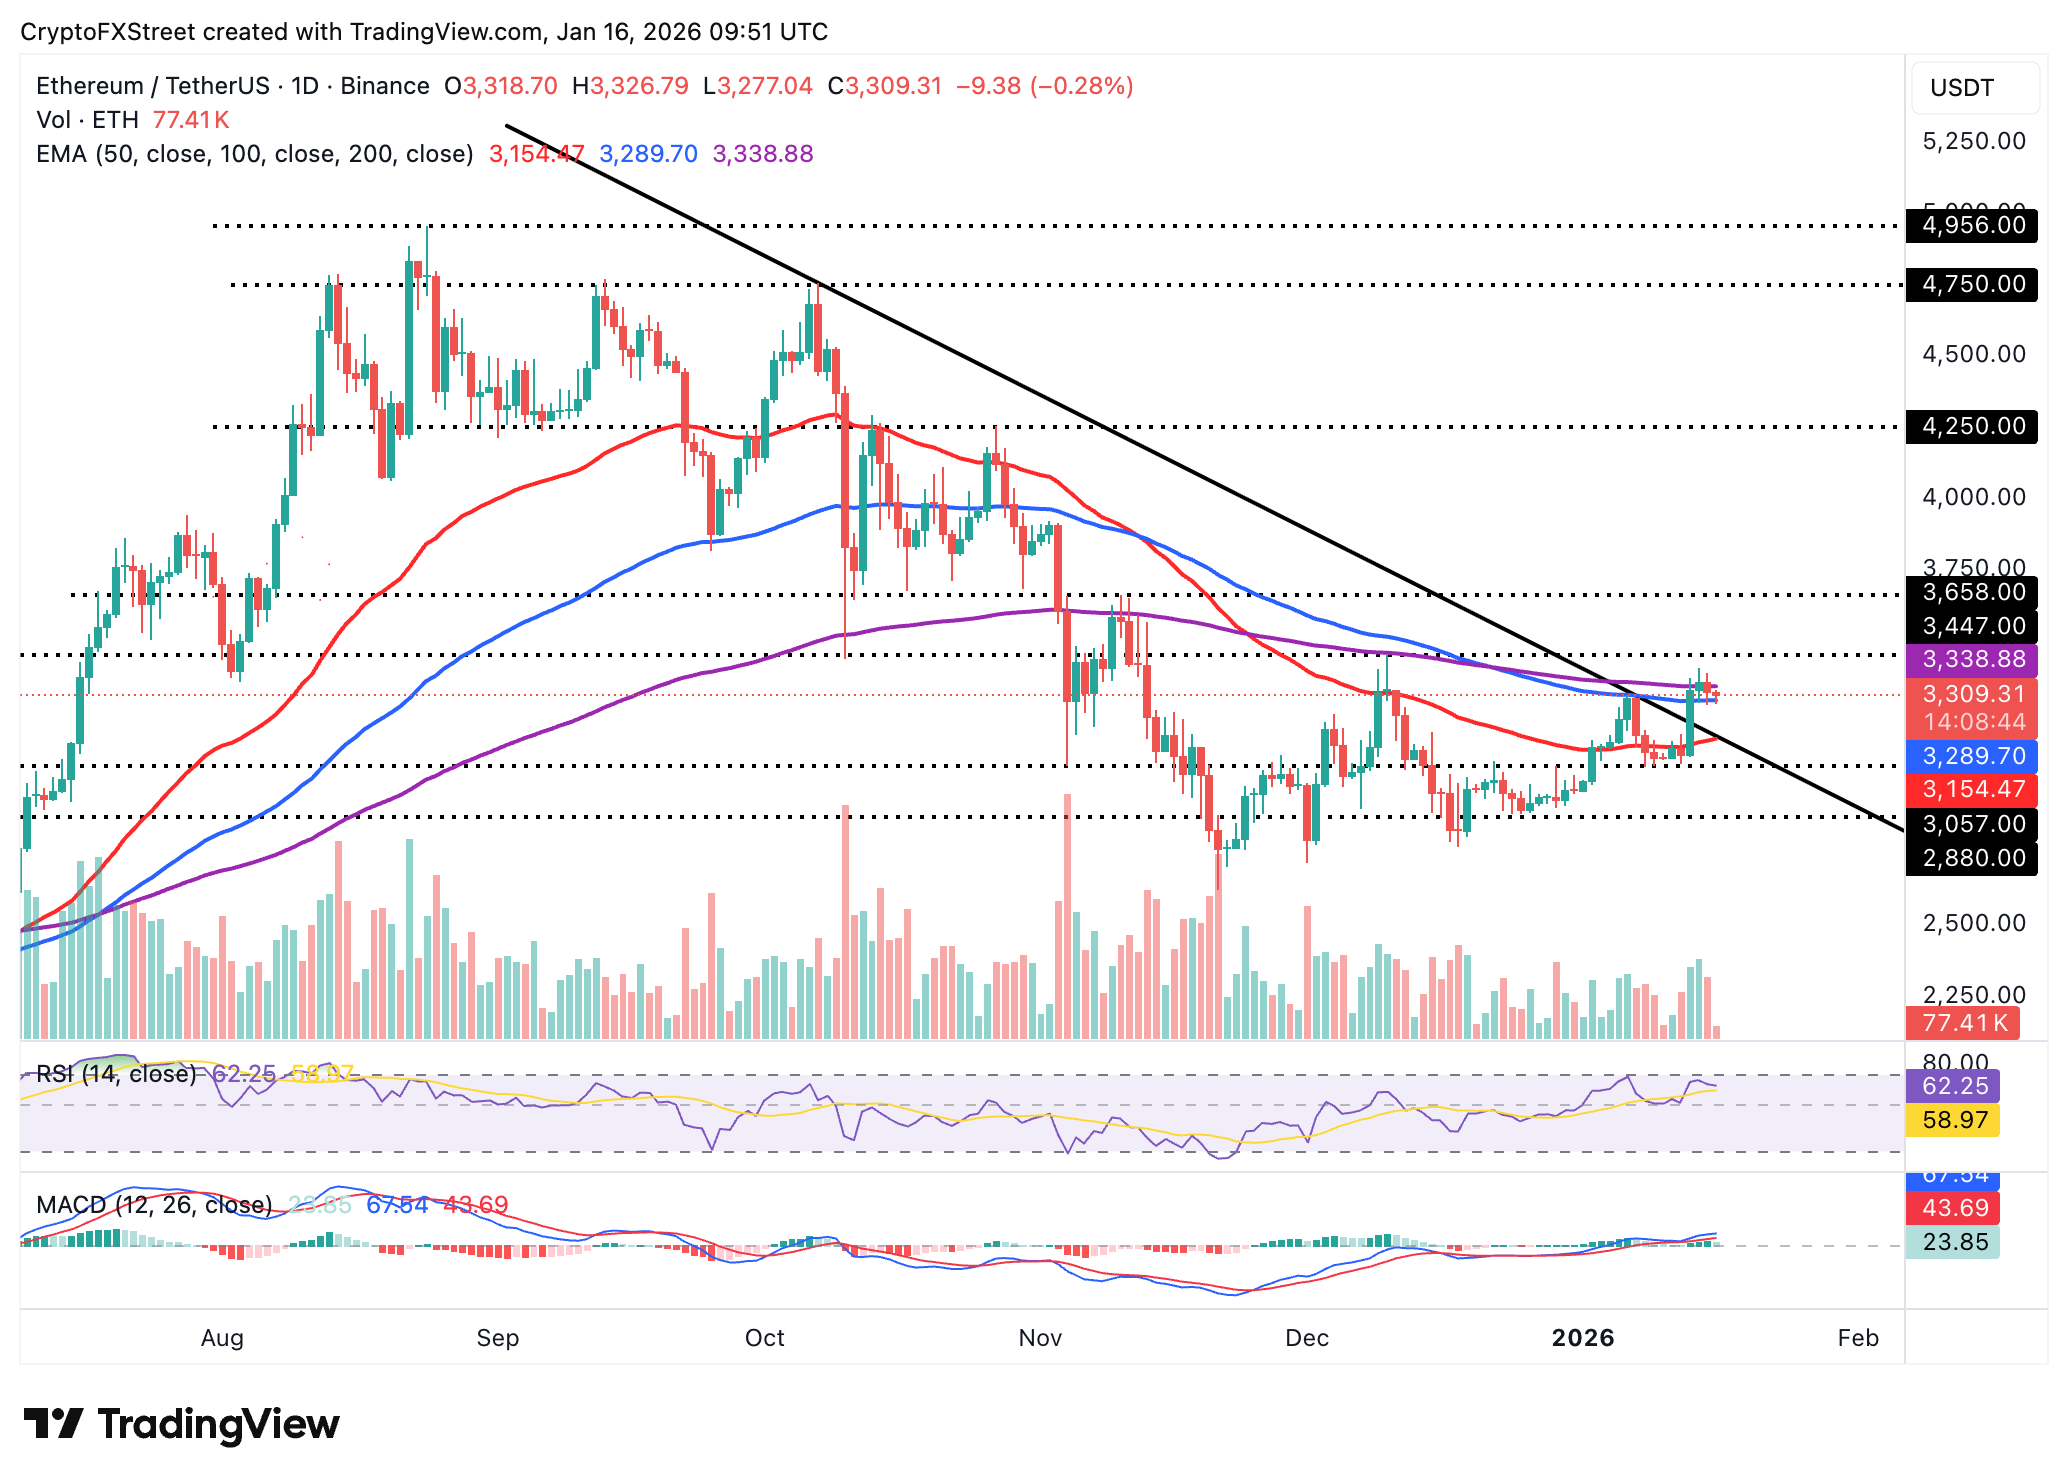
Ethereum holds between the 100-day EMA support at $3,290 and the 200-day EMA resistance at $3,339. Sellers are largely in control, as evidenced by the RSI sliding to 62 and stabilising at that level.
Closing below the 100-day EMA support could accelerate losses toward the 50-day EMA support at $3,154. The descending trendline from the record high of $4,956 is also poised to absorb the increase in supply.
Still, the MACD indicator on the same chart highlights a buy signal that has been maintained since January 1. The histogram bars should expand above the zero line to affirm ETH’s short-term bullish outlook. A break above the 200-day EMA resistance paves the way for an extended uptrend toward $3,447, tested December 10 and $3,658, tested on November 10.
As for XRP, its price is trading lower below the 50-day EMA, curving out a resistance at $2.08 at the time of writing on Friday. The RSI has declined to 51 on the daily chart, indicating that bullish momentum is fading and driving prices down.
An extended drop in the RSI below the midline would suggest the overall outlook has shifted from bullish to bearish, potentially accelerating losses below the pivotal $2.00 level. XRP could target the January low of $1.82 and April’s low of $1.61.
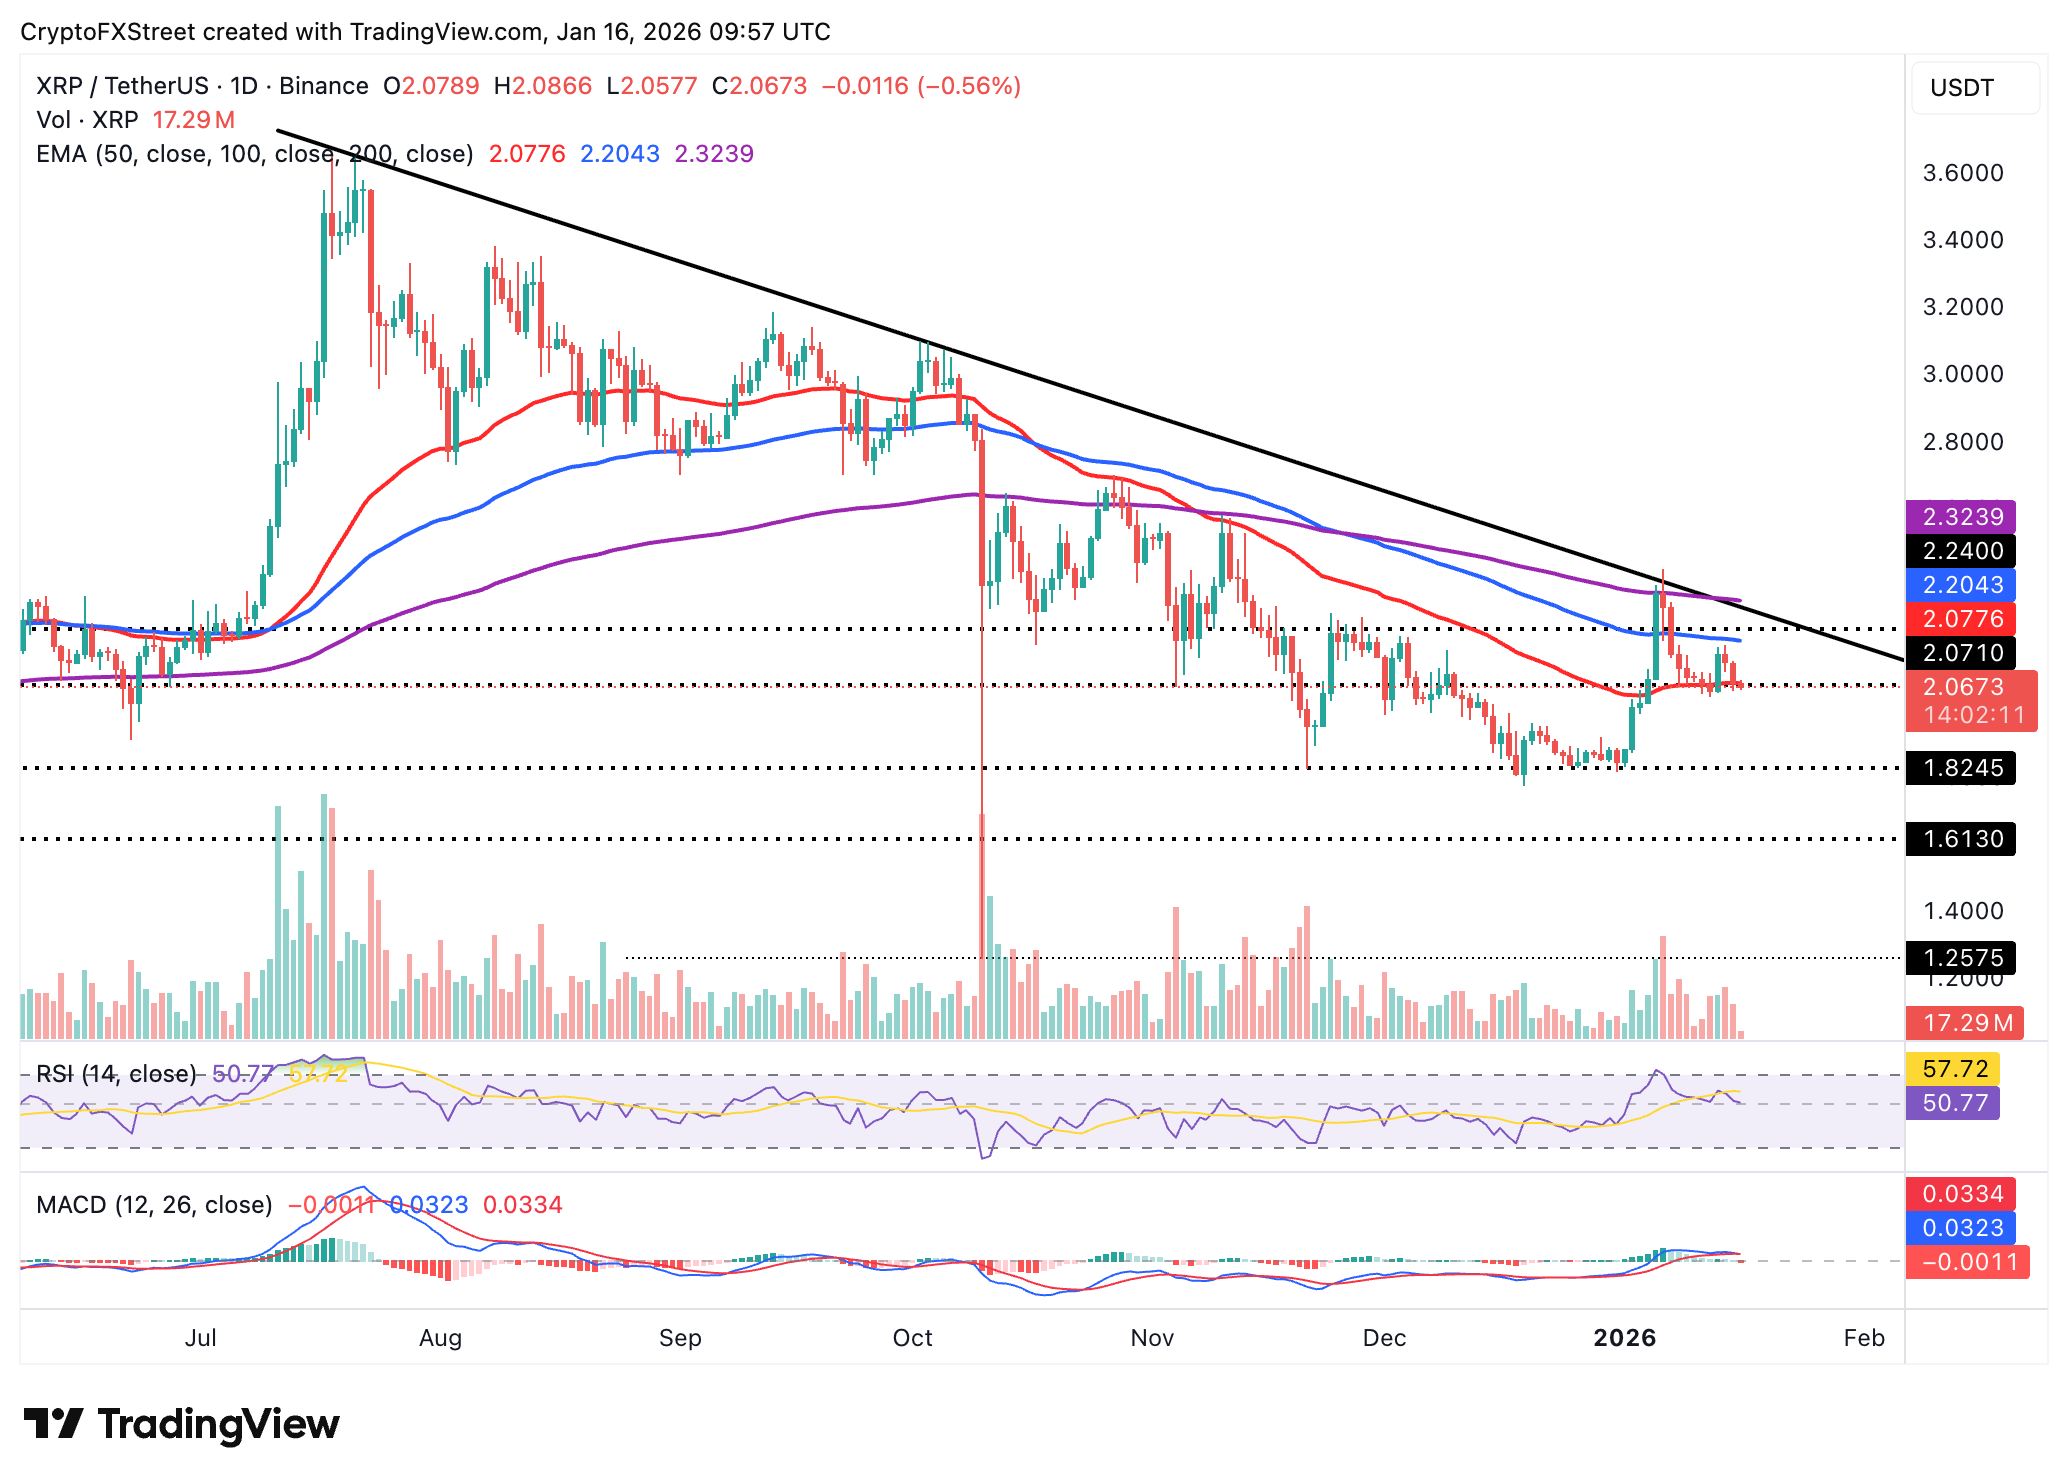
The MACD indicator holds slightly below the signal line, which may encourage risk-averse sentiment and an accelerated decline.
Still, a decisive break above the 50-day EMA at $2.08 is needed to validate XRP’s short-term bullish turnaround. Traders will anticipate more resistance at the 100-day EMA ($2.20), the descending trendline and the 200-day EMA at $2.32.
Open Interest, funding rate FAQs
Higher Open Interest is associated with higher liquidity and new capital inflow to the market. This is considered the equivalent of increase in efficiency and the ongoing trend continues. When Open Interest decreases, it is considered a sign of liquidation in the market, investors are leaving and the overall demand for an asset is on a decline, fueling a bearish sentiment among investors.
Funding fees bridge the difference between spot prices and prices of futures contracts of an asset by increasing liquidation risks faced by traders. A consistently high and positive funding rate implies there is a bullish sentiment among market participants and there is an expectation of a price hike. A consistently negative funding rate for an asset implies a bearish sentiment, indicating that traders expect the cryptocurrency’s price to fall and a bearish trend reversal is likely to occur.

超过一百万用户依赖 FXStreet 获取实时市场数据、图表工具、专家洞见和外汇新闻。其全面的经济日历和教育网络研讨会帮助交易者保持信息领先、做出审慎决策。FXStreet 拥有约 60 人的团队,分布在巴塞罗那总部及全球各地区。
阅读更多


