
Trade The World
Crypto Today: Bitcoin, Ethereum, XRP uptrend cools amid surging ETF inflows
作者 John Isige
发布日期: 6 Jan 2026 | 修改日期: 6 Jan 2026


POPULAR ARTICLES

Bitcoin (BTC) is retracing toward support at $93,000 at the time of writing on Tuesday, after reaching a previous day’s high of $94,789. Ethereum (ETH) and Ripple (XRP) uptrend has cooled after several days of persistent gains, suggesting potential profit-taking.
- Bitcoin holds above the $93,000 support level, signaling potential profit-taking despite rising ETF inflows.
- Ethereum consolidates between the 50-day EMA support and the 100-day EMA resistance as institutional demand continues to build.
- XRP stalls around a multi-month trendline as retail demand soars to $4.55 billion in futures Open Interest.
Bitcoin (BTC) is retracing toward support at $93,000 at the time of writing on Tuesday, after reaching a previous day’s high of $94,789. Ethereum (ETH) and Ripple (XRP) uptrend has cooled after several days of persistent gains, suggesting potential profit-taking.
Meanwhile, institutional demand has made a notable comeback, with BTC, ETH, and XRP spot Exchange Traded Funds (ETFs) recording significant inflows. If demand for crypto ETF products steadies in the coming weeks, the path with the least resistance could remain upward.
ETF inflows strengthen recovery outlook for major cryptos
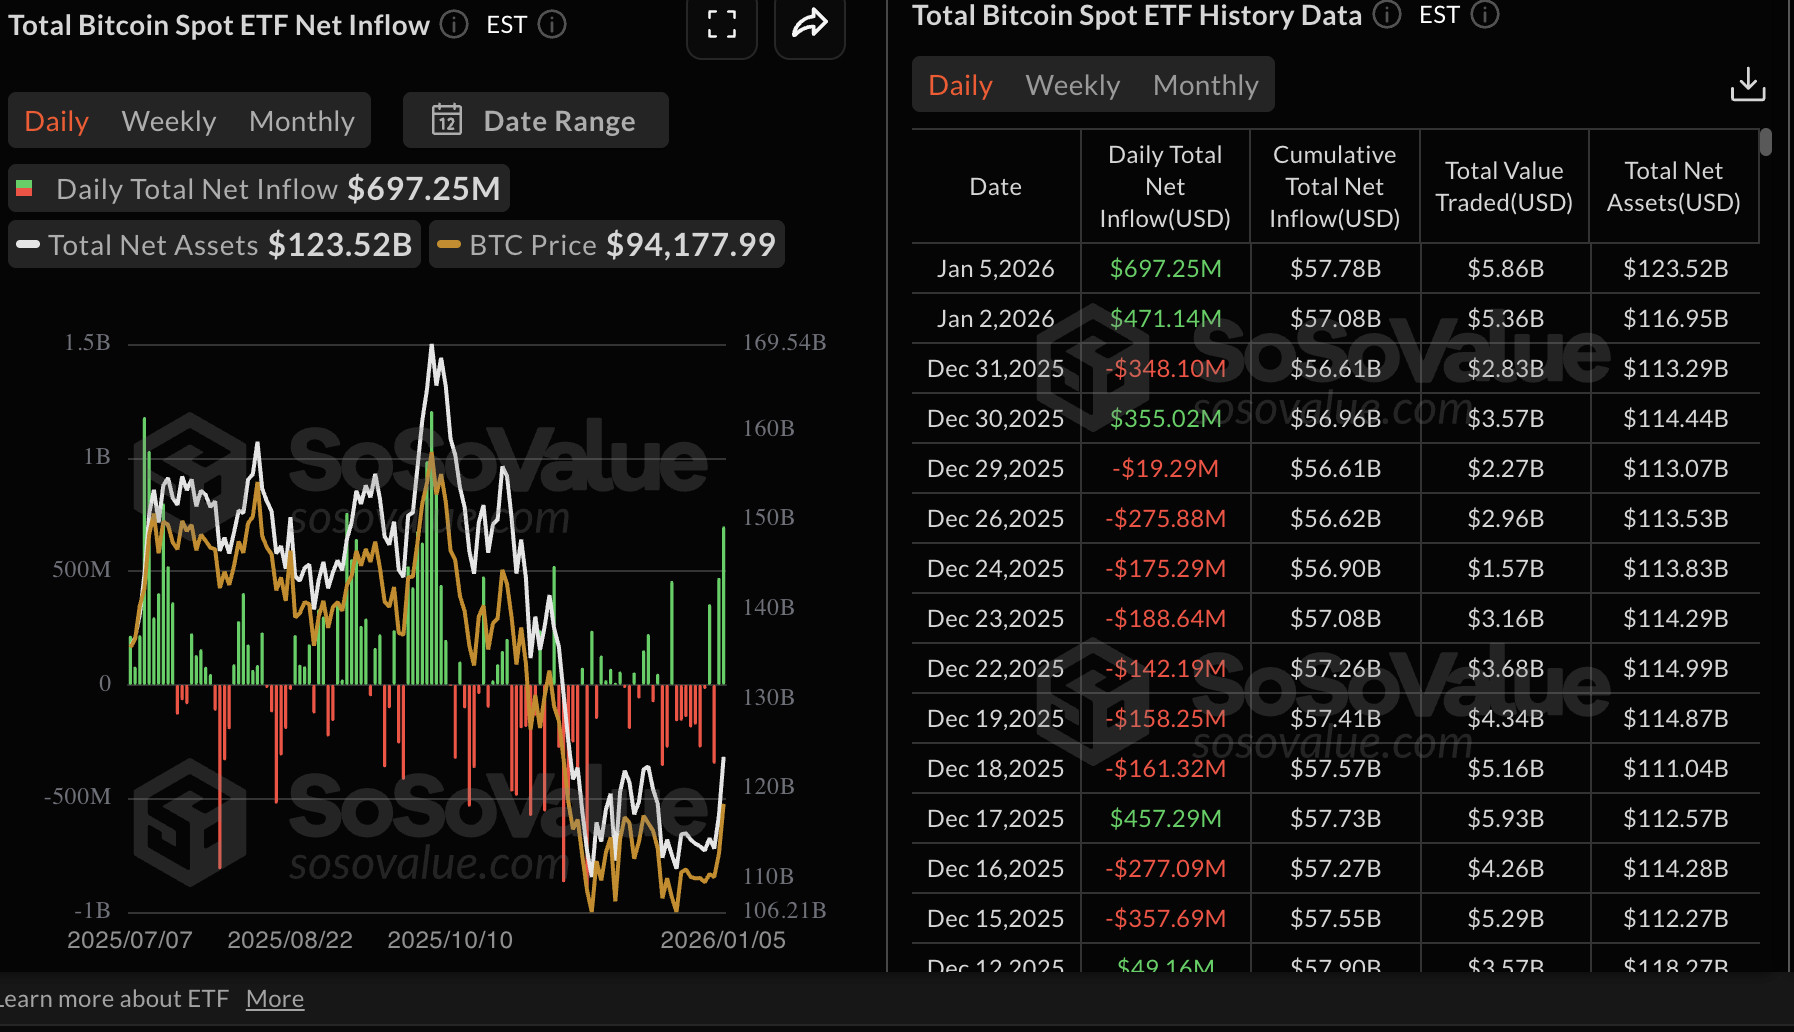
Bitcoin spot ETFs recorded a massive jump in inflows, reaching approximately $697 million on Monday. This marks a significant increase in demand for US-listed BTC ETFs, which recorded inflows of roughly $471 million on Friday.
The cumulative net inflow volume stands at $57.78 billion with net assets of $123.52 billion. Improving risk appetite for Bitcoin ETFs supports Bitcoin’s potential upside.
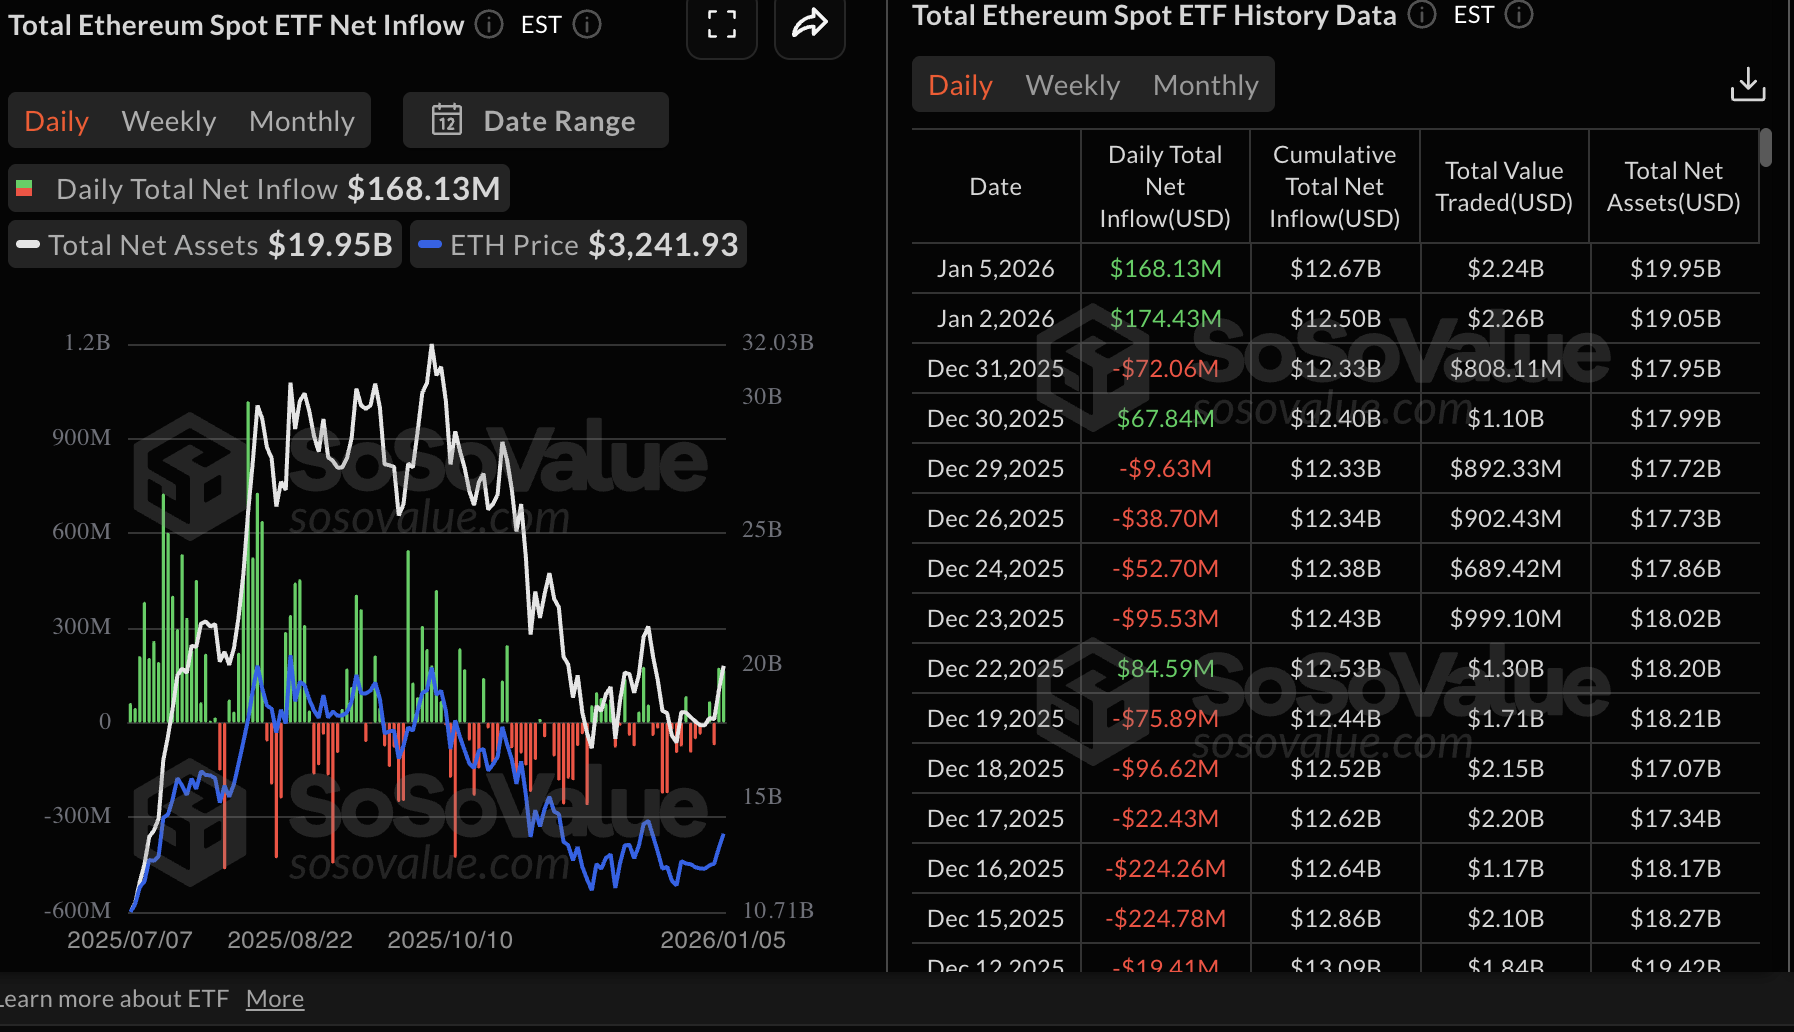
Ethereum ETFs, on the other hand, remained on the demand side despite the inflow volume shrinking slightly to $168 million on Monday from approximately $174 million on Friday.
The cumulative net inflow volume stands at $12.67 billion with net assets of nearly $20 billion.
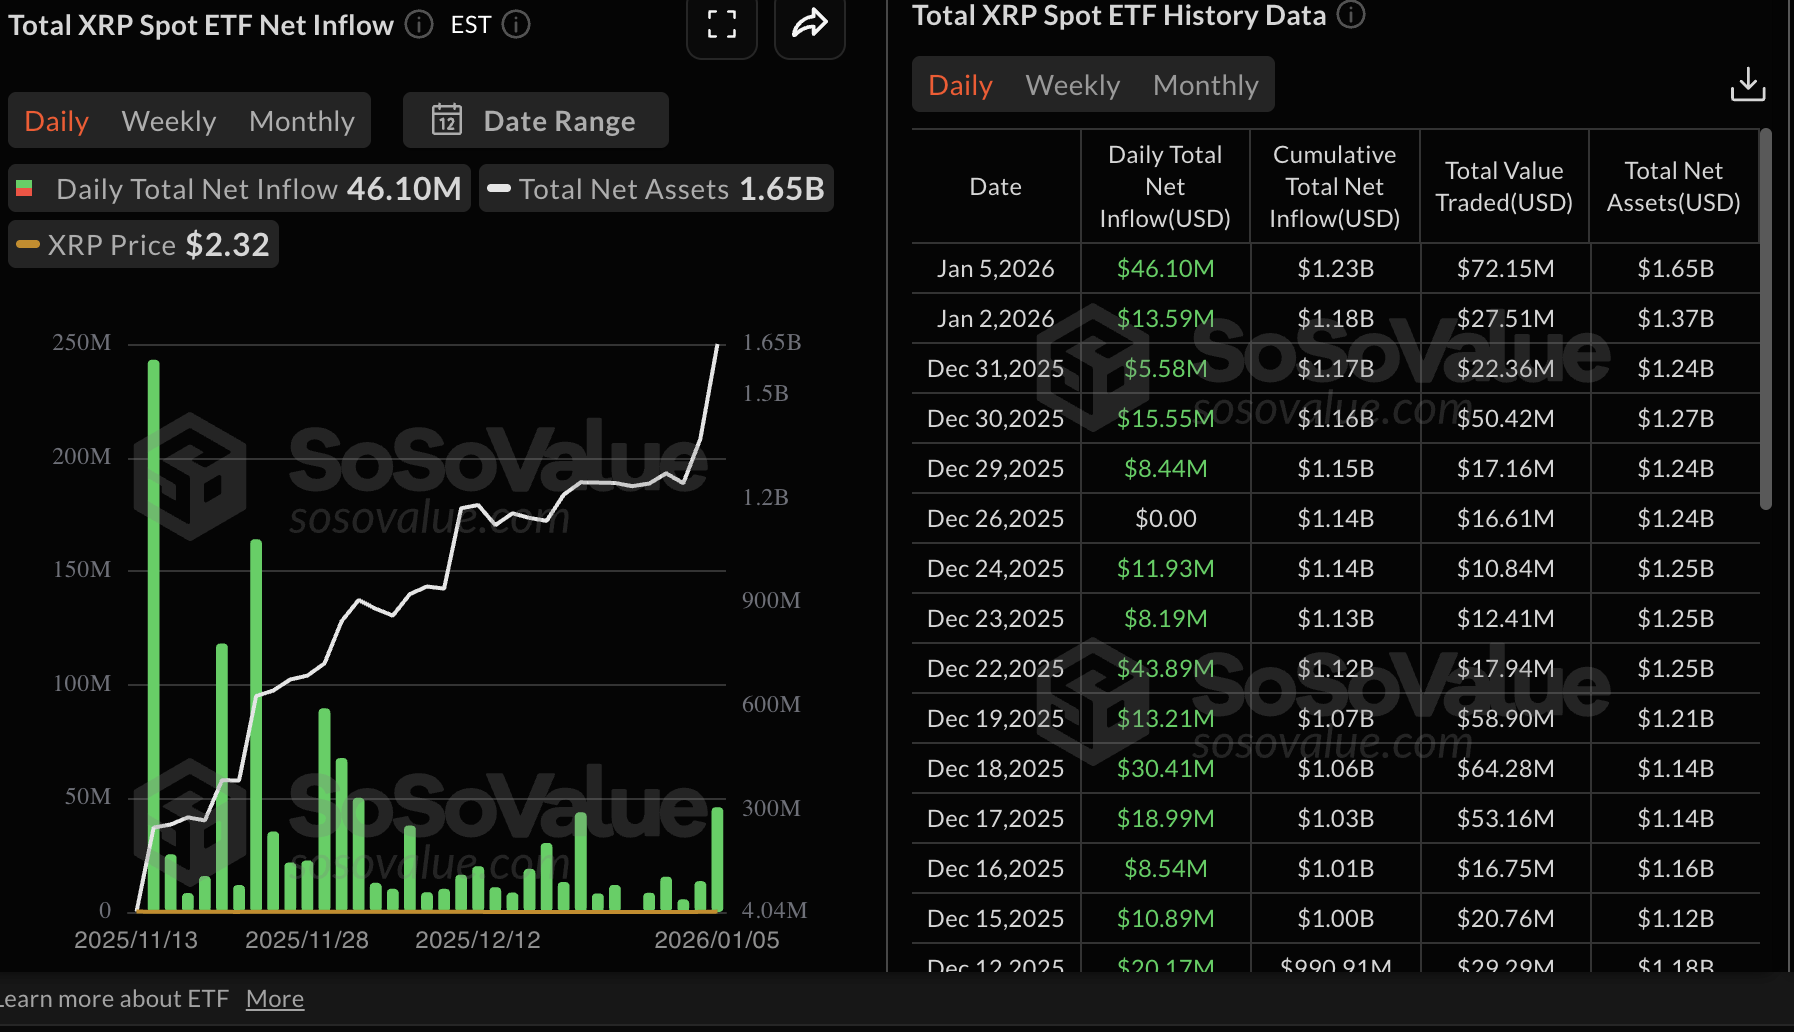
Meanwhile, XRP ETFs saw inflows surge to approximately $46 million on Monday, up from roughly $13.6 million on Friday. Interest in US-listed XRP ETFs has steadied since their debut in November, boosting cumulative inflows to $1.23 billion and related net assets to $1.65 billion.
Still on XRP, the derivatives market posted a notable increase in futures Open Interest (OI), which averaged $4.55 billion at the time of writing on Tuesday, up from $3.77 billion on Monday.
If retail and institutional demand increase simultaneously, the odds of a steady uptrend, targeting the $3.00 pivotal level, would increase significantly.
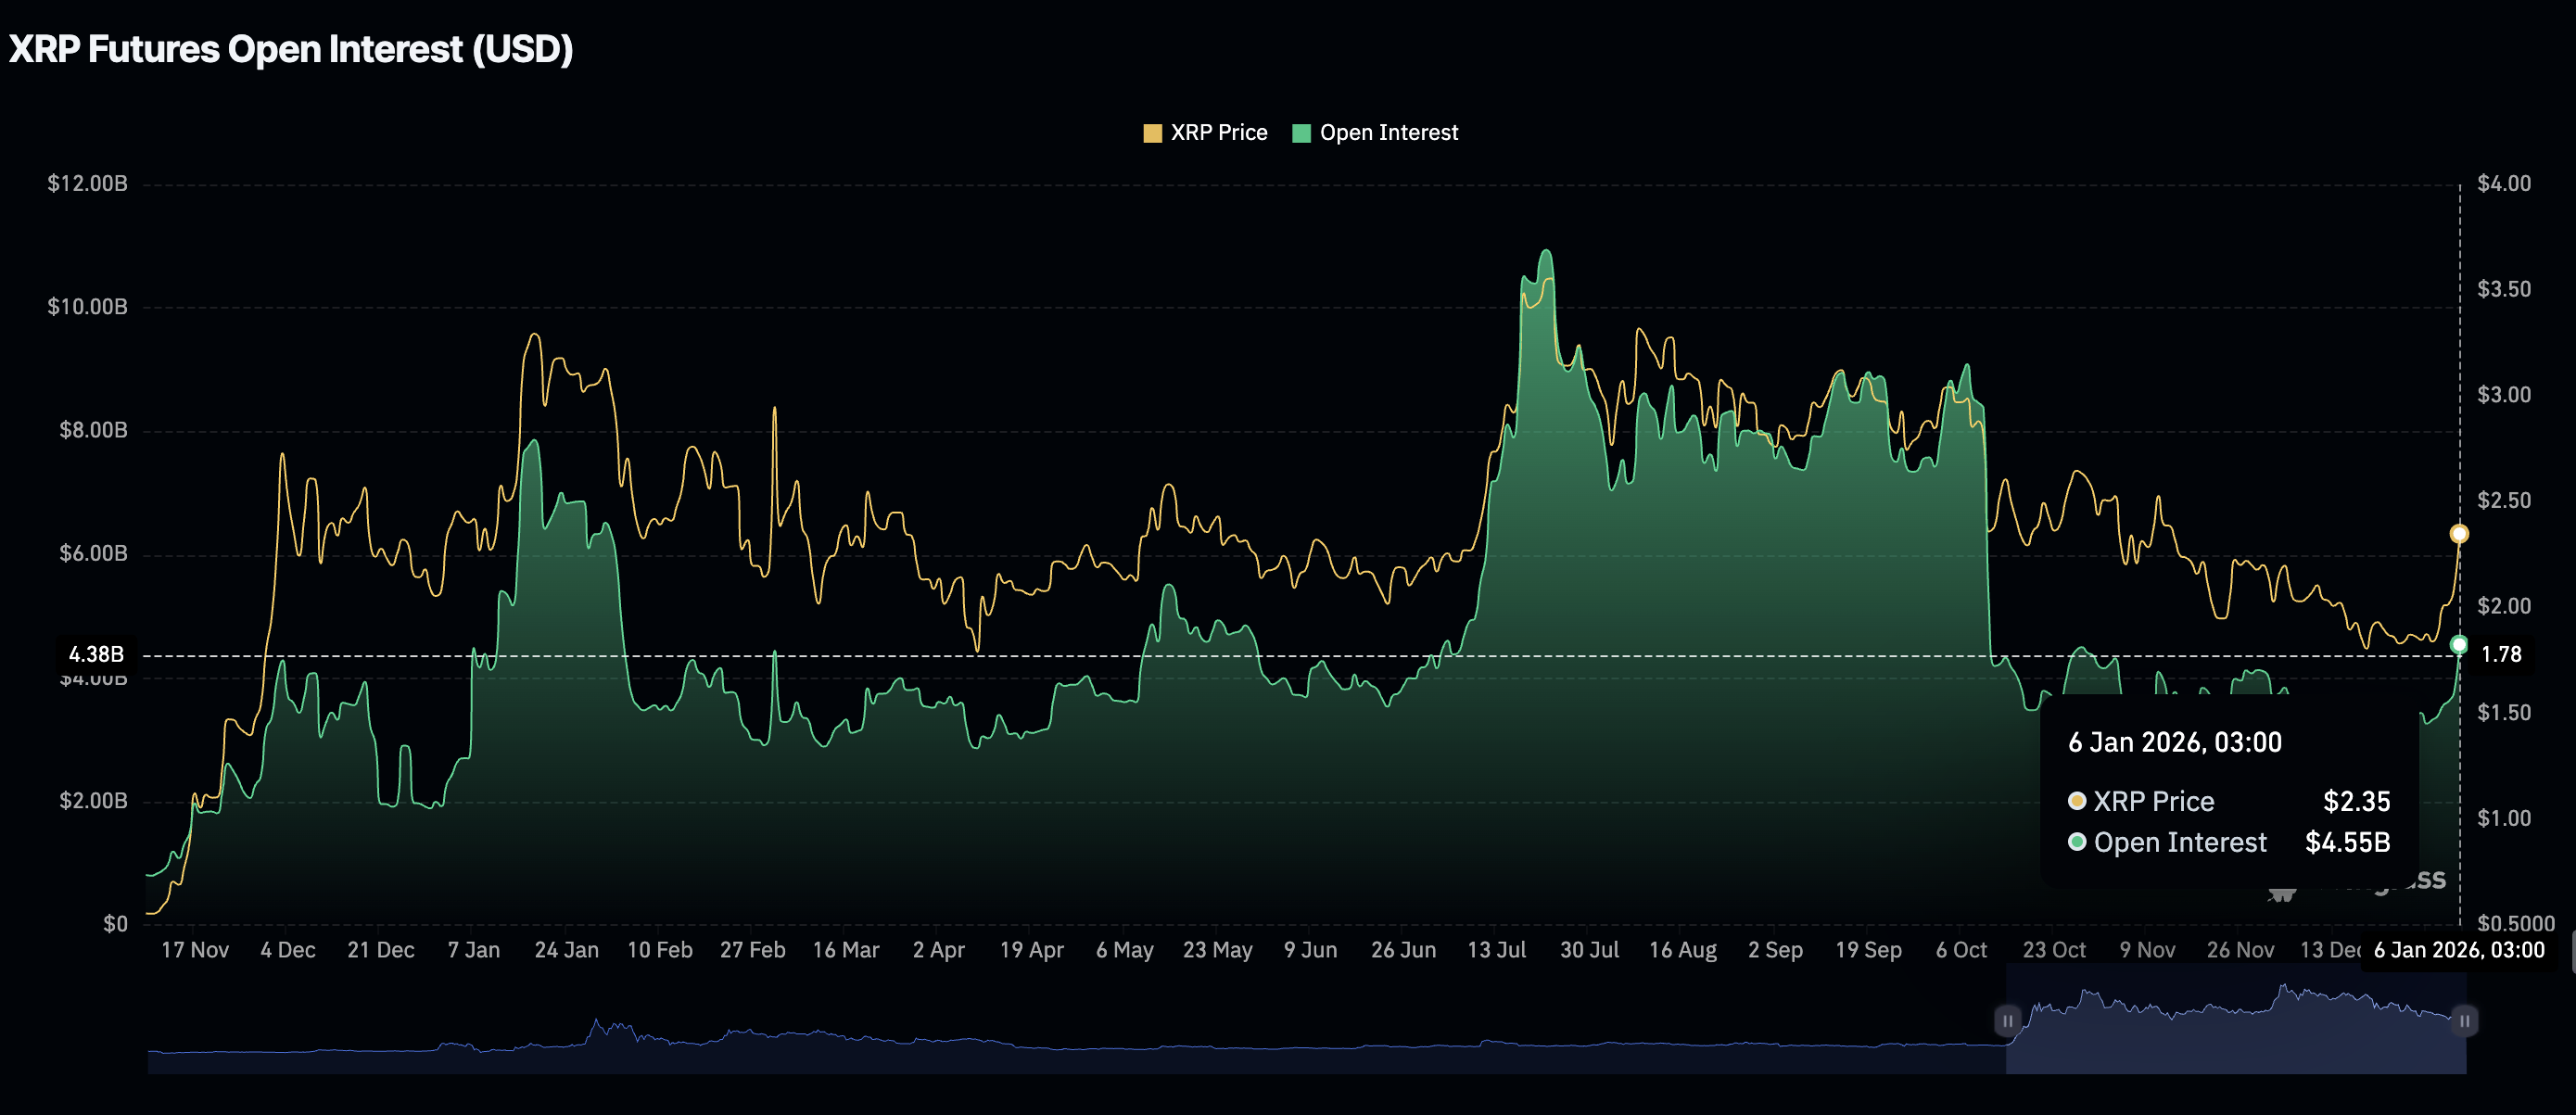
Chart of the day: Bitcoin holds short-term support
Bitcoin holds above support at $93,000 at the time of writing on Tuesday, after correcting from Monday’s high of $94,789. The Relative Strength Index (RSI) at 63 on the daily chart is starting to show weakness, which could reflect profit-taking following the persistent price increase since Thursday.
The largest coin by market capitalisation is also trading above the 50-day Exponential Moving Average (EMA) at $91,723, suggesting that buyers have a slight edge over sellers.
The Moving Average Convergence Divergence (MACD) indicator on the same daily chart supports a short-term bullish outlook for Bitcoin. Investors would be inclined to increase their exposure as long as the blue MACD line maintains a positive divergence above the red signal line and the green histogram bars continue to expand above the mean line.
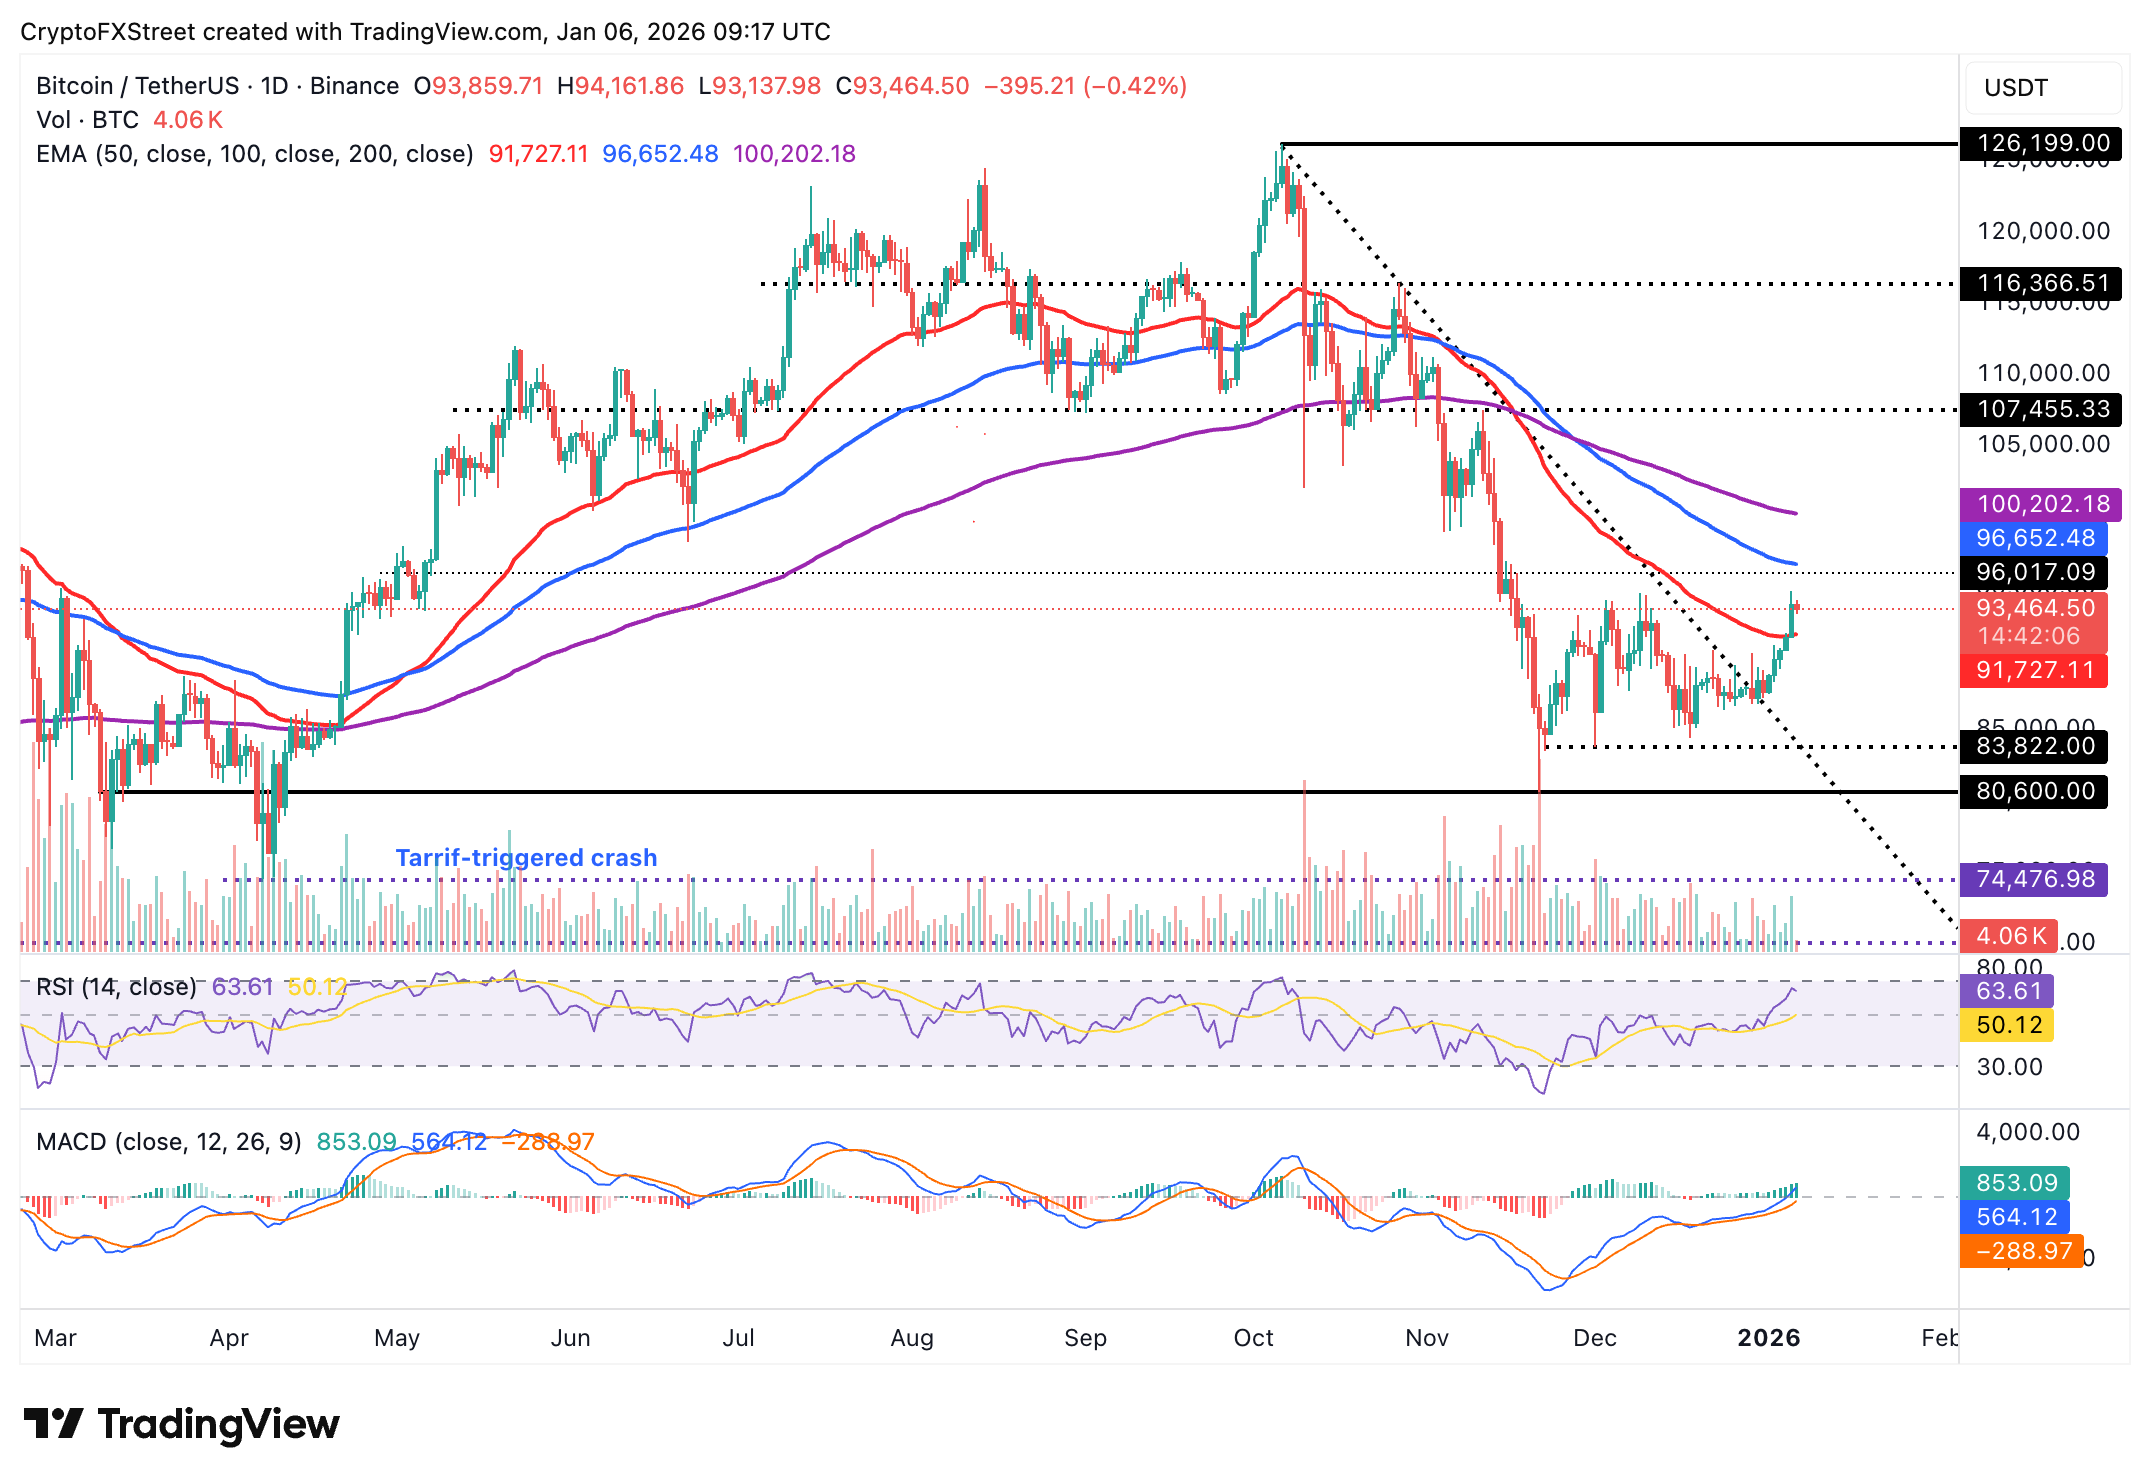
A close above the 100-day EMA at $96,651 would underscore Bitcoin’s recovery potential toward $100,000. Still, a close below the 50-day EMA could encourage aggressive profit-taking, increasing the risk of an extended decline below $90,000.
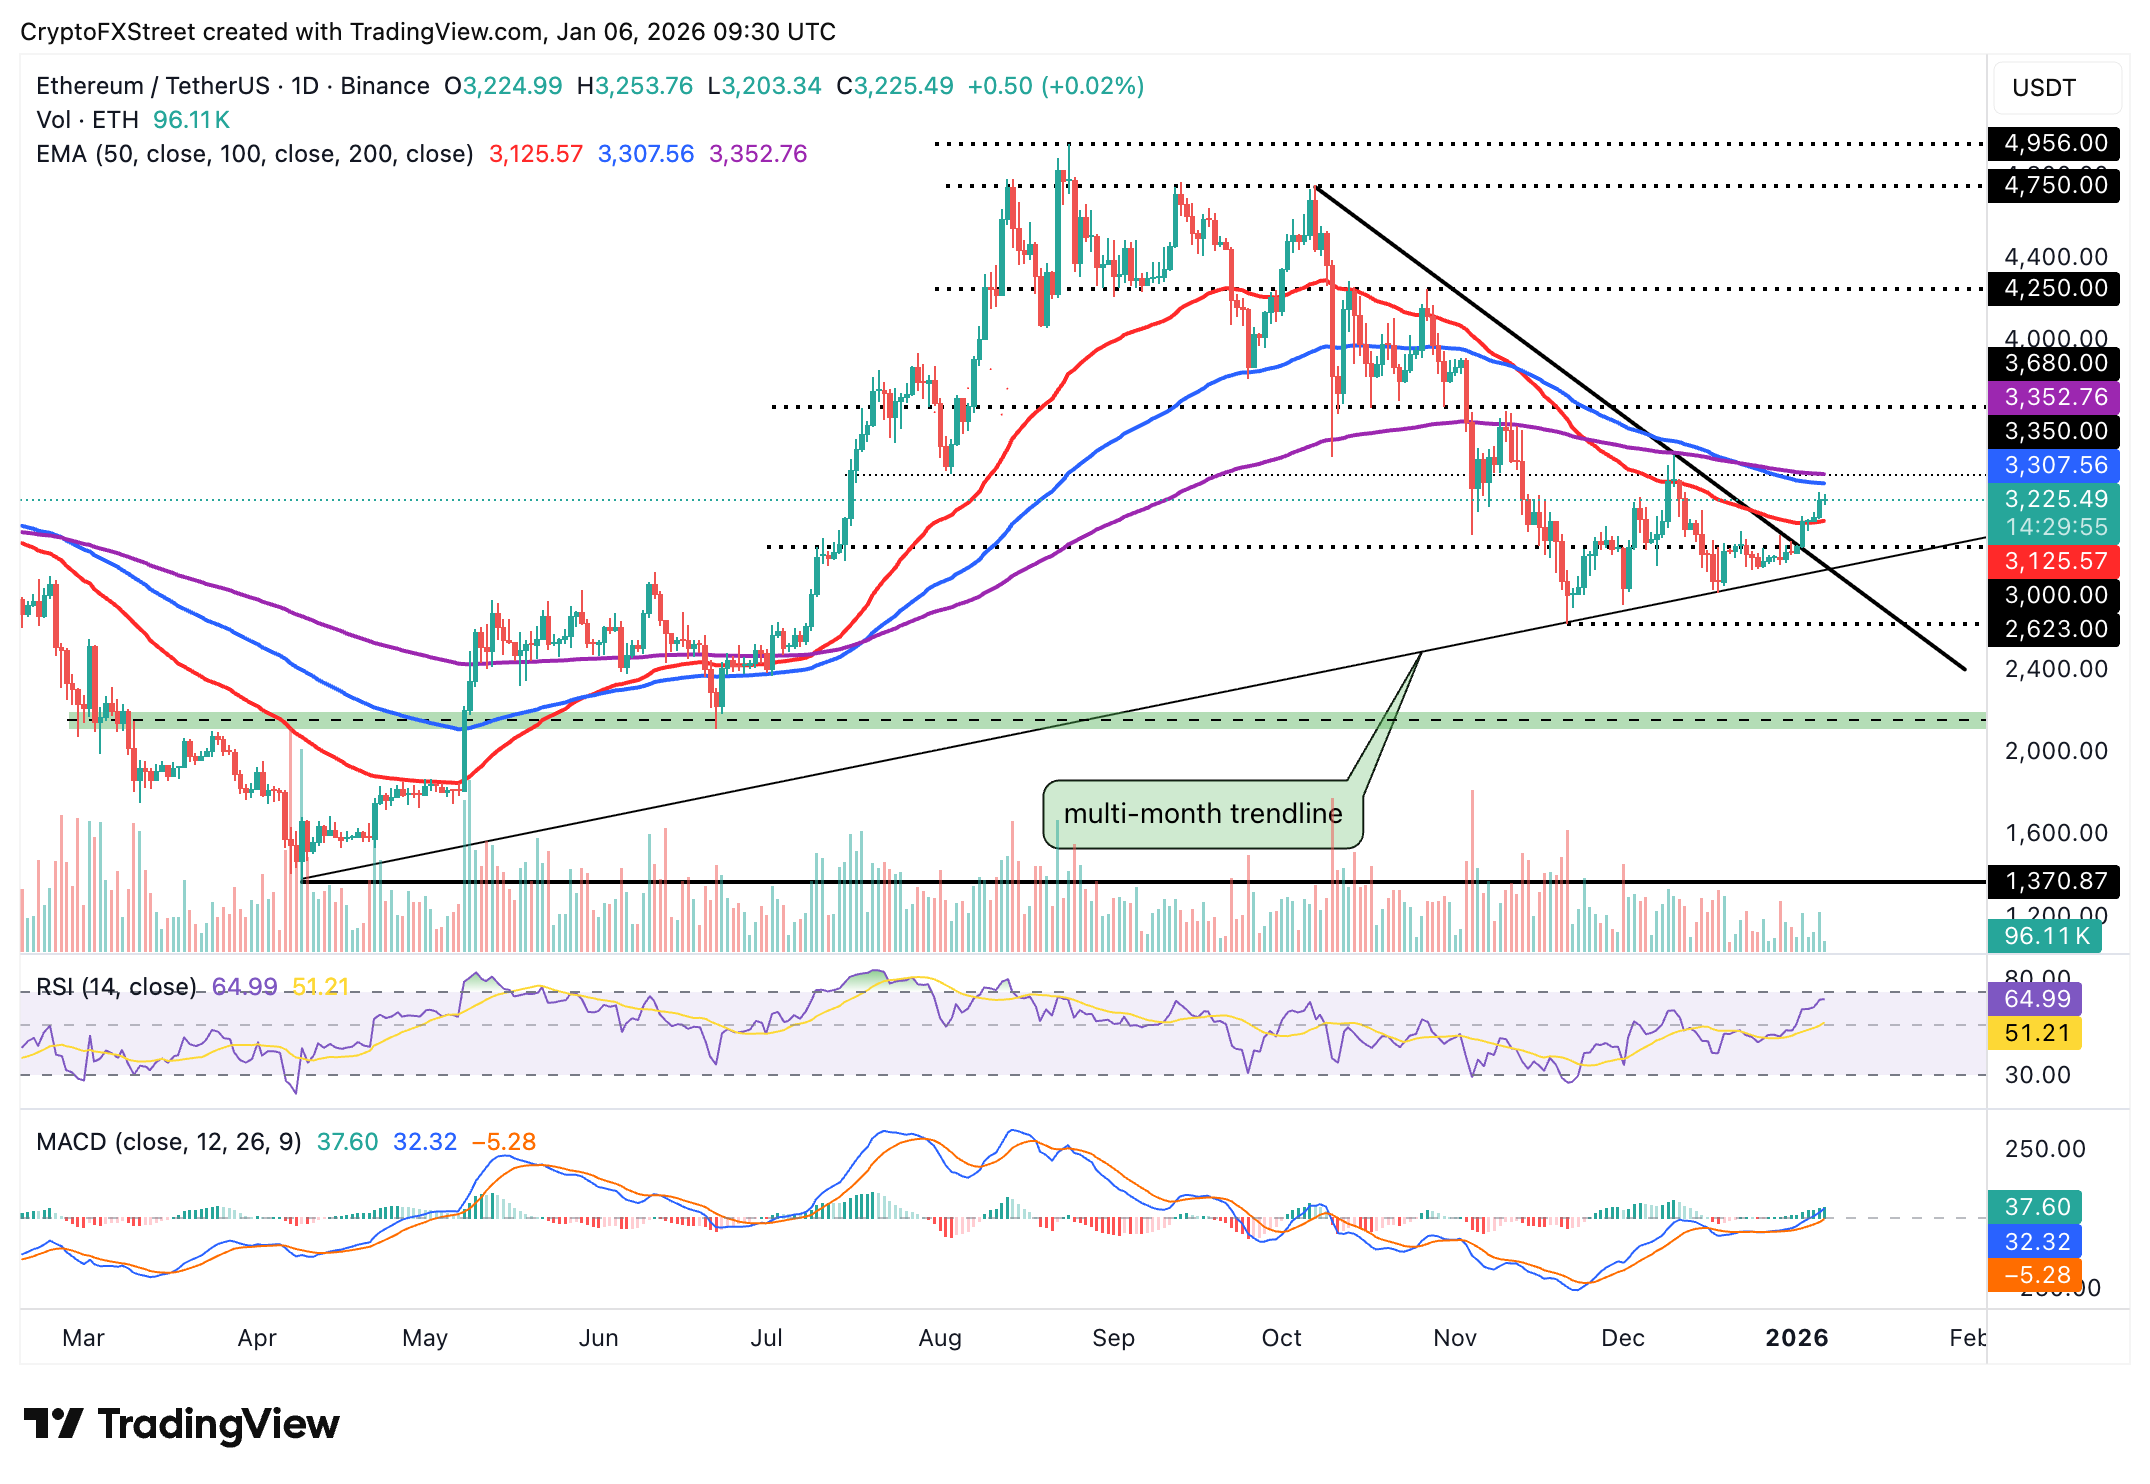
Altcoins technical outlook: Ethereum, XRP stall, but bulls remain optimistic
Ethereum is trading above $3,200 at the time of writing on Tuesday, with downside supported by the 50-day EMA at $3,125, while the 100-day EMA at $3,307 caping the upside.
Bulls have an upper hand, considering the MACD indicator on the daily chart extends into the positive region while the blue line maintains a positive divergence above the red signal line. The green histogram bars are also expanding above the mean line, which may continue to encourage investors to increase risk exposure.
A break above the moving average cluster represented by the 100-day EMA at $3.307 and the 200-day EMA at $3,352 would boost ETH’s recovery potential. Above this hurdle, the next resistance sits at $3,350, which was tested on November 10.
The RSI on the same chart has stabilized at 65, signaling possible consolidation before the next breakout. If the RSI declines toward the midline at 50, a reversal in the Ethereum price could occur. A close below the 50-day EMA would increase the odds of Ethereum dropping below $3,000.
As for XRP, recovery has stalled around the 200-day EMA at $2.35 at the time of writing on Tuesday. A descending trendline from the record high of $3.66 also caps the upside.
The RSI on the daily chart is stabilising at 74 in the overbought region, suggesting XRP’s uptrend could be in jeopardy if investors aggressively book profits, which could add to selling pressure.
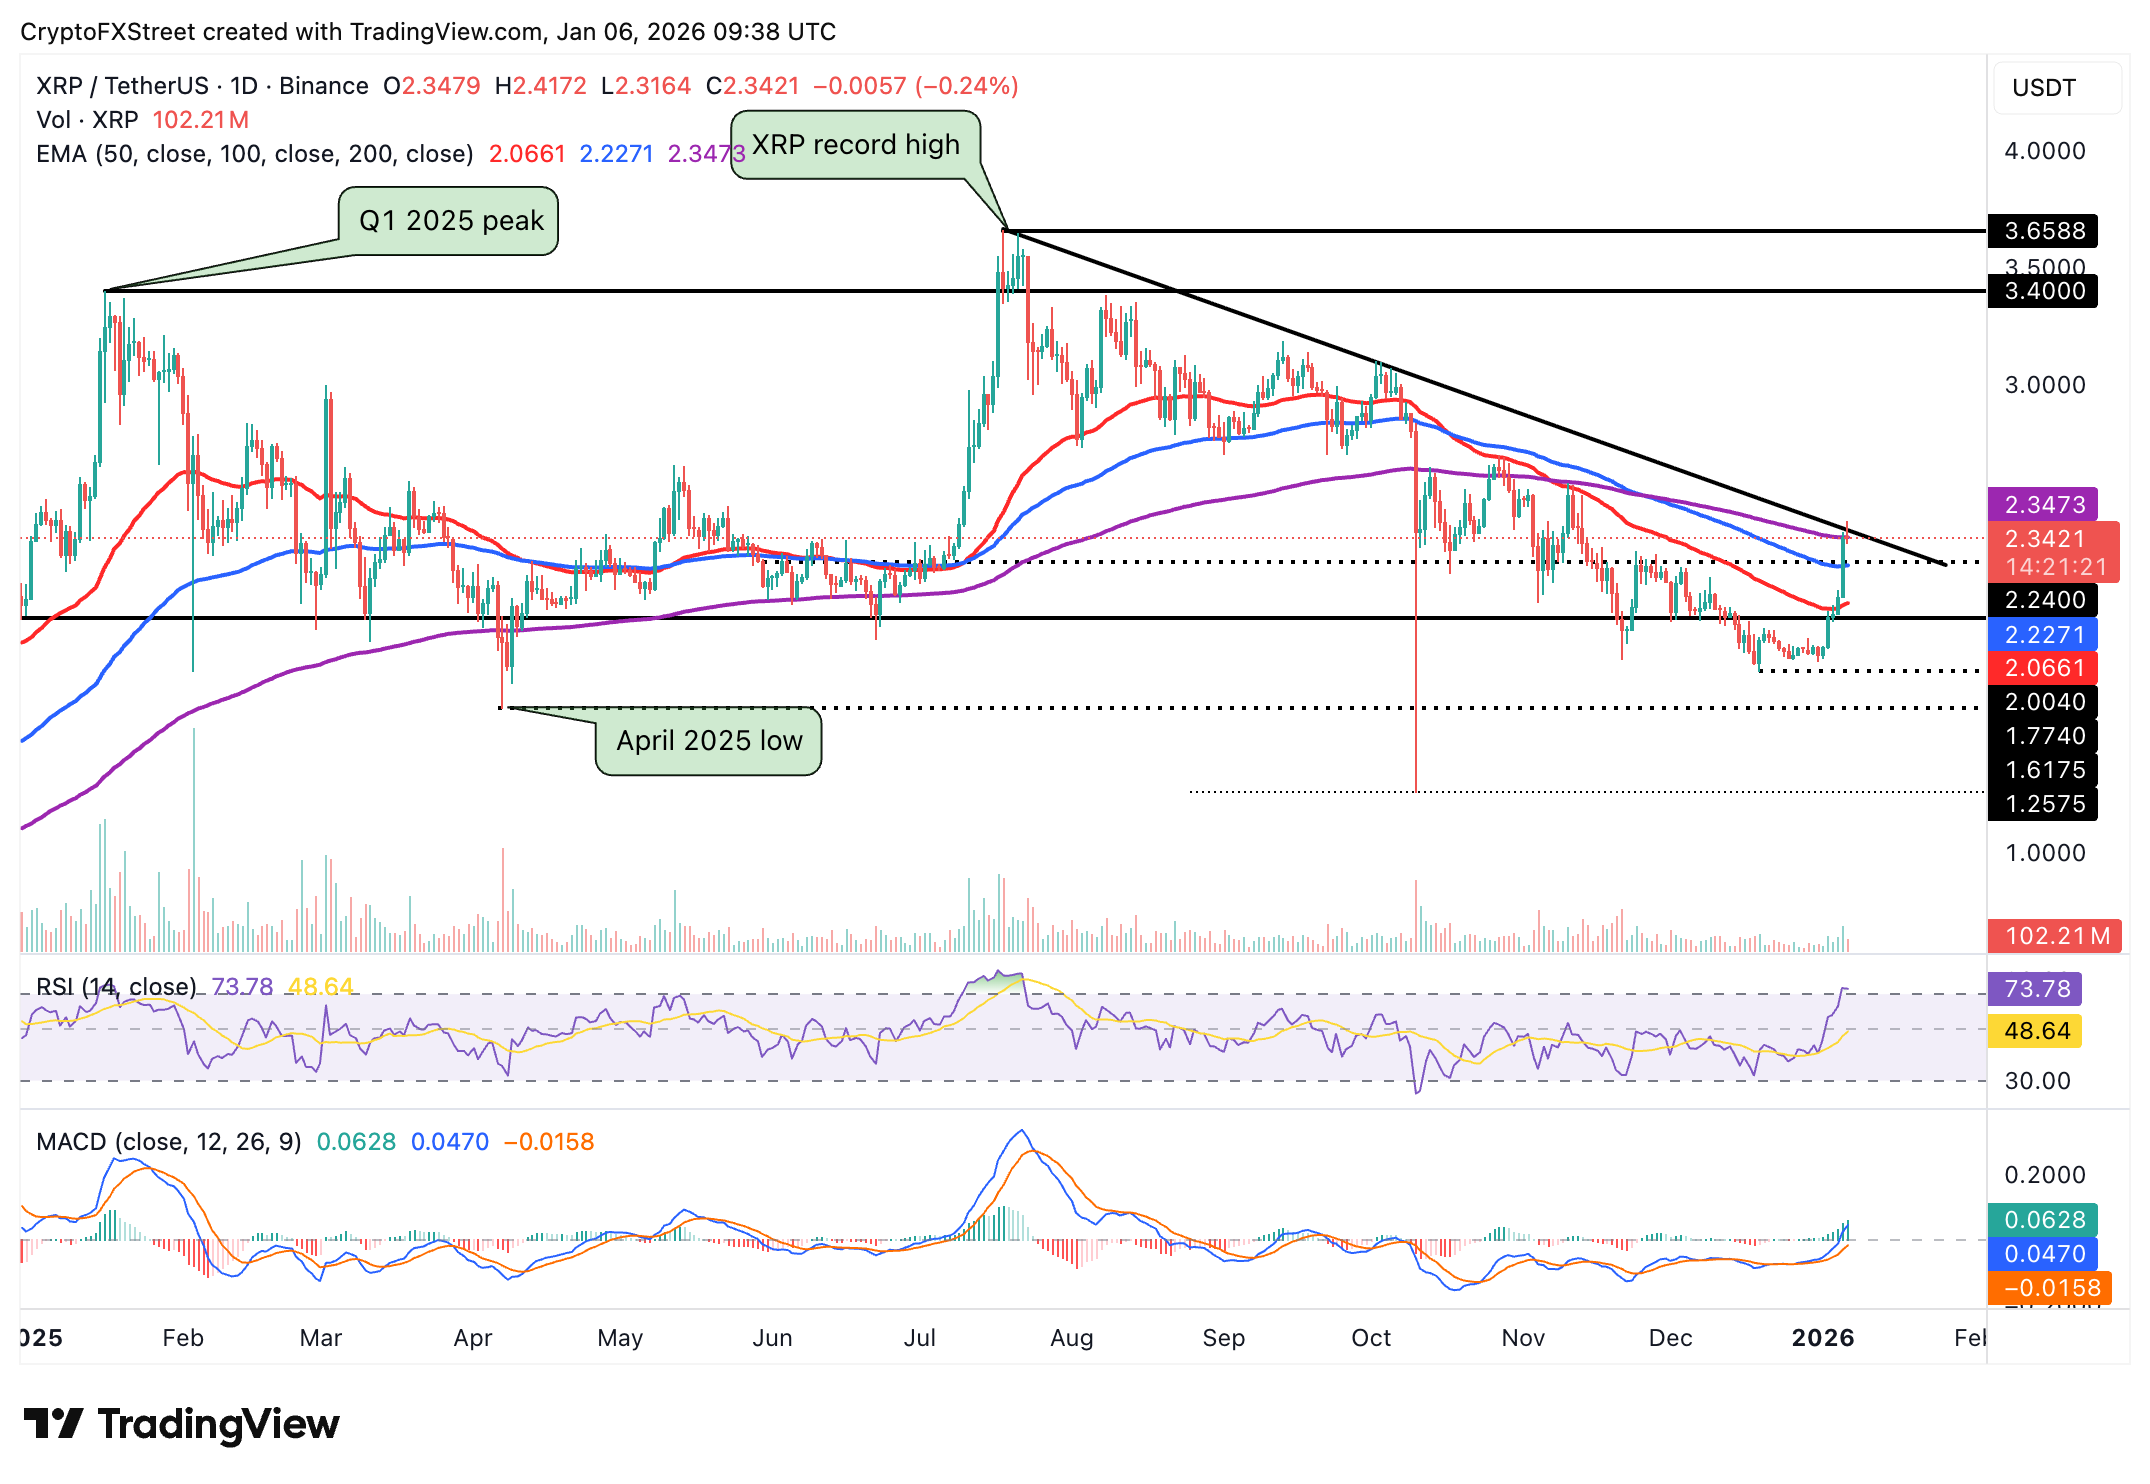
The 100-day EMA is in line to offer support at $2.22, with further decline likely to be contained by the 50-day EMA at $2.07. Still, the MACD indicator shows that bulls have the upper hand, as evidenced by the blue line rising above the signal line while the green histogram bars expand.
A sustained uptrend above the trendline and the 200-day EMA at $2.35 would boost the chances of XRP closing in on $3.00.
Crypto ETF FAQs
An Exchange-Traded Fund (ETF) is an investment vehicle or an index that tracks the price of an underlying asset. ETFs can not only track a single asset, but a group of assets and sectors. For example, a Bitcoin ETF tracks Bitcoin’s price. ETF is a tool used by investors to gain exposure to a certain asset.
Yes. The first Bitcoin futures ETF in the US was approved by the US Securities & Exchange Commission in October 2021. A total of seven Bitcoin futures ETFs have been approved, with more than 20 still waiting for the regulator’s permission. The SEC says that the cryptocurrency industry is new and subject to manipulation, which is why it has been delaying crypto-related futures ETFs for the last few years.
Yes. The SEC approved in January 2024 the listing and trading of several Bitcoin spot Exchange-Traded Funds, opening the door to institutional capital and mainstream investors to trade the main crypto currency. The decision was hailed by the industry as a game changer.
The main advantage of crypto ETFs is the possibility of gaining exposure to a cryptocurrency without ownership, reducing the risk and cost of holding the asset. Other pros are a lower learning curve and higher security for investors since ETFs take charge of securing the underlying asset holdings. As for the main drawbacks, the main one is that as an investor you can’t have direct ownership of the asset, or, as they say in crypto, “not your keys, not your coins.” Other disadvantages are higher costs associated with holding crypto since ETFs charge fees for active management. Finally, even though investing in ETFs reduces the risk of holding an asset, price swings in the underlying cryptocurrency are likely to be reflected in the investment vehicle too.

FXStreet
超过一百万用户依赖 FXStreet 获取实时市场数据、图表工具、专家洞见和外汇新闻。其全面的经济日历和教育网络研讨会帮助交易者保持信息领先、做出审慎决策。FXStreet 拥有约 60 人的团队,分布在巴塞罗那总部及全球各地区。
Read More


