
Trade The World
Dow Jones Industrial Average tilts further into the green on Friday
作者 Joshua Gibson
发布日期: 20 Sep 2025 | 修改日期: 20 Sep 2025


POPULAR ARTICLES

The Dow Jones Industrial Average (DJIA) chalked in another slim but decisive gain on Friday, bringing the major equity index’s weekly performance to around a full percentage point gain.
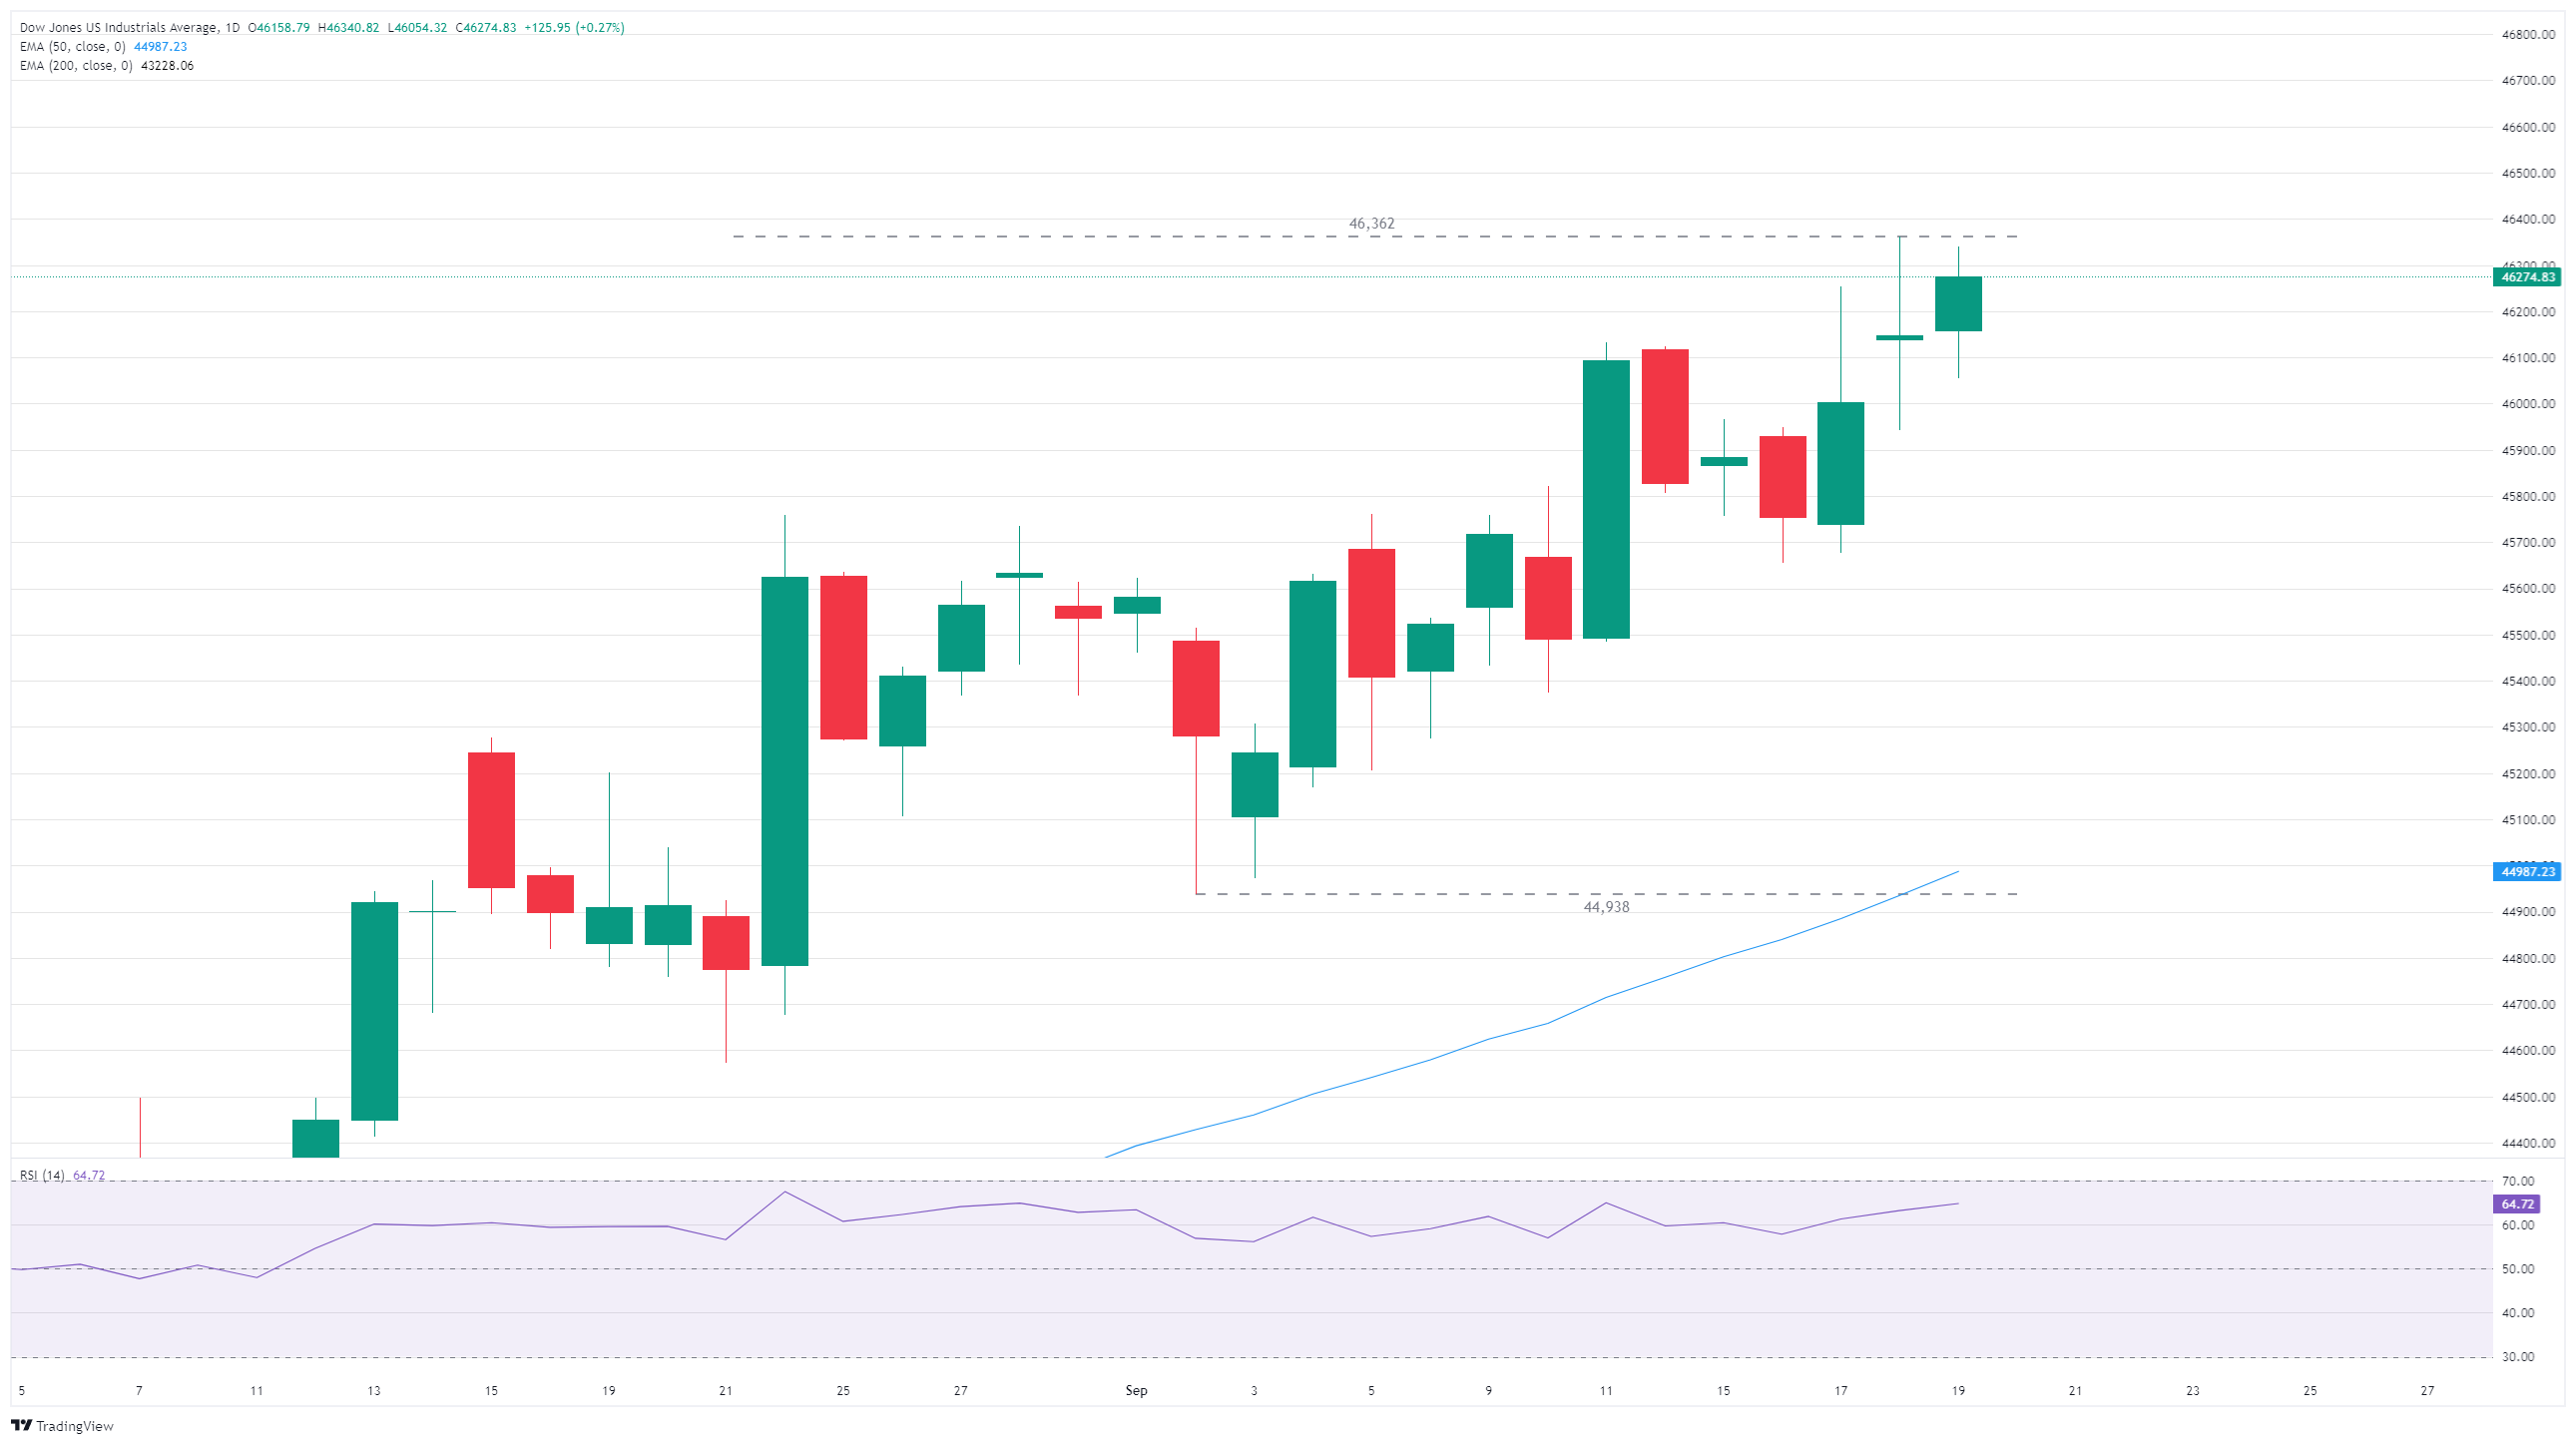
- The Dow Jones climbed into 46,250 on Friday, adding another bullish day on the backend.
- Equities have risen after the Fed trimmed interest rates through the midweek.
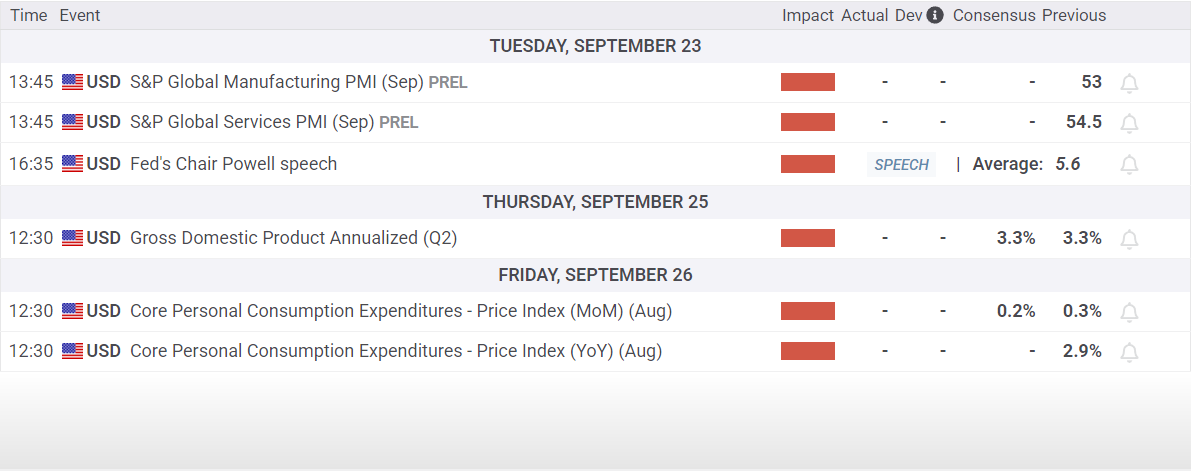
- Coming up next week: PMI survey results and another round of PCE inflation data.
The Dow Jones Industrial Average (DJIA) chalked in another slim but decisive gain on Friday, bringing the major equity index’s weekly performance to around a full percentage point gain. The Dow Jones has climbed into record highs on the back of the Federal Reserve’s (Fed) latest rate cut, and investors are positioning themselves for a series of consecutive follow-up cuts through the end of the year.
Dow climbs on Fed support
The Dow Jones has thus far put in a stellar performance, especially for late in the third quarter. While September is typically a soft season for equities, this September has bucked the trend. The Dow Jones is up over 1.6% for the month, marking in a string of high-water marks, and is on pace to close in the green for a fifth straight month.
Most sectors are on the high side for Friday, with tech stocks taking their usual place at the front of the pack, climbing 0.72% for the day. Consumer discretionary stocks took second place, rising around 0.5%, while energy stocks suffered a decline of around 1.45%.
Fresh batch of inflation data in the pipe
With the Fed’s long-awaited initial interest rate cut finally in the books, traders will have to pivot back to data watching next week. The latest round of S&P Global Purchasing Managers Index (PMI) survey results are due next Tuesday; US Gross Domestic Product (GDP) growth is scheduled for next Thursday; and an update to US Personal Consumption Expenditures Price Index (PCE) inflation is slated for next Friday.
Dow Jones daily chart
Economic Indicator
S&P Global Manufacturing PMI
The S&P Global Manufacturing Purchasing Managers Index (PMI), released on a monthly basis, is a leading indicator gauging business activity in the US manufacturing sector. The data is derived from surveys of senior executives at private-sector companies from the manufacturing sector. Survey responses reflect the change, if any, in the current month compared to the previous month and can anticipate changing trends in official data series such as Gross Domestic Product (GDP), industrial production, employment and inflation. A reading above 50 indicates that the manufacturing economy is generally expanding, a bullish sign for the US Dollar (USD). Meanwhile, a reading below 50 signals that activity in the manufacturing sector is generally declining, which is seen as bearish for USD.
Read more.Next release: Tue Sep 23, 2025 13:45 (Prel)
Frequency: Monthly
Consensus: -
Previous: 53
Source: S&P Global

FXStreet
超过一百万用户依赖 FXStreet 获取实时市场数据、图表工具、专家洞见和外汇新闻。其全面的经济日历和教育网络研讨会帮助交易者保持信息领先、做出审慎决策。FXStreet 拥有约 60 人的团队,分布在巴塞罗那总部及全球各地区。
Read More


